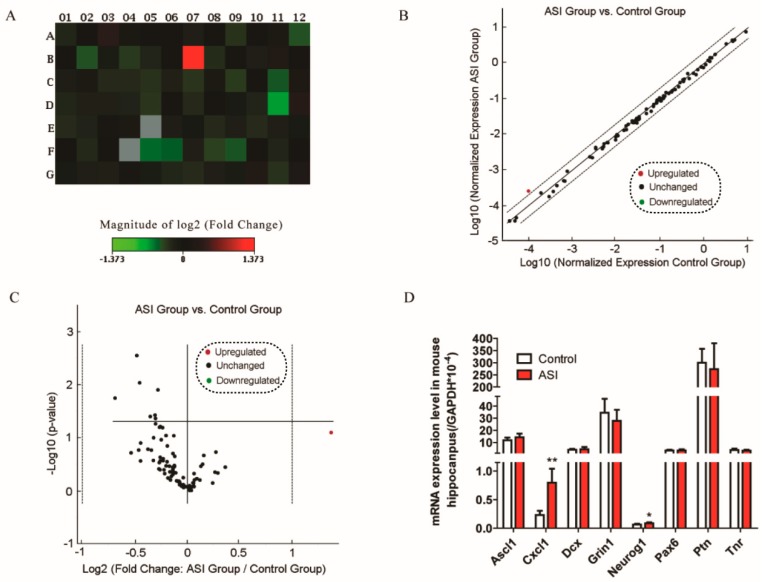
Figure 5.
The effect of ASI (25 mg/kg) on eighty-four neurogenesis related genes. (A) The heat map provides a graphical representation of fold change between two groups overlaid onto PCRarray plate layout; (B) The scatter plot compares the normalized expression of every gene on the array between two groups by plotting one against another to quickly visualize gene expression changes. The central line indicated unchanged gene expression; (C) The volcano plot displays statistical significance versus fold-change on the y- and x-axes, respectively, enabling identification of genes with significant changes; (D) Verification of mRNA expression levels in mouse hippocampus; n = 6/group. * p < 0.05; ** p < 0.01. The data are presented as mean ± SD.

