Abstract
Background:
MicroRNAs (miRNA) are expected as useful biomarkers for various diseases. We studied the pre-analytical factors causing variation in the analysis of miRNA.
Material and Methods:
Blood samples were collected from 25 healthy subjects. Plasma and serum were obtained from the same samples. The levels of miR-451, -16, -126, and -223 were analyzed using RT-qPCR. Cel-miR-39 was added as a spiked-in control in each sample.
Results:
With the exception of miR-451, the levels of the miRNAs in plasma were higher than in serum. After high-speed centrifugation, the levels of miRNAs were almost equal between plasma and serum except for miR-451. Membrane filtration with 0.45 µm pore size reduced the levels of plasma miRNAs. The coagulation accelerators for serum processing did not affect the analysis of miRNA. The use of fraction containing particles of > 0.45 µm in size showed the inhibitory effect on the analysis of plasma miR-451. The RNase inhibitor was effective for protecting against the degradation of miRNAs.
Conclusion:
Plasma contains factors modifying miRNA profiles. The immediate processing of plasma with membrane filtration and RNase inhibitor may be a relevant method for achieving the stable analysis of miRNA
Keywords: microRNA, plasma, serum, standardization, apoptosis, protien
1. INTRODUCTION
MicroRNAs are short non-coding RNAs with 22-25 nucleotides length and sequences are phylogenetically well conserved among different species [1, 2]. The majority of miRNAs are located in the non-coding region of the genome [1, 3]. Firstly, miRNAs are transcribed to primary miRNAs (pri-miRNAs), which are processed to precursor miRNAs (pre-miRNAs) with enzymes, DROSHA and DGCR8. A transporter protein, Exportin-5, carries pre-miRNAs to the cytoplasm, where pre-miRNAs are processed to mature miRNAs in two ways, mainly with RNaseIII Dicer; some with Argonaute2 (Ago2) [1, 3]. Mature miRNAs bind to the RNA-induced silencing complex (RISC). MicroRNA-RISC complexes suppress the expression of target genes by digesting
messenger RNAs (mRNAs) or by inhibiting translation. Almost 50% of the human genes have miRNA binding site on the 3' untranslated region of mRNA [4]. Thus, post-transcriptional controls by miRNAs are important for many cellular functions, including proliferation, differentiation, development, and apoptosis [1, 3].
The expression profiles of cellular miRNA depend on the tissue or cell lineages [5]. Many previous studies have shown that dysregulated miRNA expression profiles were sensitive biomarkers for various pathological states [6-11]. Human body fluids, including plasma and serum, contain many types of miRNA [5, 10, 11]. Circulating miRNAs are stable in plasma or serum despite the coexistence of RNase since a large part of circulating miRNAs is present inside Extracellular Vesicles (EVs), such as Microparticles (MPs), and exosomes [12, 13]. The miRNA profiles in exosomes from different cell lineages are different, suggesting that miRNAs in exosomes may have specific functions related to homeostasis or the pathophysiology of various diseases. Other forms of circulating miRNAs include a complex with Argonaute2 (Ago2) protein, which is the main component of RISC [14], and miRNAs bound with lipids [8, 11].
The origins of circulating miRNAs are heterogeneous including blood cells, endothelial cells, cardiomyocytes, nerve cells, and cancer cells [7]. The origin of circulating miRNAs can be estimated by analyzing the surface molecules of exosomes [5]. Blood cells are the main origins of circulating miRNAs [5, 15, 16]. Red blood cells contain an erythroid-specific miRNA (miR-451), which is released from old or pathological red blood cells in hemolytic diseases [11, 17-20].
MiR-16 is expressed in many types of body cells, and is abundant in plasma or serum [21]. The expression levels of miR-126 and miR-223 are high in platelets [21, 22]. MiR-223 is also abundant in granulocytes in vivo [17, 24].
There are many evidences to show that circulating miRNAs are useful biomarkers for the prevention, diagnosis and treatment monitoring in neoplastic disease [25-27], heart disease [28, 29], metabolic disease [30], infection [31, 32], and neurological disease [33, 34].
Plasma and serum are the main materials that are used for evaluation of circulating miRNAs. miRNAs are stable enough to be used as biomarkers after freezing and thawing, and long-term frozen storage [35]. However, it is not conclusive yet which blood sample is more relevant as a biomarker [21, 36-38], since the levels of circulating miRNAs differ between plasma and serum [39, 40]. The different processes that are used to obtain plasma and serum may influence the different results, since circulating miRNAs belong to at least four different categories, MPs, exosomes, Ago2-bound, and lipid-bound forms. In the present study, we focus on the differences in the miRNA levels in plasma and serum, to develop the standardized method for the analysis of miRNA.
2. MATERIALS AND METHODs
2.1. Samples
Blood samples were drawn from 25 healthy subjects in hunger condition after obtaining their fully informed consent under the permission of the ethics committee of Kyushu University, International University of Health and Welfare, and Kumamoto University. Plasma was obtained after the centrifugation of 2 mL-EDTA-2Na blood sampling tubes (2 mL), at 1,900×g for 10 min. Serum was obtained using plain tubes (7 mL) containing coagulation accelerators (CAs) using the same centrifugation condition as plasma. In further experiments, the particles such as cellular debris or blood cells from samples were removed with the high-speed centrifugation at 10,000×g, for 1 min. The supernatants were transferred to new tubes, and stored at -80°C after mixing with the lysis buffer MLP (90μL) in Nucleospin miRNA Plasma extraction kit (Takara, Japan). These processes were done within 1 hour after drawing blood samples.
2.2. The Extraction of miRNAs
MiRNAs were extracted using the Nucleospin miRNA Plasma extraction kit (Takara). Briefly, 300 μL of samples were mixed with the lysis buffer. After homogenization, one femtomole of cel-miR-39 was added as a spiked-in control. Protein precipitation buffer: MPP (30μL) was added to samples. The mixtures were then centrifuged at 11,000×g, for 1 min, and were mixed with 500 μL of isopropanol. This mixture was filtered with columns at 11,000×g for 1 min. The empty columns were filled with the washing buffer: MW2 (700μL), and were centrifuged at 11,000×g for 1 min. This washing step was repeated two times. DNase solution (Takara) was added to the columns. The columns were incubated for 15 min to degrade DNAs. After incubation, washing buffer: MW1 (100μL) washing buffer was added into the columns, and was spun down by centrifugation at 11,000×g for 1 min. This washing step was repeated two times. After washing, miRNAs attached to the columns were eluted to new tubes with 100 μL of distilled water.
2.3. The Quantitative Analysis of miRNAs and Normalization
miRNAs were transcribed to complementary DNAs (cDNAs) using High Capacity cDNA Archive Kit (Applied Biosystems). cDNAs were amplified using a TaqMan miRNA assay kit (Thermo Fisher Scientific) and StepOnePlus (Thermo Fisher Scientific) [17]. The cycle condition of qPCR was following: enzyme activation at 95°C for 10min, PCR reaction at 95°C for 15sec and 60°C for 60sec, and repeated 40 cycles. We measured the expression levels of miR-16-1, miR-451, miR-126, miR-223, and cel-miR-39 as a spiked-in external control. The expression levels of each miRNAs were evaluated using the comparative threshold cycle (Ct) method [17]. Namely, the levels of each miRNAs were compared after calculating ΔCt values: (Ct of target miRNA) - (Ct of cel-miR-39). To compare the levels of miRNA between plasma and serum, ΔCt values were calculated using the following formula: ΔCt = (Ct of miR-X in plasma) - (Ct of miR-X in serum). Ratios of miRNA levels in plasma and serum were calculated using relative expression levels estimated by 2-ΔCt.
To avoid bias in individual samples, all samples were processed at the same time.
2.4. Analysis of miRNA Modification by Coagulation Accelerators
We tested whether coagulation accelerator (CAs) contained in serum preparation tubes degraded circulating miRNAs. Two aliquots (1mL each) were prepared from the same plasma samples and were individually transferred to the plain tube and the tube containing CA (namely, the serum- preparing tube) for 30 min at room temperature. Then the levels of miRNAs in each aliquot were evaluated.
2.5. Statistical Analysis
The paired t-test was used to compare paired samples. Two-sided P values of <0.05 were considered to indicate statistical significance. Reference of statistics between plasma and serum was serum samples.
3. RESULTS
3.1. Differences in the miRNA Levels Between Plasma and Serum
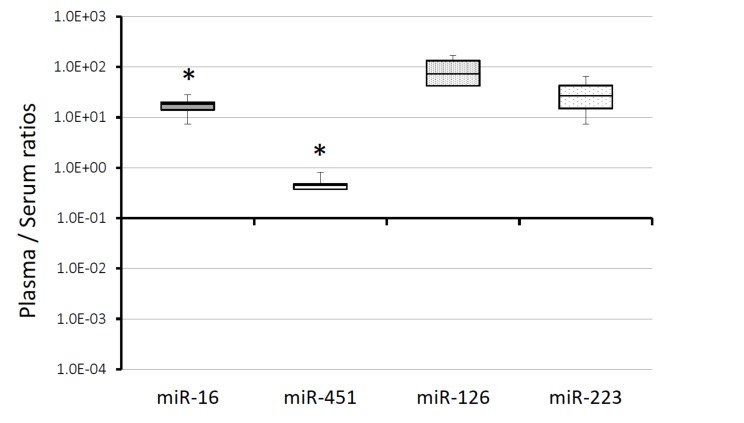
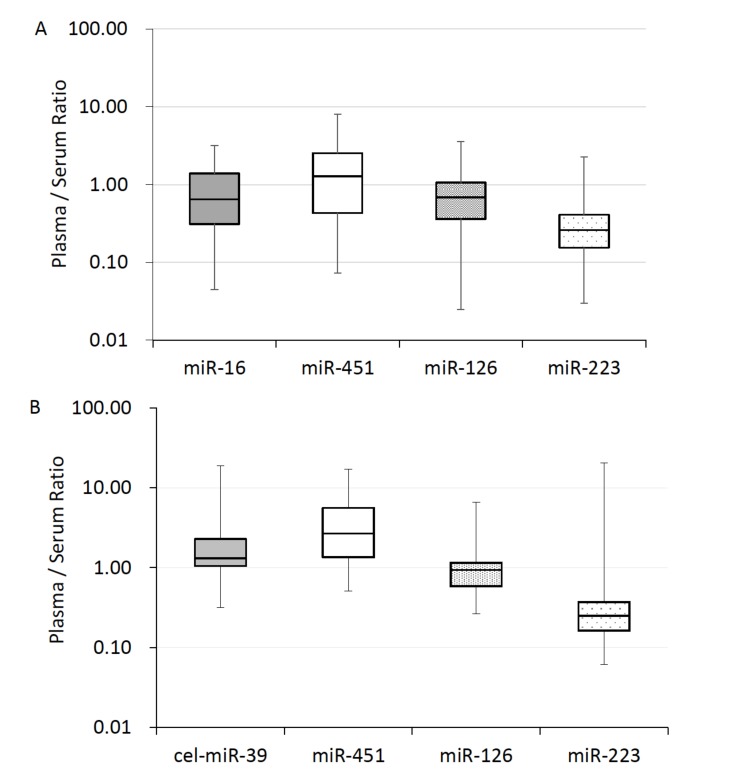
We analyzed the levels of circulating miR-126, miR-223, miR-16, miR-451, and compared the levels between plasma and serum from 4 healthy subjects (2 males, 2 females; age, 20-29 years). Plasma and serum were obtained by centrifugation of blood samples at 1,900×g for 10 min. The plasma levels of miR-16, miR-126, and miR-223 were 17.5-fold (7.3 - 28.1, p<0.05), 93.9-fold (41.4 - 167.1, p=0.058), and 32.2-fold (7.4 - 64.8, p=0.08) higher than those in serum, respectively (Fig. 1). On the other hand, the level of plasma miR-451 was lower than that in serum, 0.50 (0.27 - 0.84, p<0.05) (Fig. 1).
Fig. (1).
The expression of miRNA in serum and plasma. The expression of miRNA in plasma and serum was compared by a RT-qPCR. All values in this figure are shown as the relative value in comparison to serum, which were calculated using ΔCt values (2-ΔCt). The ΔCt values of each miRNAs were calculated following formula: ΔCt = (Ct of miR-X in plasma) - (Ct of miR-X in serum). Both of miR-X means same target. All of the samples in this figure were extracted from serum and plasma immediately after separation from whole blood. The upper and lower bars of the box show the maximum and minimum samples, respectively. The horizontal line in each box shows the median (50th percentile).
3.2. The Effects of the Removal of Platelets and Cellular Debris
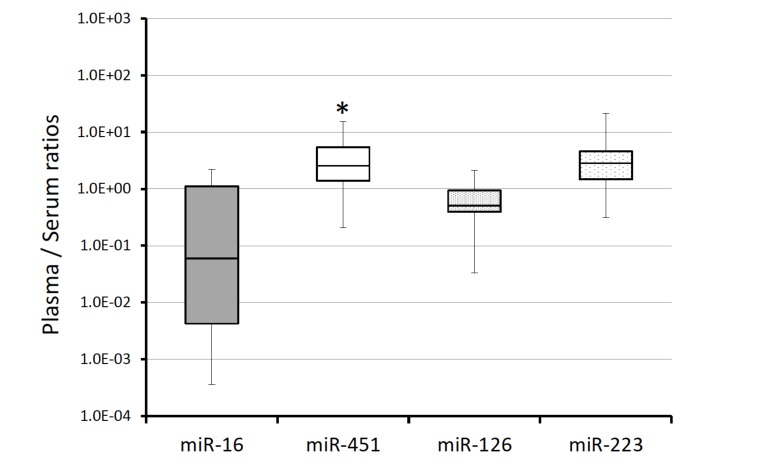
MiRNAs in the plasma and serum from 25 healthy subjects (mean age, 25 years; range, 21-36 years) were analyzed after centrifugation at 10,000×g for 1 min (Fig. 2), which is a procedure that removes particles such as platelets and cellular debris. The levels of plasma miRNAs became similar to that of serum miRNAs, since the ratios of plasma/serum miRNA except miR-451, were almost one, miR-16, 0.82-fold (0.0004 - 2.22, p=0.51), miR-451, 3.83-fold (0.21 - 15.5, p<0.05), miR-126, 0.76-fold (0.03 - 2.11, p=0.13), and miR-223, 3.28-fold (0.18 - 21.2, p=0.10), respectively. Only the level of miR-451 in plasma was significantly higher than that in serum, which was the opposite result to observations using plasma before the high-speed centrifugation (Fig. 1).
Fig. (2).
The expression of miRNA in plasma following high-speed centrifugation. All of plasma and serum in Fig.2 were centrifuged at 10,000×g, at 1 min after removal from whole blood. All of the values were compensated by the serum Ct value. The ΔCt value was determined as follows: ΔCt = (Plasma Ct) - (Serum Ct).
3.3. The Influence of Coagulation Accelerators on the miRNA Levels
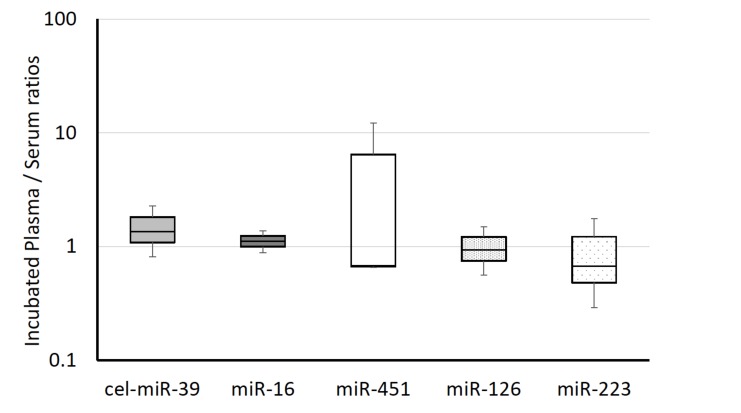
The levels of miRNAs in serum preparation tubes did not significantly change from the levels in plasma miRNAs: miR-16, 1.12-fold; miR-451, 4.51-fold, miR-126, 0.99-fold; miR-223, 0.90-fold (Fig. 3). The level of spiked-in control, cel-miR-39 was 1.12-fold higher in plasma with CAs. There were no significant differences in the levels of miRNAs in plasma before and after incubation with CAs.
Fig. (3).
The influence of coagulation accelerators. The miRNA values of serum, plasma and plasma that was transferred and incubated in plain tubes were measured. The serum Ct value was adopted as a normalizer. All of the values in this graph are relative values, and indicate the value of plasma incubated in plain tube divided by NOT transferred plasma. ΔCt = (Ct value of Plasma or Incubated Plasma) - (Ct value of Serum). Ratio of Incubated Plasma / Serum = (Value of incubated Plasma in PLAIN tube) / (Value of incubated plasma NOT transferred).
3.4. Normalization with Spiked-in Cel-miR-39
Plasma and serum have been differently processed to prepare miRNA samples. To normalize the effects of these different processing methods on the analysis of miRNAs, we used cel-miR-39 as a spiked-in control in each sample.
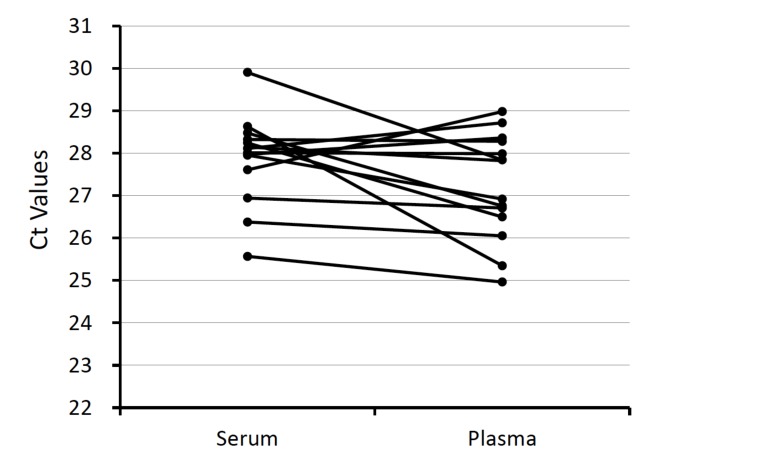
We tested the stability of spiked-in cel-miR-39. The levels of cel-miR-39 were analyzed in paired plasma and serum obtained from the same subjects (n=25). The mean Ct values of cel-miR-39 in serum and plasma were 28.4 and 26.9, respectively, and did not differ to a significant extent (Fig. 4). These data show that different stability of spiked-in control, cel-miR-39, was not the cause of the difference in the levels of miRNA in plasma and serum samples. The normalized levels of four miRNAs and cel-miR-39 did not differ to a significant extent between plasma and serum samples (Fig. 5A). The relative plasma levels were as follows: miR-16, 1.07 (0.04 - 3.03); miR-451, 1.38 (0.07- 8.09); miR-126, 0.83 (0.02 - 3.57); and miR-223, 0.43 (0.03 - 2.28). We also calculated CVs of CT value in cel-miR-39 across all examination, CVs were 8% in serum and also 11% in plasma.
Fig. (4).
The Ct values of cel-miR-39. The Ct values of all samples are shown in this figure. Serum and plasma samples obtained from the same individual are joined by a line.
Fig. (5).
The influence of selecting a normalizer based on the miRNA expression. A) The expression of miRNA compensated by cel-miR-39. The Ct value of 1 fmol cel-miR-39 was adopted as a normalizer. ΔCt = (Ct value of miR-X) - (Ct value of cel-miR-39). B) The expression of miRNA compensated by miR-16. The normalizer was changed to miR-16 in each sample. ΔCt = (Ct value of miR-X) - (Ct value of miR-16). Bars with asterisks show statistically significant difference, p<0.05.
3.5. Normalization with Endogenous miR-16
We also examined the usefulness of miR-16 as an internal control for plasma and serum miRNA measurement. The levels of miRNAs normalized with endogenous miR-16 are shown in Fig. (5B), in which data are shown as the relative plasma levels to each serum levels. The miR-451 expression level was 4.31 (0.51 - 17.08). The levels of miR-126 and 223 were 1.21 (0.27 - 6.57) and 1.78 (0.06- 20.35). Finally, we evaluated the change of one fmol cel-miR-39 which was added as spiked-in control using the endogenous miR-16 level. The level of cel-miR-39 was 3.06 (0.32 - 18.85). There were no significant differences between plasma and serum levels.
3.6. The Inhibition of Plasma miR-451 Analysis with the Particle Fraction
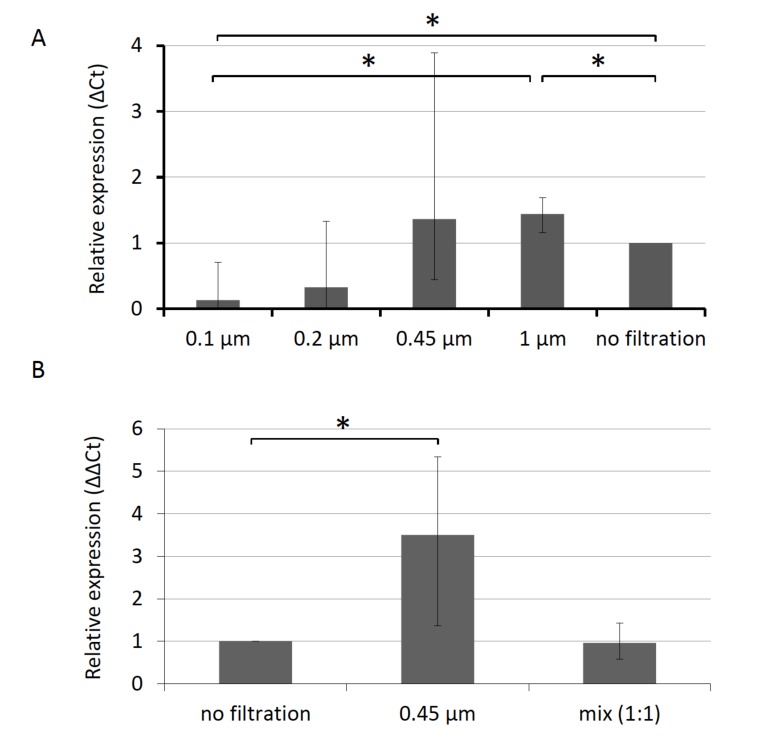
The level of miR-451 was higher in serum than in plasma (Fig. 1), which was the opposite phenomenon if we used the high-speed centrifugation (Fig. 2). This phenomenon was not observed in the analysis of other miRNAs. To evaluate the effect of removal of particles, we fractionated plasma using membrane filters with different pore sizes (Fig. 6A). Plasma filtered with membranes with pore sizes of 1 μm and 0.45 μm showed higher miR-451 levels than in non-filtered plasma, 1.44-fold (p=0.04) and 1.36-fold (not significant), respectively. On the other hand, filtration with smaller pore sizes reduced the miR-451 levels: 0.22 μm, 0.33-fold (not significant); 0.1 μm, 0.13-fold (p=0.03). The mixed plasma containing equal volumes of filtered and non-filtered plasma showed almost the same levels of miR-451 as the non-filtrated plasma samples (Fig. 6B). These results suggest the presence of inhibitory substances in particle fraction containing cellular debris or large particles.
Fig. (6).
The inhibitory activity of particle fractions of plasma and its effect on the analysis of miR-451. A) The levels of miR-451 in filtrated fractions of plasma. B) Mixing experiments showed the effects of the inhibitory activity of filtrated fractions of plasma on the analysis of miR-451.
3.7. RNase Inhibitor was Partially Effective in Preventing the Degradation of miRNAs
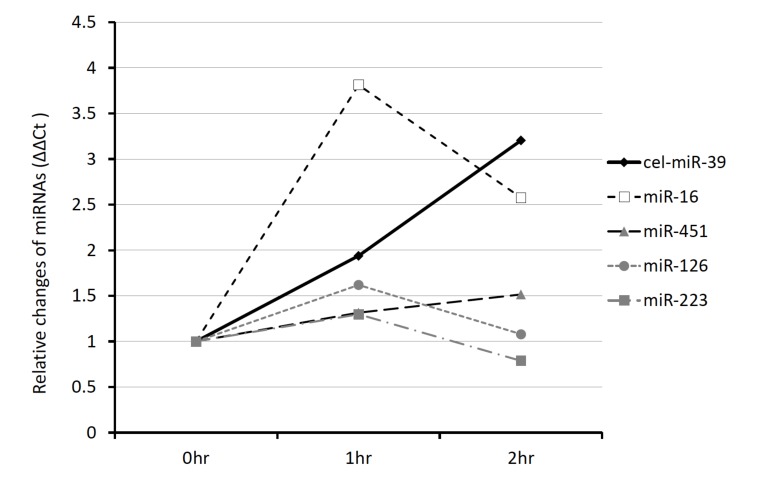
The level of cel-miR-39 in serum decreased rapidly, with an almost 0.41-fold change in comparison to the initial level after 2 hours of incubation (Data not shown). Spiked-in normalizer, cel-miR-39 is a synthetic miRNA that is easy to be digested with RNase, because it is not protected with extracellular vesicles, proteins or lipids. We used RNase inhibitor (RI) to make an analysis of miRNA more stable. We observed the effect of RI on the miRNA levels in plasma and serum (Fig. 7). The presence of RI did not change the plasma/serum ratios of miR-126, miR-223, or miR-451. In the case of miR-16, however, the ratio changed significantly from 3.8-fold to 2.6-fold.
Fig. (7).
The influence of RNase on plasma and serum.We evaluated the influence of RNase on miRNA degradation in serum and plasma samples. Each sample was compensated by the serum Ct value. ΔCt = (Plasma Ct) - (Serum Ct). All of the values in this graph are relative values of the sample with the RNase Inhibitor (RI+/-) sample (RI+) relative to the no-RI sample (RI-). The samples were incubated at room temperature for 0, 1, 2 hours.
4. Discussion
Circulating miRNAs are new biomarkers for various diseases, and are useful tools for the development of novel therapies. However, there are inconsistent findings from different studies. Several studies reported the different levels of circulating miRNAs between plasma and serum [21, 36, 37, 40]. The miRNA levels are quite sensitive to the sample processing conditions, such as the time after blood drawing, preservation conditions, centrifugation conditions, circadian changes, differences between serum and plasma, and the assay methods [21, 23, 36, 37, 40]. To develop well-standardized methods for the analysis of miRNA, we focused on the pre-analytical steps of the circulating miRNA analysis, including membrane filtration of samples.
In the present study, we selected relatively abundant circulating miRNAs, of which origin are mainly blood cells [16, 17]. We showed that plasma contained higher levels of miR-16, miR-126 and miR-223 than serum (Fig. 1). The high-speed centrifugation reduced the levels of miR-16, miR-126 and miR-223 in plasma to levels in serum (Fig. 2). Our data are consistent to the previous results reported by McDonald et al., that miR-16 in plasma was higher than in serum, and that the level decreased after the high-speed centrifugation at 15,000 ×g [21]. These data suggested that the presence of relatively large-sized particles, such as platelets and cellular debris derived from blood cells, affects the levels of circulating miRNAs, and that this phenomenon depends on species of miRNA since the level of miR-451 was higher in serum than in plasma (Fig. 1). A large proportion of the circulating miRNAs is present inside EVs such as MPs and exosomes [12, 13]; another populations of miRNAs circulate as a complex with the Argonoute2 (Ago2) protein [14] or bind with lipids [12, 14]. EVs of different cellular origins can be separated using antibodies that recognize the molecular markers on the surface [12, 13, 41, 42]. Platelets and apoptotic bodies can be removed by centrifugation at 3000×g [21, 43, 44]. Thus, the high-speed centrifugation used in this study may be an essential step in the analysis of circulating miRNA profiles with minimum modification by blood cell contamination. However, the rapid and reproducible process is desirable for clinical utilization. We showed that membrane filtration procedure was also effective to remove the particle contamination (Fig. 6). Therefore, we propose membrane filtration is one of the effective methods for standardization of miRNA analysis.
Next, we focused on coagulation accelerators (CAs), which is present in serum-preparing tubes. Silica and thrombin are frequently used CAs that are used to obtain serum rapidly in laboratory tubes. As Fig. (3) shows, the levels of miRNAs in plasma samples in the serum-preparing tubes did not differ from the levels in plasma samples without contact to CAs. Although some anti-coagulant materials such as heparin in blood collection tubes inhibit the reverse transcription or extension of nucleotides during the polymerase reaction, CAs in plain tubes did not affect the results.
Normalization of miRNA data is very important to use circulating miRNAs as disease biomarkers. Previous reports have shown that differences between different internal controls caused different miRNA values [10, 21, 43]. If we select one of the circulating miRNAs as the internal control, every miRNA levels are shown as the relative amounts in plasma or serum. Namely, absolute amounts of miRNAs are not known if the internal control is used. If we use a known amount of spiked-in synthetic cel-miR-39, we can evaluate the absolute amount of circulating miRNA. Our data showed the almost equal levels of spiked-in cel-miR-39 in most of paired plasma and serum samples. Thus, cel-miR-39 is the stable spiked-in control that is useful for analyzing circulating miRNAs. When miR-16 was selected as a normalizer, the levels of four miRNAs did not change to a significant extent (Fig. 5B). MiR-16 is a relatively abundant miRNA in plasma and serum [10, 35, 36]. Thus, miR-16 may mask variations in miRNAs that are present in small amounts. In this study, the amount of miR-16 was greater in comparison to the other 4 miRNAs. The normalization of the levels with miR-16 might have been less sensitive to detect variations of less abundant miRNAs. The previous report showed that miR-451, miR-15b and 16 increased with hemolysis [19, 20, 21] suggesting that circulating miR-16 is not suitable internal control in hemolytic condition. We propose that target miRNA-oriented adjustment of the concentration of spiked-in cel-miR-39 is relevant to achieve stable results.
In contrast to miR-16, miR-126, and miR-223, the level of miR-451 in plasma was lower than in serum (Fig. 1). The removal of large-sized particles from samples by high-speed centrifugation or membrane filtration resulted in increased plasma levels of miR-451. This phenomenon is not explained by the presence of microparticles released from red blood cells which are the main origin of miR-451 [11, 17, 21]. We hypothesized the presence of some inhibiting activity in the particle fraction, for the measurement of the plasma miR-451 level. The level of plasma miR-451 increased after the removal of particles of >0.45 µm in size, and that the level decreased after filtration with a membrane with a pore size of 0.22 µm (Fig. 6A), probably because of removal of the microparticle and part of exosomes. The mixing of plasma between unfractionated and 0.45 µm-membrane-filtrated fraction, resulted in a decrease to the same level as that in unfractionated plasma. Our data suggested that the inhibitory activity such as hemoglobin [45], immunoglobulin [46], and lactoferrin [47] modified the analysis of some groups of circulating miRNAs. It was reported that miR-451 circulates as a non-EV miRNA [39], which are relatively susceptible to degradation with RNase. Thus, membrane filtration may be essential for the analysis of non-EV-type miRNAs.
RNase in serum and plasma may cause degradation of circulating miRNAs [48-51]. In this study, we examined the usefulness of RNase inhibitor (RI) in the pre-analytical steps of miRNA analysis. RNase inhibitor (RI) was added to the whole blood samples immediately after blood drawing. Samples with RI showed higher miRNA levels than samples without RI (Fig. 7). The circulating miRNAs in EVs are protected from RNase activity, while non-EV miRNAs are more sensitive to degradation by RNase [48-50].
CONCLUSION
The difference of miRNA levels in serum and plasma occurs as a combined effect of multiple steps. The removal of cellular debris and large particle components is essential for the analysis of circulating miRNAs. The high-speed centrifugation or membrane filtration of plasma is recommended for removing the effects of cellular components and inhibitory substances. A target-oriented amount of spiked-in control miRNA may be a useful normalizer. Furthermore, the immediate addition of RI to blood sample is recommended to maintain the stability of the miRNA.
Author Contributions
Conceived and designed the experiments: Hiromichi Shiotsu Tsukuru Umemura. Performed the experiments: Hiromichi Shiotsu Yuki Kobayashi Kazuhiro Okada Saki Shirahama Chieri Kuroki Saori Ueda Tsukuru Umemura. Analyzed the data: Hiromichi Shiotsu Yuki Kobayashi Tsukuru Umemura. Contributed regents/materials/analysis tools: Hiromichi Shiotsu Katsuyoshi Ikeda Tsukuru Umemura. Wrote paper: HS TU. Presided the study: Hiromichi Shiotsu Yukio Ando Hirotaka Matsui Katsuyoshi Ikeda Tsukuru Umemura.
AcknowledgEments
This work was supported in part by a grant from the Japan Society for the Promotion of Science (JSPS KAKENHI Grant Number: JP17K09020), and the Fund from International University of Health and Welfare.
LIST OF ABBREVIATIONS
- miRNA
microRNA
- RISC
RNA Induced Silencing Complex
- mRNA
Messenger RNA
- Ago2
Argonaute2
- EVs
Extracellular Vesicles
- MPs
Microparticles
- CAs
Coagulation Accelerators
Ethics Approval and Consent to Participate
The study was approved by the Human Genome Ethics Committee of Kumamoto University, Ethics Committee of Kyushu University (Accession Numbers: 274 and 553-00, respectively), and Ethics Committee of International University of Health and Welfare.
Human and Animal Rights
No animal were used in this study. The reported experiments on human were in accordance with the ethical standards of the committee responsible for human experimentation (institutional and national), and with the Helsinki Declaration of 1975, as revised in 2008.
Consent for Publication
All samples were collected from volunteers who gave their fully-informed, written consent.
conflict of interest
The authors declare no conflict of interest, financial or otherwise.
REFERENCES
- 1.Bartel D.P. MicroRNAs: Genomics, biogenesis, mechanism, and function. Cell. 2004;116:281–297. doi: 10.1016/s0092-8674(04)00045-5. [DOI] [PubMed] [Google Scholar]
- 2.Zorc M., Obsteter J., Dovc P., Kunej T. Genetic variability of microrna genes in 15 animal species. J Genomics. 2015;3:51–56. doi: 10.7150/jgen.11246. [DOI] [PMC free article] [PubMed] [Google Scholar]
- 3.Narry Kim V., Jin-Wu N. Genomics of microRNA. Trends Genet. 2006;22(3):165–173. doi: 10.1016/j.tig.2006.01.003. [DOI] [PubMed] [Google Scholar]
- 4.Friedman R.C., Farh K.K., Burge C.B., Bartel D.P. Most mammalian mRNAs are conserved targets of microRNAs. Genome Res. 2009;19(1):92–105. doi: 10.1101/gr.082701.108. [DOI] [PMC free article] [PubMed] [Google Scholar]
- 5.Machado M.T., Navega S., Dias F., de Sousa M.J., Teixeira A.L., Medeiros R. microRNAs for peripheral blood fraction identification: Origin, pathways and forensic relevance. Life Sci. 2015;143:98–104. doi: 10.1016/j.lfs.2015.10.029. [DOI] [PubMed] [Google Scholar]
- 6.Ortiz-Quintero B. Cell-free microRNAs in blood and other body fluids, as cancer biomarkers. Cell Prolif. 2016;49(3):281–303. doi: 10.1111/cpr.12262. [DOI] [PMC free article] [PubMed] [Google Scholar]
- 7.Esquela-Kerscher A., Slack F.J. Oncomirs microRNAs with a role in cancer. Nat. Rev. Cancer. 2006;6(4):259–269. doi: 10.1038/nrc1840. [DOI] [PubMed] [Google Scholar]
- 8.Thalia A.F., Jessica I.S., Pavel M., Thomas T. miRNAs in human cancer. J. Pathol. 2011;223:102–115. doi: 10.1002/path.2806. [DOI] [PMC free article] [PubMed] [Google Scholar]
- 9.Shibuta T., Honda E., Shiotsu H., et al. Imatinib induces demethylation of miR-203 gene: an epigenetic mechanism of anti-tumor effect of imatinib. Leuk. Res. 2013;3(10):1278–1286. doi: 10.1016/j.leukres.2013.07.019. [DOI] [PubMed] [Google Scholar]
- 10.Glen R., Michaela B.K., Nicovan Z. Circulating microRNAs: association with disease and potential use as biomarkers. Crit. Rev. Oncol. Hematol. 2010;80(2):193–208. doi: 10.1016/j.critrevonc.2010.11.004. [DOI] [PubMed] [Google Scholar]
- 11.Lawrie C.H. microRNA expression in erythropoiesis and erythroid disoreders. Br. J. Haematol. 2010;150:144–151. doi: 10.1111/j.1365-2141.2009.07978.x. [DOI] [PubMed] [Google Scholar]
- 12.Ryou-u T., Marta P.V., Ai H., Takahiro O. The role of extracellular vesicle microRNAs in cancer biology. Clin. Chem. Lab. Med. 2017;55:648–656. doi: 10.1515/cclm-2016-0708. [DOI] [PubMed] [Google Scholar]
- 13.Isabel H.D., Chen-Yu Z., Antonio V.P. Extracellular vesicles: novel mediators of cell communication in metabolic disease. Trends Endocrinol. Metab. 2017;28(1):3–18. doi: 10.1016/j.tem.2016.10.003. [DOI] [PubMed] [Google Scholar]
- 14.Arroyoa J.D., Chevilleta J.R., Kroha E.M., et al. Argonaute2 complexes carry a population of circulating microRNAs independent of vesicles in human plasma. Proc. Natl. Acad. Sci. USA. 2011;108(12):5003–5008. doi: 10.1073/pnas.1019055108. [DOI] [PMC free article] [PubMed] [Google Scholar]
- 15.Pan B.T., Johnstone R.M. Fate of the transferrin receptor during maturation of sheep reticulocytes in vitro: Selective externalization of the receptor. Cell. 1983;33(3):967–978. doi: 10.1016/0092-8674(83)90040-5. [DOI] [PubMed] [Google Scholar]
- 16.Pritchard C.C., Kroh E., et al. Blood cell origin of circulating micrornas: A cautionary note for cancer biomarker studies. Cancer Prev. Res. (Phila.) 2011;5:492–497. doi: 10.1158/1940-6207.CAPR-11-0370. [DOI] [PMC free article] [PubMed] [Google Scholar]
- 17.Masaki S., Ohtsuka R., Abe Y., Muta K., Umemura T. Expression patterns of microRNAs 155 and 451 during normal human erythropoiesis. Biochem. Biophys. Res. Commun. 2007;364:509–514. doi: 10.1016/j.bbrc.2007.10.077. [DOI] [PubMed] [Google Scholar]
- 18.Zhan M., Miller T., Papayannopoulou Th., et al. MicroRNA expression dynamics during murine and human erythroid differentiation. Exp. Hematol. 2007;35:1015–1025. doi: 10.1016/j.exphem.2007.03.014. [DOI] [PMC free article] [PubMed] [Google Scholar]
- 19.Michaela B.K., James B.E., Steven C.H.K., Michael P.V. Nico van Z, Glen R. The impact of hemolysis on cell-free microRNA biomarkers. Front. Genet. 2013;4:94. doi: 10.3389/fgene.2013.00094. [DOI] [PMC free article] [PubMed] [Google Scholar]
- 20.Kamonlak L., Yuka T., Yasuko H., et al. Plasma microRNA-451 as a novel hemolytic marker for β0-thalassemia/HbE disease. Mol. Med. Rep. 2017;15:2495–2502. doi: 10.3892/mmr.2017.6326. [DOI] [PMC free article] [PubMed] [Google Scholar]
- 21.McDonald J.S., Milosevic D., Reddi H.V., Grebe S.K., Algeciras-Schimnich A. Analysis of circulating microRNA: preanalytical and analytical challenges. Clin. Chem. 2011;57(6):833–840. doi: 10.1373/clinchem.2010.157198. [DOI] [PubMed] [Google Scholar]
- 22.Provost P. The clinical significance of platelet microparticle associated microRNAs. Clin. Chem. Lab. Med. 2017;55(5):657–666. doi: 10.1515/cclm-2016-0895. [DOI] [PubMed] [Google Scholar]
- 23.Glinge C., Clauss S., Boddum K., et al. Stability of circulating blood-based microRNAs - pre-analytic methodological considerations. PLoS One. 2017;12(2):e0167969. doi: 10.1371/journal.pone.0167969. [DOI] [PMC free article] [PubMed] [Google Scholar]
- 24.Sun W., Shen W., Yang S., Hu F., Li H., Zhu T.H. miR-223 and miR-142 attenuate hematopoietic cell proliferation, and miR-223 positively regulates miR-142 through LMO2 isoforms and CEBP-β. Cell Res. 2010;20(10):1158–1169. doi: 10.1038/cr.2010.134. [DOI] [PubMed] [Google Scholar]
- 25.Izzotti A., Carozzo S., Pulliero A., Zhabayeva D., Ravetti J.L., Bersimbaev R. Extracellular microRNA in liquid biopsy: Applicability in cancer diagnosis and prevention. Am. J. Cancer Res. 2016;6(7):1461–1493. [PMC free article] [PubMed] [Google Scholar]
- 26.He Y., Lin J., Kong D., et al. Current state of circulating microRNAs as cancer biomarkers. Clin. Chem. 2015;61(9):1138–1155. doi: 10.1373/clinchem.2015.241190. [DOI] [PubMed] [Google Scholar]
- 27.Ng E.K., Chong W.W., Jin H., et al. Differential expression of microRNAs in plasma of patients with colorectal cancer: A potential marker for colorectal cancer screening. Gut. 2009;58:1375–1381. doi: 10.1136/gut.2008.167817. [DOI] [PubMed] [Google Scholar]
- 28.Joe T., Masahisa O., Martin P., Hui L. microRNAs: Clinical relevance in colorectal cancer. Int. J. Mol. Sci. 2015;16(12):28063–28076. doi: 10.3390/ijms161226080. [DOI] [PMC free article] [PubMed] [Google Scholar]
- 29.Suzuki T., Lyon A., Saggar R., et al. Editor’s choice-biomarkers of acute cardiovascular and pulmonary diseases. Eur. Heart J. Acute Cardiovasc. Care. 2016;5(5):416–433. doi: 10.1177/2048872616652309. [DOI] [PubMed] [Google Scholar]
- 30.Oury C., Servais L., Bouznad N., Hego A., Nchimi A., Lancellotti P. MicroRNAs in valvular heart diseases: potential role as markers and actors of valvular and cardiac remodeling. Int. J. Mol. Sci. 2016;17(7):1120. doi: 10.3390/ijms17071120. [DOI] [PMC free article] [PubMed] [Google Scholar]
- 31.Zampetaki A., Mayr M. microRNAs in vascular and metabolic disease. Circ. Res. 2012;110(3):508–522. doi: 10.1161/CIRCRESAHA.111.247445. [DOI] [PubMed] [Google Scholar]
- 32.Parmila V., Rajan K.P., Priyanka P., Vijay K.P. Circulating microRNAs: Potential and emerging biomarkers for diagnosis of human infectious diseases. Front. Microbiol. 2016;7:1274. doi: 10.3389/fmicb.2016.01274. [DOI] [PMC free article] [PubMed] [Google Scholar]
- 33.Supat C., Chieri K., Varunee D., et al. Downregulation of plasma miR-451 and miR-16 in Plasmodium vivax infection. Exp. Parasitol. 2015;155:19–25. doi: 10.1016/j.exppara.2015.04.013. [DOI] [PubMed] [Google Scholar]
- 34.Kumar S., Reddy P.H. Are circulating microRNAs peripheral biomarkers for alzheimer’s disease? Biochim. Biophys. Acta. 2016;1862(9):1617–1627. doi: 10.1016/j.bbadis.2016.06.001. [DOI] [PMC free article] [PubMed] [Google Scholar]
- 35.Chopp M., Zhang Z.G. Emerging potential of exosomes and noncoding microRNAs for the treatment of neurological injury/diseases. Expert Opin. Emerg. Drugs. 2015;20(4):523–526. doi: 10.1517/14728214.2015.1061993. [DOI] [PMC free article] [PubMed] [Google Scholar]
- 36.Mitchell P.S., Parkin R.K., Kroh E.M., et al. Circulating microRNAs as stable blood-based markers for cancer detection. Proc. Natl. Acad. Sci. USA. 2008;105(30):10513–10518. doi: 10.1073/pnas.0804549105. [DOI] [PMC free article] [PubMed] [Google Scholar]
- 37.Blondal T., Jensby N.S., Baker A., et al. Assessing sample and miRNA profile quality in serum and plasma or other biofluids. Methods. 2013;59(1):S1–S6. doi: 10.1016/j.ymeth.2012.09.015. [DOI] [PubMed] [Google Scholar]
- 38.Ferracin M., Lupini L., Salamon I., et al. Absolute quantification of cell-free microRNAs in cancer patients. Oncotarget. 2015;6(16):14545–14555. doi: 10.18632/oncotarget.3859. [DOI] [PMC free article] [PubMed] [Google Scholar]
- 39.Ono S., Lam S., Nagahara M., Hoon D.S. Circulating microRNA biomarkers as liquid biopsy for cancer patients: Pros and cons of current assays. J. Clin. Med. 2015;4(10):1890–1907. doi: 10.3390/jcm4101890. [DOI] [PMC free article] [PubMed] [Google Scholar]
- 40.Cheng H.H., Yi H.S., Kim Y., et al. Plasma processing conditions substantially influence circulating microRNA biomarker levels. PLoS One. 2013;8(6):e64795. doi: 10.1371/journal.pone.0064795. [DOI] [PMC free article] [PubMed] [Google Scholar]
- 41.Wang K., Yuan Y., Cho J.H., McClarty S., Baxter D., Galas D.J. Comparing the MicroRNA spectrum between serum and plasma. PLoS One. 2012;7(7):e41561. doi: 10.1371/journal.pone.0041561. [DOI] [PMC free article] [PubMed] [Google Scholar]
- 42.Zen K., Zhang C.Y. Circulating microRNAs: A novel class of biomarkers to diagnose and monitor human cancers. Med. Res. Rev. 2012;32(2):326–348. doi: 10.1002/med.20215. [DOI] [PubMed] [Google Scholar]
- 43.Shayne A.B., Belinda B.G., Bradley M., Coleman F., Andrew F.H. Exosomes: vehicles for the transfer of toxic proteins associated with neurodegenerative diseases? Front. Physiol. 2012;3:124. doi: 10.3389/fphys.2012.00124. [DOI] [PMC free article] [PubMed] [Google Scholar]
- 44.MacLellan S.A., MacAulay C., Lam S., Garnis C. Pre-profiling factors influencing serum microRNA levels. BMC Clin. Pathol. 2014;14:27. doi: 10.1186/1472-6890-14-27. [DOI] [PMC free article] [PubMed] [Google Scholar]
- 45.Kenneth W.W., Edit I.B., Lynne T.B., et al. Standardization of sample collection, isolation and analysis methods in extracellular vesicle research. J. Extracell. Vesicles. 2013;2:20360. doi: 10.3402/jev.v2i0.20360. [DOI] [PMC free article] [PubMed] [Google Scholar]
- 46.Akane A., Matsubara K., Nakamura H., Takahashi S., Kimura K. Identification of the heme compound co-purified with Deoxyribonucleic Acid (DNA) from bloodstains, a major inhibitor of Polymerase Chain Reaction (PCR) amplification. J. Forensic Sci. 1994;39:362–372. [PubMed] [Google Scholar]
- 47.Al-Soud W.A., Jonsson L.J., Radstrom P. Identification and characterization of immunoglobuling in blood as a major inhibitor of diagnostic PCR. J. Clin. Microbiol. 2000;38:345–350. doi: 10.1128/jcm.38.1.345-350.2000. [DOI] [PMC free article] [PubMed] [Google Scholar]
- 48.Al-Soud W.A., Radstrom P. Purification and characterization of PCR-inhibitory components in blood cells. J. Clin. Microbiol. 2001;39:485–493. doi: 10.1128/JCM.39.2.485-493.2001. [DOI] [PMC free article] [PubMed] [Google Scholar]
- 49.Köberle V., Pleli T., Schmithals C., et al. Differential stability of cell-free circulating microRNAs: implications for their utilization as biomarkers. PLoS One. 2013;8(9):e75184. doi: 10.1371/journal.pone.0075184. [DOI] [PMC free article] [PubMed] [Google Scholar]
- 50.Marzi M.J., Montani F., Carletti R.M., et al. Optimization and standardization of circulating microRNA detection for clinical application: the miR-test case. Clin. Chem. 2016;62(5):743–754. doi: 10.1373/clinchem.2015.251942. [DOI] [PubMed] [Google Scholar]
- 51.Koga Y., Yasunaga M., Moriya Y., et al. Exosome can prevent RNase from degrading microRNA in feces. J. Gastrointest. Oncol. 2011;2(4):215–222. doi: 10.3978/j.issn.2078-6891.2011.015. [DOI] [PMC free article] [PubMed] [Google Scholar]


