Abstract
Background:
Saliva is a fluid with the complex compound which can be used as diagnostic markers for type 2 diabetes (T2D). This meta-analysis evaluated salivary glucose, immunoglobulin A (IgA), total protein, and amylase levels in adult T2D compared with the controls as well as the correlation of salivary glucose levels with serum glucose and hemoglobin A1C (HbA1c) levels in both groups.
Materials and Methods:
Web of Science, Scopus, PubMed, and Cochrane Library databases were searched up to July 2017. A random-effects analysis was performed using the mean difference (MD) and 95% confidence intervals. The search terms were “T2D, IgA, amylase, total protein, or glucose” combination with “saliva.” The studied variables were the sample size, the percentage of male, the mean age, the condition of saliva sampling, and the salivary levels of mentioned factors.
Results:
A total of 25 studies were included in this meta-analysis with 1432 and 900 diabetic patients and healthy controls, respectively. MD of salivary glucose level in patients with T2D, compared with the healthy controls, in fasting and nonfasting conditions were 6.23 mg/dL (P = 0.0002) and 6.70 mg/dL (P < 0.00001), respectively. Furthermore, the fasting salivary total protein in the patients was significantly higher than the controls (MD = 167.96 mg/dL; P = 0.03). Non-fasting salivary amylase and secretory IgA levels were significantly lower in the patients (MD = −48.61 IU/mL; P < 0.00001) than in the controls (MD = −9.42 IU/mL; P = 0.0006), respectively. The pooled estimate showed a significant correlation between salivary and serum glucose in the patients (r = 0.765; P < 0.001) and the controls (r = 0.646; P < 0.001) and between salivary glucose and serum glycated hemoglobin in the patients (r = 0.721; P < 0.001).
Conclusion:
Measurement of these salivary factors can be helpful for diagnostic and monitoring purposes of T2D. In addition, salivary glucose as a diagnostic tool can evaluate serum glucose and HbA1c levels in the diabetic patients.
Keywords: Diabetes mellitus, saliva, serum, type 2
INTRODUCTION
Diabetes mellitus is a chronic condition with severe long-term, disabling complications, and unknown remedy that is characterized by disorders in carbohydrate, fat, and protein metabolism.[1] Prevalence of diabetes in the adult population is currently considered to be 6.4% in the world.[2] Type 2 diabetes (T2D) is caused primarily by insulin resistance in the liver, muscle, and adipose tissue as peripheral target organs.[3] This disease strongly impacts the production and composition of saliva because it is connected with autonomic neuropathies, microvascular alternations, and hormonal imbalances, or a combination of all these.[4] Saliva is a fluid with complex compound and specific roles[5] as well as the principal defensive factor in the mouth which contains informative components that can be used as diagnostic markers for human diseases.[6] There are specific antibody systems in saliva.[5] Among all salivary parameters, glucose, amylase, and total proteins have been found to be closely related to the oral environment in patients with T2D.[7] Furthermore, secretory immunoglobulin A (s. IgA), as another salivary factor, can serve as the first line of defense against pathogens that colonize and invade mucosal surfaces.[8] The noninvasive glucose detection techniques suggest several advantages, including fewer problems of patient compliance and cost-effectiveness for screening a large population. Saliva has been investigated probably to reflect and monitor blood glucose level in diabetic patients.[9] This study aimed to evaluate salivary glucose, IgA, total protein, and amylase levels in adult patients with T2D compared with healthy controls and to determine the correlation of salivary glucose with blood glucose and glycated hemoglobin A1C (HbA1c) in both diabetic patients and healthy controls.
MATERIALS AND METHODS
We designed this meta-analysis based on the guidelines of the preferred reporting items of systematic reviews and meta-analyses.[10]
Search strategies
Four databases, including Web of Science, Scopus, PubMed, and Cochrane Library were examined for evaluation of salivary profile in adult T2D using the search words “type 2 diabetes, diabetes mellitus type 2, type II diabetes, diabetes type II, diabetes type 2, or diabetes mellitus type II,” “immunoglobulin A, IgA, amylase, total protein or glucose,” and “saliva or salivary.” The search was limited to publications in the English language up to July 2017. We rechecked the studies in Google Scholar with the mentioned search words for probability any missed study.
Study selection
The databases were examined for evaluation of salivary profile of the diabetic patients compared with the healthy controls. Studies were involved if they were case–control with two groups (T2D patients and healthy controls), they evaluated salivary profile, including the mean/median salivary glucose, amylase, total protein, or s. IgA levels, the healthy controls did not have any systematic or periodontal diseases, the patients had just T2D, and described the salivary profile in adults (>15 years). Studies were omitted if they were the review, letter to the editor or case report, had not reported the mean or median of the salivary profile, described the salivary profile in children (<15 years), and had no relevant data.
Data extraction from studies
One author (M. S) searched the studies and screened the titles and abstracts of every study based on the criteria and extracted data. Two authors (R. N and H. R. M) individually re-checked the full-text of the screened studies. Data obtained for every study included the first author, year of publication, country, the sample size of patients and controls, the percentage of male patients and controls, the mean age of patients and controls, condition of saliva sampling, salivary glucose, total protein, amylase, and s. IgA levels in the patients and controls, and correlation of salivary glucose with serum (blood) glucose and HbA1c. These data were re-checked by two other authors (M. R and M. S).
Quality evaluation
The quality of studies was estimated by the Newcastle-Ottawa Scale,[11] in which the maximum total score for a study was nine, and the following categories for meta-evidence evaluation were established: high quality (7–9), medium quality (4–6), and low quality (0–3)[4] The quality of every study was approved by two authors (M. R and M. S) by reaching an agreement through discussion.
Statistical analyses
A random-effects meta-analysis (due to high levels of heterogeneity among included studies) was executed by Review Manager 5.3 (RevMan 5.3, The Cochrane Collaboration, Oxford, United Kingdom) relating the mean difference (MD) and 95% confidence intervals (CIs). The r value for the correlation between salivary glucose level with serum glucose level and salivary glucose level with serum HbA1c level in the patients and controls was used by Comprehensive Meta-Analysis software version 2.2.064 (CMA 2.0; USA). Heterogeneity among the estimates was evaluated by the I2 statistic and Cochran's Q-test; for the Cochran's Q-test, heterogeneity was estimated if P < 0.1 or I2 > 50%, and P value (two-sided) < 0.05 was deemed statistically significant in this meta-analysis. In addition, publication bias was evaluated through funnel plot analysis and the Begg's and Egger's tests, which proposed that the selection of publication was a probable source of bias. The sensitivity analysis and meta-regression as two possible sources of heterogeneity were used, if possible, by subgroup analyses (condition of saliva sampling). The sources of publication bias were also assessed using sensitivity analysis, in which each study with outlier data was removed from analyses. We managed a formula for estimation of mean and SD if the study reported median plus range[12] and for estimation of SD if the study reported the standard error (SE).[13] The units of measurement for glucose and total protein levels, in analyses, were mg/dL and for amylase and s. IgA levels were IU/ml. The unit of HbA1c in the correlations was the percentage (%). The Pearson correlation (r) and t-test of a correlation coefficient were performed for the correlation between salivary and blood glucose or HbA1c levels in the diabetes mellitus patients and the healthy controls.
RESULTS
Characteristics of the studies
A total of 373 studies were found by searching the databases. After excluding the duplicates, 212 studies were recorded for screening, from which 173 studies were no relevant and out of the remaining 39 studies, 14 other studies were excluded with reasons [Figure 1]. Therefore, 25 studies were included and analyzed in the present meta-analysis.
Figure 1.
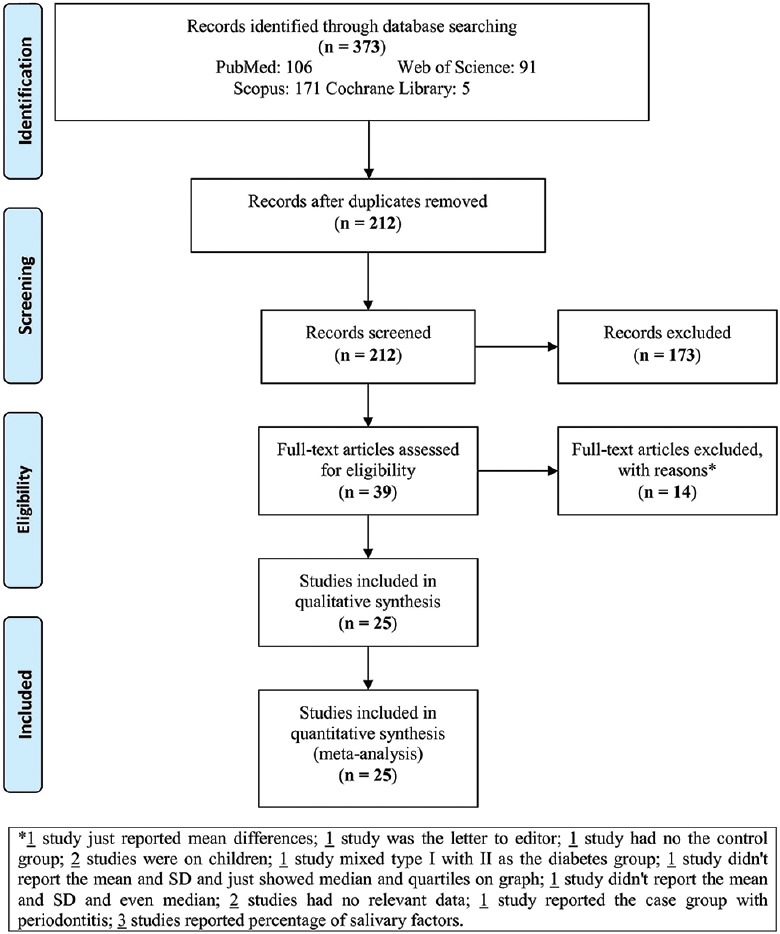
Flowchart of the study
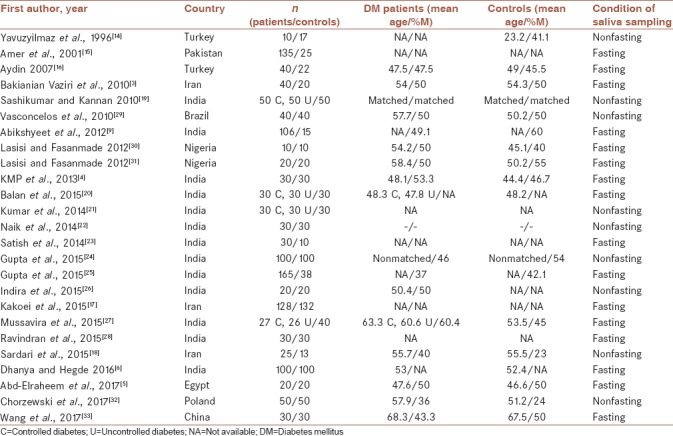
Table 1 shows the baseline characteristics of the 25 included studies in the meta-analysis. The studies were published from 1996 to 2017. Two studies were reported in Turkey,[14,15] one in Pakistan,[16] three in Iran,[3,17,18] thirteen in India,[4,6,9,19,20,21,22,23,24,25,26,27,28] one in Brazil,[29] two in Nigeria,[30,31] one in Egypt,[5] one in Poland,[32] and one in China.[33] There were 1432 and 900 diabetic patients and healthy controls in all studies, respectively. The mean age and percentage of the males in both groups are shown in Table 1. Nine studies measured the salivary profile of patients and controls in non-fasting condition (<2 h)[8,14,19,21,22,24,26,29,32] and 16 studies in fasting (8–12 h) condition.[3,4,5,6,9,15,16,17,20,23,25,27,28,30,31,33] Three studies reported SE,[15,17,27] one study reported median/range,[19] one study reported two means/SDs,[16] and a few studies reported different units, which were changed. Four studies[19,20,21,27] checked separately the factors in controlled diabetic and uncontrolled diabetic patients.
Table 1.
Characteristics of the included studies in meta-analysis (n=25)
Quantitative data synthesis
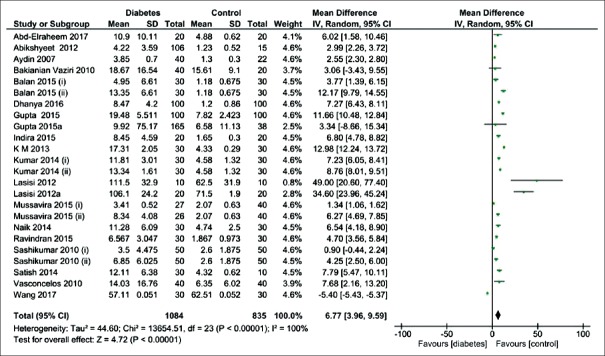
Out of 25 case–control studies, 20 checked the salivary glucose in the diabetic patients and the healthy controls [Figure 2]. The pooled estimate showed the salivary glucose level was significantly higher in the diabetic patients than the healthy controls (MD = 6.77 mg/dL; 95% CI: 3.96, 9.59; P < 0.00001) and I2 = 100%.
Figure 2.
Forest plot of the random-effect of salivary glucose level in the diabetic patients compared with the healthy controls. Signs: (i) controlled diabetic patients; (ii) uncontrolled diabetic patients
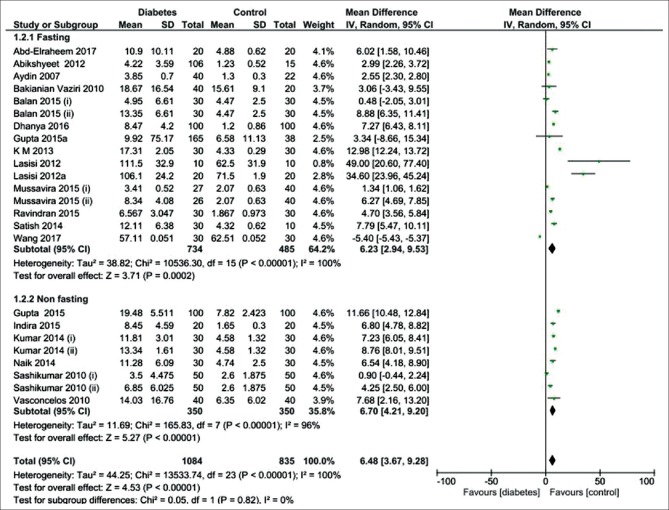
The 20 studies were divided into subgroups based on the condition of saliva sampling (fasting versus nonfasting) [Figure 3]. The pooled subgroup analysis showed that the salivary glucose level in the fasting and nonfasting conditions was significantly higher in the diabetic patients than the healthy controls ([MD = 6.23 mg/dL; 95% CI: 2.94, 9.53; P = 0.0002] and [MD = 6.70 mg/dL; 95% CI: 4.21, 9.203; P < 0.00001], respectively), indicating a high heterogeneity in two subgroups.
Figure 3.
Forest plot of the random-effect of salivary glucose level in the diabetic patients compared with the healthy controls in two subgroups of fasting and non-fasting conditions. Signs: (i) controlled diabetic patients; (ii) uncontrolled diabetic patients
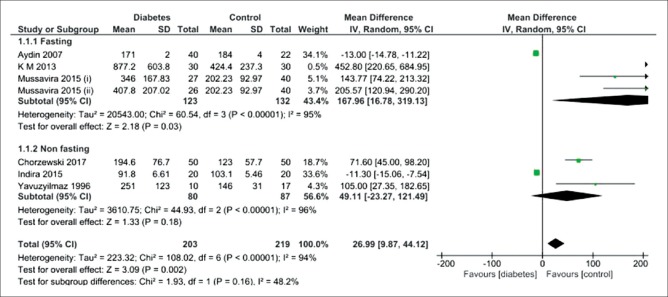
Six studies showed that fasting salivary total protein level was significantly higher in the diabetic patients than the healthy controls (MD = 167.96 mg/dL; 95% CI: 16.78, 319.13; P = 0.03), showing a high heterogeneity [Figure 4]. There was no difference between non-fasting salivary total protein level and the healthy controls (MD = 49.11 mg/dL; 95% CI:-23.27, 121.49; P = 0.18), indicating a high heterogeneity.
Figure 4.
Forest plot of the random-effect of salivary total protein level in the diabetic patients compared with the healthy controls. Signs: (i) controlled diabetic patients; (ii) uncontrolled diabetic patients
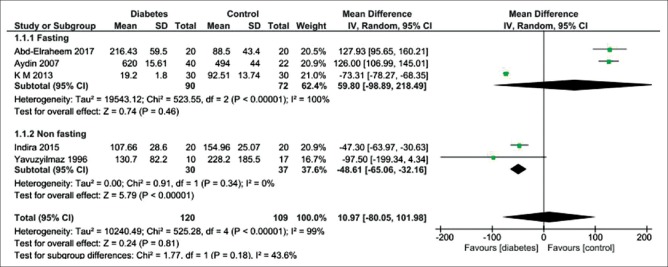
Figure 5 shows five studies reporting no difference in fasting salivary amylase between the diabetic patients and the healthy controls (MD = 59.80 IU/mL; 95% CI: −98.89, 218.49; P = 0.46) and indicating a high heterogeneity. Nonfasting salivary amylase level was significantly lower in diabetic patients than healthy controls (MD = −48.61 IU/mL; 95% CI: −65.06,−32.16; P < 0.00001), indicating no heterogeneity.
Figure 5.
Forest plot of the random-effect of salivary amylase level in the diabetic patients compared with the healthy controls
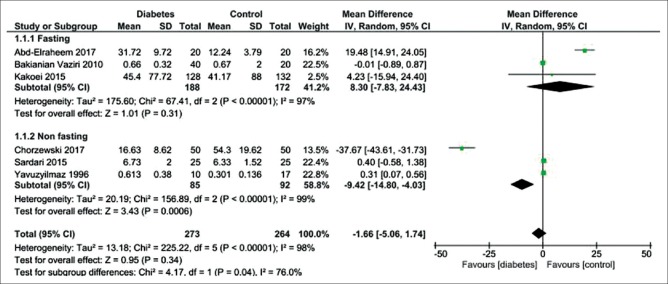
Figure 6 shows six studies that reporting the fasting salivary s. IgA level in the diabetic patients compared to the healthy controls (MD = -1.66 IU/mL; 95% CI: −5.06, 1.71; P = 0.34), showing a high heterogeneity. Nonfasting salivary s. IgA level was significantly lower in diabetic patients than healthy controls (MD = −9.42 IU/mL; 95% CI: −14.80, −4.03; P = 0.0006), revealing a high heterogeneity.
Figure 6.
Forest plot of the random-effect of salivary secretory immunoglobulin A level in the diabetic patients compared with the healthy controls
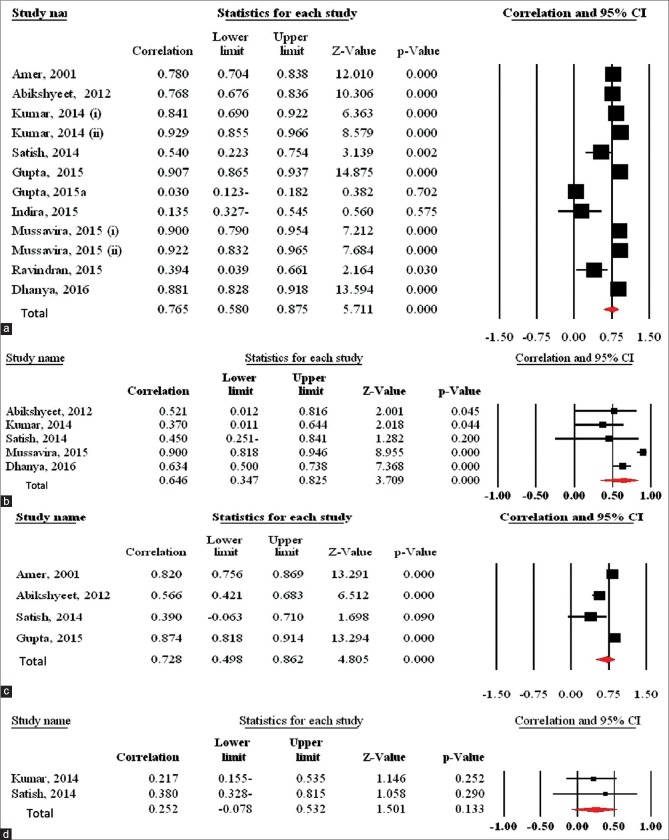
Ten studies[6,9,15,21,23,24,25,26,27,28] showed a correlation between salivary glucose and serum glucose levels in the diabetic patients, r value was found to be >0.75 in seven studies,[6,9,15,21,24,27] which was statistically significant (P < 0.01), and two of which[22,28] checked this correlation in two diabetic groups. The r values in two studies were 0.394[23] and 0.54,[28] being found to be statistically significant (P < 0.05). However, this correlation in two studies[25,26] was not statistically significant (P > 0.05). The pooled estimate showed a significant correlation between salivary glucose and serum glucose in the diabetic patients (r = 0.765; 95% CI = 0.580, 0.875; P < 0.001) [Figure 7a].
Figure 7.
Forest plot of the random-effect of the correlation between (a) salivary glucose and serum glucose levels in the diabetic patients, (b) salivary glucose and serum glucose levels in the healthy controls, (c) salivary glucose and serum hemoglobin A1C levels in the diabetic patients, and (d) salivary glucose and serum hemoglobin A1C levels in the healthy controls. Signs: (i) controlled diabetic patients; (ii) uncontrolled diabetic patients
Five studies[6,9,21,23,27] showed a correlation between salivary glucose and serum glucose levels in the healthy controls, and r value was found to be >0.35 in all studies and was statistically significant (P < 0.05). The pooled estimate showed a significant correlation between salivary glucose and serum glucose in the healthy controls [r = 0.646; 95% CI = 0.347, 0.825; P < 0.001] [Figure 7b].
Four studies[9,15,23,24] showed a correlation between salivary glucose and serum HbA1c levels in the diabetic patients. The pooled estimate showed a significant correlation between salivary glucose and serum HbA1c in the diabetic patients (r = 0.721; 95% CI = 0.483, 0.860; P < 0.001) [Figure 7c].
Two studies[21,23] showed a correlation between salivary glucose and serum HbA1c levels in the healthy controls. This correlation in the two studies was not statistically significant (P > 0.05). The pooled estimate showed no significant correlation between salivary glucose and serum HbA1c in the healthy controls [r = 0.252; 95% CI = −0.078, 0.532; P = 0.133] [Figure 7d].
Quality evaluation
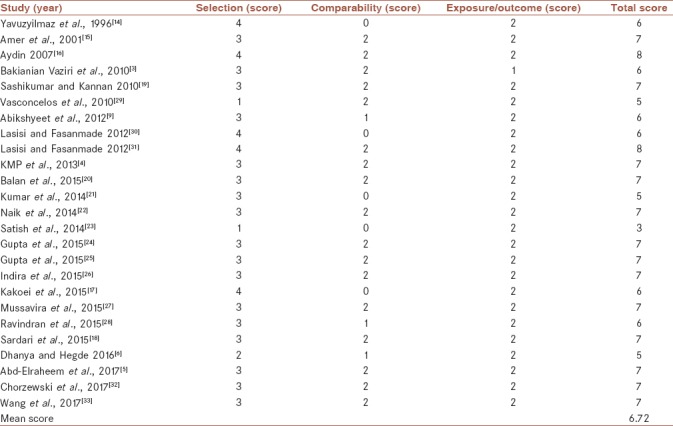
Table 2 shows the quality score for each study in the meta-analysis. The mean quality score of 25 studies was 6.72 (medium quality).
Table 2.
Quality ratings for the studies included on the basis of Newcastle-Ottawa quality assessment scale (N=25)
Publication bias
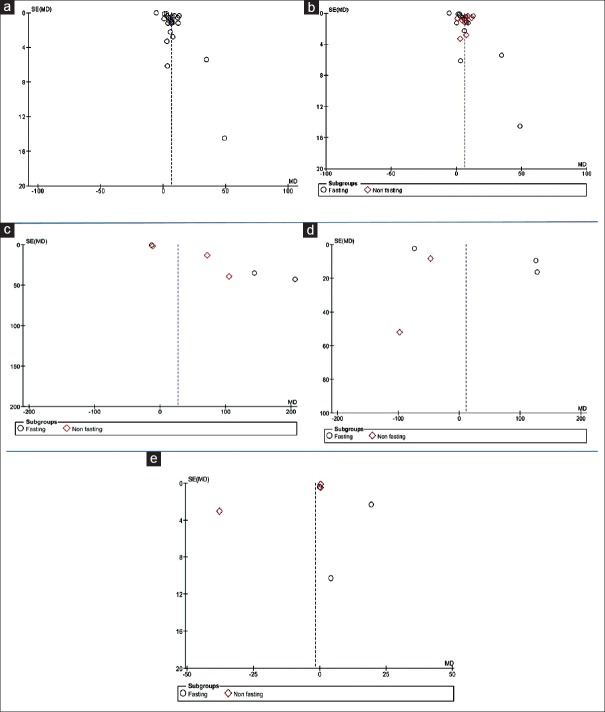
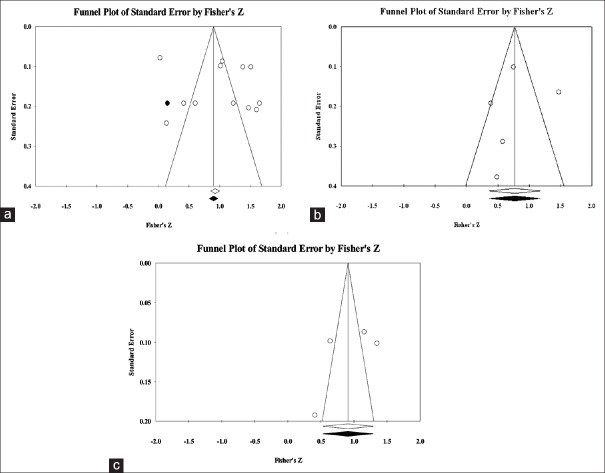
Begg's and Egger's tests were used for analysis of more than two studies. These tests did not reveal a significant evidence of publication bias among the included studies on saliva in salivary glucose level in the diabetic patients versus the healthy controls in nonfasting subgroup [Figure 8b], total protein level in the diabetic patients versus the healthy controls in nonfasting subgroup [Figure 8c], amylase level in the diabetic patients versus the healthy controls in fasting subgroup [Figure 8d], s. IgA level in the diabetic patients versus the healthy controls in both subgroups (fasting and nonfasting) [Figure 8e], correlation between salivary glucose and serum glucose in the diabetic patients [Figure 9a] and in the healthy controls [Figure 9b], and correlation between salivary glucose and HbA1c in the diabetic patients [Figure 9c]. Two tests revealed significant evidence of publication bias among the included studies in salivary glucose level in the diabetic patients versus the healthy controls in fasting subgroup [Figure 8b]. Begg's test revealed, but Egger's test did not reveal the salivary glucose level in the diabetic patients versus the healthy controls [Figure 8a]. Egger's test revealed, but Begg's test did not reveal total protein level in the diabetic patients versus the healthy controls in fasting subgroup [Figure 8c]. Furthermore, the two tests could not be used for the correlation of salivary glucose and HbA1c levels in the healthy controls and amylase level in the diabetic patients versus the healthy controls in nonfasting subgroup because there were only two studies.
Figure 8.
Funnel plot of the random-effect of the correlation between (a) salivary glucose level, (b) salivary glucose in two subgroups, (c) total protein level, (d) amylase level, and (e) secretory immunoglobulin A level in the diabetic patients versus the healthy controls
Figure 9.
Funnel plot of the random-effect of the correlation between (a) salivary glucose and serum glucose in the diabetic patients, (b) salivary glucose and serum glucose in the healthy controls, and (c) salivary glucose and hemoglobin A1C in the diabetic patients
Sensitivity analysis and meta-regression
We used a sensitivity analysis using deleting each study at a time and following the changes in the pooled MDs and 95% CIs [Table 3]. We deleted the study by Wang et al.[33] because outlier data in two analyses of the salivary glucose in the diabetic patients compared with the healthy controls as well as salivary glucose fasting compared with the healthy controls. The pooled estimate showed the salivary glucose level was significantly higher in the diabetic patients than the healthy controls (MD = 6.83 mg/dL; 95% CI: 5.17, 8.50; P < 0.00001). The pooled estimate showed that the fasting salivary glucose level was significantly higher in the diabetic patients than the healthy controls (MD = 6.31 mg/dL; 95% CI: 4.33, 8.28; P < 0.00001). The meta-regression analysis assessing the possible effect of mean age of participants could not be observed as a source of heterogeneity.
Table 3.
Sensitivity analysis

DISCUSSION
The alterations in salivary component could impact the incidence, signs, and severity of oral changes in diabetic patients[5] and metabolic syndrome as a metabolic abnormality can increase risks of T2D.[34] This study estimated salivary glucose, total protein, amylase, and s. IgA levels in T2D patients compared with the healthy controls as well as the correlation of salivary glucose level with serum glucose and HbA1c levels in the patients and controls.
This meta-analysis revealed that the salivary glucose level of T2D patients was significantly higher than that of the healthy controls, as most of the studies reported similar results. The salivary amylase level was lower in patients with T2D than the healthy controls, which was in agreement with the results of Yavuzyilmaz et al.,[14] Panchbhai et al.,[7] KMP et al.,[4] and Indira et al.,[26] but was higher in two studies.[5,16] These differences can be because of the hormonal and metabolic alternations in diabetic patients.[26]
This meta-analysis indicated that salivary total protein level was significantly higher in T2D patients than the healthy controls, as four studies confirmed the results,[4,14,27,32] but two studies had opposite results.[16,26] The observed differences may have different reasons. Total protein level is influenced by the saliva collection method, determination method, diet fluctuations of protein concentration, and even the speed and time of centrifugation.[35] There was no significant difference between the T2D patients and the healthy controls in salivary s. IgA level and three studies showed agreement with this result.[3,17,18] The s. IgA level was higher[5,14] and lower[32] in the T2D patients than the controls in other studies. Therefore, the presence of Candida species and humoral response of the immune system to this microorganism, or compensatory mechanisms in the immune system can lead to enhanced humoral response and salivary IgA level.[1]
Several studies found a significant correlation between salivary and serum glucose levels in diabetic patients[6,9,15,21,23,24,27,28] and healthy controls.[6,9,21,27] Agrawal et al.[36] reported an association between fasting saliva and fasting plasma glucose levels of diabetic patients and healthy controls. In contrast with these results and the results of this meta-analysis, three studies found no significant correlation between diabetic patients[25,26] and healthy controls,[23] which can be because of different evaluation methods of salivary and serum glucose compared with other studies,[25] or small sample size.[25,26,37,38] This meta-analysis showed a significant correlation between salivary and serum HbA1c levels in diabetic patients, as four studies confirmed it[9,15,24] and one study[23] did not. There was no significant correlation in the healthy controls similar to the results of this meta-analysis.[21,25] These results indicate that differences in the study designs and condition of saliva sampling can be two significant reasons for high heterogeneity in the overall analyses.
CONCLUSIONS
This meta-analysis indicated that glucose, total protein, amylase, and s. IgA levels were detectable in the saliva of diabetic patients and healthy controls. Measurement of these salivary factors and paying attention to the condition of saliva sampling (fasting or nonfasting) can be helpful for diagnostic and monitoring purposes of T2D. Therefore, salivary tests may have a basic role in diagnosis and early detection of T2D. In addition, salivary glucose as a diagnostic tool can evaluate serum glucose and HbA1c levels in the diabetic patients.
Financial support and sponsorship
Nil.
Conflicts of interest
There are no conflicts of interest.
Acknowledgments
The authors gratefully acknowledge the Research Council of Kermanshah University of Medical Sciences for the financial supports.
REFERENCES
- 1.Mozaffari HR, Sharifi R, Sadeghi M. Prevalence of oral lichen planus in diabetes mellitus: A Meta-analysis study. Acta Inform Med. 2016;24:390–3. doi: 10.5455/aim.2016.24.390-393. [DOI] [PMC free article] [PubMed] [Google Scholar]
- 2.Schneider H, Shaw J, Zimmet P. Guidelines for the detection of diabetes mellitus – Diagnostic criteria and rationale for screening. Clin Biochem Rev. 2003;24:77–80. [PMC free article] [PubMed] [Google Scholar]
- 3.Bakianian Vaziri P, Vahedi M, Mortazavi H, Abdollahzadeh SH, Hajilooi M. Evaluation of salivary glucose, IgA and flow rate in diabetic patients: A case-control study. J Dent (Tehran) 2010;7:13–8. [PMC free article] [PubMed] [Google Scholar]
- 4.KMP, Johnson P, Ganesh M, Subhashini AS. Evaluation of salivary profile among adult type 2 diabetes mellitus patients in South India. J Clin Diagn Res. 2013;7:1592–5. doi: 10.7860/JCDR/2013/5749.3232. [DOI] [PMC free article] [PubMed] [Google Scholar]
- 5.Abd-Elraheem SE, El Saeed AM, Mansour HH. Salivary changes in type 2 diabetic patients. Diabetes Metab Syndr. 2017;11(Suppl 2):S637–S641. doi: 10.1016/j.dsx.2017.04.018. [DOI] [PubMed] [Google Scholar]
- 6.Dhanya M, Hegde S. Salivary glucose as a diagnostic tool in type II diabetes mellitus: A case-control study. Niger J Clin Pract. 2016;19:486–90. doi: 10.4103/1119-3077.183314. [DOI] [PubMed] [Google Scholar]
- 7.Panchbhai AS, Degwekar SS, Bhowte RR. Estimation of salivary glucose, salivary amylase, salivary total protein and salivary flow rate in diabetics in India. J Oral Sci. 2010;52:359–68. doi: 10.2334/josnusd.52.359. [DOI] [PubMed] [Google Scholar]
- 8.Branco-de-Almeida LS, Alves CM, Lopes FF, Pereira Ade F, Guerra RN, Pereira AL, et al. Salivary IgA and periodontal treatment needs in diabetic patients. Braz Oral Res. 2011;25:550–5. doi: 10.1590/s1806-83242011000600013. [DOI] [PubMed] [Google Scholar]
- 9.Abikshyeet P, Ramesh V, Oza N. Glucose estimation in the salivary secretion of diabetes mellitus patients. Diabetes Metab Syndr Obes. 2012;5:149–54. doi: 10.2147/DMSO.S32112. [DOI] [PMC free article] [PubMed] [Google Scholar]
- 10.Moher D, Liberati A, Tetzlaff J, Altman DG PRISMA Group. Preferred reporting items for systematic reviews and meta-analyses: The PRISMA statement. PLoS Med. 2009;6:e1000097. doi: 10.1371/journal.pmed.1000097. [DOI] [PMC free article] [PubMed] [Google Scholar]
- 11.Wells GA, Shea B, O’Connell D, Peterson J, Welch V, Losos M, et al. Ottawa: Ottawa Hospital Research Institute; 2011. [Last accessed on 2016 Jan 12]. The Newcastle-Ottawa Scale (NOS) for Assessing the Quality of Non-Randomised Studies in Meta-Analyses. Available from: http://www.ohri.ca/programs/clinical_epidemiology/oxford.asp16 . [Google Scholar]
- 12.Hozo SP, Djulbegovic B, Hozo I. Estimating the mean and variance from the median, range, and the size of a sample. BMC Med Res Methodol. 2005;5:13. doi: 10.1186/1471-2288-5-13. [DOI] [PMC free article] [PubMed] [Google Scholar]
- 13.Biau DJ. In brief: Standard deviation and standard error. Clin Orthop Relat Res. 2011;469:2661–4. doi: 10.1007/s11999-011-1908-9. [DOI] [PMC free article] [PubMed] [Google Scholar]
- 14.Yavuzyilmaz E, Yumak O, Akdoğanli T, Yamalik N, Ozer N, Ersoy F, et al. The alterations of whole saliva constituents in patients with diabetes mellitus. Aust Dent J. 1996;41:193–7. doi: 10.1111/j.1834-7819.1996.tb04855.x. [DOI] [PubMed] [Google Scholar]
- 15.Amer S, Yousuf M, Siddqiui PQ, Alam J. Salivary glucose concentrations in patients with diabetes mellitus – A minimally invasive technique for monitoring blood glucose levels. Pak J Pharm Sci. 2001;14:33–7. [PubMed] [Google Scholar]
- 16.Aydin S. A comparison of ghrelin, glucose, alpha-amylase and protein levels in saliva from diabetics. J Biochem Mol Biol. 2007;40:29–35. doi: 10.5483/bmbrep.2007.40.1.029. [DOI] [PubMed] [Google Scholar]
- 17.Kakoei S, Hosseini B, Haghdoost AA, Sanjari M, Gholamhosseinian A, Afshar VF, et al. Evaluation of salivary secretory immunoglobulin A levels in diabetic patients and association with oral and dental manifestations. Sultan Qaboos Univ Med J. 2015;15:e507–11. doi: 10.18295/squmj.2015.15.04.011. [DOI] [PMC free article] [PubMed] [Google Scholar]
- 18.Sardari F, Tahmasbi A, Ghanbarzadegan A. Salivary IgA concentration in diabetic patients compared to healthy controls. Dent Hypotheses. 2015;6:60–4. [Google Scholar]
- 19.Sashikumar R, Kannan R. Salivary glucose levels and oral candidal carriage in type II diabetics. Oral Surg Oral Med Oral Pathol Oral Radiol Endod. 2010;109:706–11. doi: 10.1016/j.tripleo.2009.12.042. [DOI] [PubMed] [Google Scholar]
- 20.Balan P, B Gogineni S, Kumari N S, Shetty V, Lakshman Rangare A, L Castelino R, et al. Candida carriage rate and growth characteristics of saliva in diabetes mellitus patients: A Case-control study. J Dent Res Dent Clin Dent Prospects. 2015;9:274–9. doi: 10.15171/joddd.2015.048. [DOI] [PMC free article] [PubMed] [Google Scholar]
- 21.Kumar S, Padmashree S, Jayalekshmi R. Correlation of salivary glucose, blood glucose and oral candidal carriage in the saliva of type 2 diabetics: A case-control study. Contemp Clin Dent. 2014;5:312–7. doi: 10.4103/0976-237X.137925. [DOI] [PMC free article] [PubMed] [Google Scholar]
- 22.Naik R, Mujib BR, Raaju UR, Telagi N. Assessing oral candidal carriage with mixed salivary glucose levels as non-invasive diagnostic tool in type-2 diabetics of Davangere, Karnataka, India. J Clin Diagn Res. 2014;8:ZC69–72. doi: 10.7860/JCDR/2014/8761.4628. [DOI] [PMC free article] [PubMed] [Google Scholar]
- 23.Satish BN, Srikala P, Maharudrappa B, Awanti SM, Kumar P, Hugar D, et al. Saliva: A tool in assessing glucose levels in diabetes mellitus. J Int Oral Health. 2014;6:114–7. [PMC free article] [PubMed] [Google Scholar]
- 24.Gupta S, Sandhu SV, Bansal H, Sharma D. Comparison of salivary and serum glucose levels in diabetic patients. J Diabetes Sci Technol. 2015;9:91–6. doi: 10.1177/1932296814552673. [DOI] [PMC free article] [PubMed] [Google Scholar]
- 25.Gupta A, Singh SK, Padmavathi BN, Rajan SY, Mamatha GP, Kumar S, et al. Evaluation of correlation of blood glucose and salivary glucose level in known diabetic patients. J Clin Diagn Res. 2015;9:ZC106–9. doi: 10.7860/JCDR/2015/12398.5994. [DOI] [PMC free article] [PubMed] [Google Scholar]
- 26.Indira M, Chandrashekar P, Kattappagari KK, Chandra LP, Chitturi RT, Bv RR, et al. Evaluation of salivary glucose, amylase, and total protein in type 2 diabetes mellitus patients. Indian J Dent Res. 2015;26:271–5. doi: 10.4103/0970-9290.162883. [DOI] [PubMed] [Google Scholar]
- 27.Mussavira S, Dharmalingam M, Omana Sukumaran B. Salivary glucose and antioxidant defense markers in type II diabetes mellitus. Turk J Med Sci. 2015;45:141–7. doi: 10.3906/sag-1306-116. [DOI] [PubMed] [Google Scholar]
- 28.Ravindran R, Gopinathan DM, Sukumaran S. Estimation of salivary glucose and glycogen content in exfoliated buccal mucosal cells of patients with type II diabetes mellitus. J Clin Diagn Res. 2015;9:ZC89–93. doi: 10.7860/JCDR/2015/11633.5971. [DOI] [PMC free article] [PubMed] [Google Scholar]
- 29.Vasconcelos AC, Soares MS, Almeida PC, Soares TC. Comparative study of the concentration of salivary and blood glucose in type 2 diabetic patients. J Oral Sci. 2010;52:293–8. doi: 10.2334/josnusd.52.293. [DOI] [PubMed] [Google Scholar]
- 30.Lasisi TJ, Fasanmade AA. Comparative analysis of salivary glucose and electrolytes in diabetic individuals with periodontitis. Ann Ib Postgrad Med. 2012;10:25–30. [PMC free article] [PubMed] [Google Scholar]
- 31.Lasisi TJ, Fasanmade AA. Salivary flow and composition in diabetic and non-diabetic subjects. Niger J Physiol Sci. 2012;27:79–82. [PubMed] [Google Scholar]
- 32.Chorzewski M, Orywal K, Sierpinska T, Golebiewska M. Salivary protective factors in patients suffering from decompensated type 2 diabetes. Adv Med Sci. 2017;62:211–5. doi: 10.1016/j.advms.2016.06.005. [DOI] [PubMed] [Google Scholar]
- 33.Wang B, Du J, Zhu Z, Ma Z, Wang S, Shan Z, et al. Evaluation of parotid salivary glucose level for clinical diagnosis and monitoring type 2 diabetes mellitus patients. Biomed Res Int 2017. 2017:2569707. doi: 10.1155/2017/2569707. [DOI] [PMC free article] [PubMed] [Google Scholar]
- 34.Tabesh M, Noroozi A, Amini M, Feizi A, Saraf-Bank S, Zare M, et al. Association of retinol-binding protein 4 with metabolic syndrome in first-degree relatives of type 2 diabetic patients. J Res Med Sci. 2017;22:28. doi: 10.4103/1735-1995.200270. [DOI] [PMC free article] [PubMed] [Google Scholar]
- 35.Andjelski-Radicevic B, Dozic R, Todrovic T, Dozic I. Biochemical markers in saliva of patients with diabetes mellitus. Serbian Dent J. 2012;59:198–201. [Google Scholar]
- 36.Agrawal RP, Sharma N, Rathore MS, Gupta VB, Jain S, Agarwal V, et al. Noninvasive method for glucose level estimation by saliva. J Diabetes Metab. 2013;4:266. [Google Scholar]
- 37.Jurysta C, Bulur N, Oguzhan B, Satman I, Yilmaz TM, Malaisse WJ, et al. Salivary glucose concentration and excretion in normal and diabetic subjects. J Biomed Biotechnol 2009. 2009:430426. doi: 10.1155/2009/430426. [DOI] [PMC free article] [PubMed] [Google Scholar]
- 38.Borg Andersson A, Birkhed D, Berntorp K, Lindgärde F, Matsson L. Glucose concentration in parotid saliva after glucose/food intake in individuals with glucose intolerance and diabetes mellitus. Eur J Oral Sci. 1998;106:931–7. doi: 10.1046/j.0909-8836.1998.eos106505.x. [DOI] [PubMed] [Google Scholar]


