Abstract
Background
Colorectal cancer (CRC) is one of the most common malignancies worldwide, with high morbidity and mortality rates. The purpose of this study was to identify potential biomarkers in the progression of CRC.
Material/Methods
Gene and isoform expression datasets of CRC was downloaded from The Cancer Genome Atlas (TCGA). EBSeq of R was used for the normalization of gene and isoform expression, as well as the identification of differential expression genes (DEGs) and isoforms (DEIs) of CRC samples compared with normal samples. The enriched functions of DEGs and DEIs were obtained based on the Database for Annotation, Visualization and Integrated Discovery (DAVID). An independent dataset, GSE38832, was downloaded from the Gene Expression Omnibus (GEO) database for survival analysis of genes with sustained decreased/increased expression values at both gene and isoform levels with the development of CRC.
Results
A total of 2301 genes and 4241 isoforms were found to be significantly differentially expressed in stage I–IV CRC samples. They are closely associated with muscle or cell system activity. Sixteen genes were screened out with sustained decreased/increased expression values at both gene and isoform levels with the development of CRC. Aberrant CBX8 and CD96 expressions were found to be significantly associated with CRC survival.
Conclusions
Through combined analysis of gene and isoform expression profiles, we identified several potential biomarkers that may play an important role in the development of CRC and could be helpful in its early diagnosis and treatment.
MeSH Keywords: Colorectal Neoplasms, Gene Expression, Protein Interaction Maps, Survival Analysis
Background
Colorectal cancer (CRC) is one of leading causes of cancer-related death worldwide, particular in developed countries, such as the United States. Approximately 1.2 million new cases are diagnosed every year [1]. Many factors were thought to be associated with its progression and recurrence, such as stromal fibroblasts and macrophages, as well as race [2,3]. Age was also identified as a valuable predictor of prognosis and it would be better to use different strategies for patients of different ages [4,5]. Early detection was reported to effectively reduce CRC mortality and improve prognosis [6].
CRC is a heterogeneous disease whose progression is associated with multiple factors. It has been studied in many genetic and epigenetic studies and several valuable biomarkers that might contribute its initiation and recurrence have been identified. Estrogen receptor (ER) is an important transcription factor which has been verified to be implicated in cancers in many studies. Williams et al. reported that overexpression of ERβ promotes progression of CRC, and ERβ was considered as a new chemopreventive target [7]. Deregulation of gene expression in cancers are affected by many factors, including the post-transcriptional program [8]. For example, alternative splicing of Rad51C can result in overexpression of its isoform and induce the progression of CRC [9]. One of the isoforms of LD1 – LD1B – which is generated by alternative splicing, plays an important role in the maintenance of cell proliferation, and its deregulation is associated with acquisition of stem-like properties of cancer cells [10]. In addition, the post-transcriptional program can change the expression of isoforms without gene-level expression changes [8]. Therefore, it is important to explore changes at both isoform and gene levels in cancers, which has rarely been conducted.
Rapid development of gene microarray and next-generation sequencing (NGS) provides unprecedented opportunities to study cancers at the gene and isoform levels. The Affymetrix exon array contains ~5 million probes spanning ~1.4 million transcripts. It can be used to detect expression profiles at gene and exon levels based on the development of experimental and bioinformatics methods [11,12]. Some potential biomarkers in cancers have been identified based on exon microarray or NGS. For example, through the combination of exon microarray and RNA sequencing (RNA-Seq), Hoff et al. found that the fusion of VWA2-TCF7L2, DHX35-BPIFA2, and CASZ1-MASP2, as well as some novel transcript structures, may play an important role in CRC [13]. Compared with NGS, microarray has some obvious shortcomings, including the fact that it cannot detect unknown alterations of genomic structure that might contribute to progression of cancers [14]. Therefore, it may be better to use NGS in cancer research.
The Cancer Genome Atlas (TCGA, http://cancergenome.nih.gov/), which was developed by the National Cancer Institute and the National Human Genome Research Institute, manipulates multiple tumor types and their corresponding genomic landscape, including gene expression profiles, as well as genomic structure variation [15]. TCGA facilitates the development of the understanding of mechanisms underlying the progression of cancers, which is limited by the small sample size. Detailed clinical information on all cancer samples is also provided, which allows the determination of associations between genes/pathways and cancer progression. In the present study, through combined analysis of isoform and gene expression profiles of CRC from TCGA, we sought to identify biological processes and genes involved in the development of CRC, which should be helpful for its early diagnosis and precise therapy.
Material and Methods
Gene and isoform expression datasets
Gene and isoform expression datasets in this study were downloaded from TCGA on 12 June 2015. We used the CRC level 3 RNA-Seq V2 datasets, which includes gene- and isoform-level expression values based on Illumina HiSeq 2000. Clinical data from CRC samples was also obtained. The normal samples were separated from CRC samples based on the TCGA barcode, and CRC samples in different stages were also separated from each other.
Differential expression analysis
Differential expression analysis and comparison of both genes and isoforms between CRC and the normal samples was conducted using empirical Bayes hierarchical models based on EBSeq [16]. Genes and isoforms with fold change >2 and FDR adjusted P-value <0.05 were screened out for the following analysis.
Functional enrichment analysis
To explore potential functions of differential expression genes (DEGs) and isoforms (DEIs), we conducted functional enrichment analysis using the Database for Annotation, Visualization, and Integrated analysis (DAVID, https://david.ncifcrf.gov/) [17]. Gene Ontology (GO) terms and Kyoto Encyclopedia of Genes and Genomes (KEGG) pathways with P-value <0.05 were considered as significantly enriched.
Survival analysis
In this study, genes with sustained decreased/increased expression values with the development of CRC at both gene and isoform level were considered to be important. To explore their relations with CRC prognosis, we downloaded an independent CRC dataset from the Gene Expression Omnibus (GEO) database with the accession number GSE38832, which was deposited by Tripathi et al. [18] and consists of 122 CRC samples. Samples were divided into 2 groups based on the median expression value of a specific gene. Kaplan-Meier (KM) analysis was performed for relations of specific gene expression with CRC overall survival (OS) and the log-rank test was used for estimation of significance.
Real-time fluorescence quantitative PCR (RT-PCR)
For RT-PCR analysis, total RNA of CRC cells HCT116, which was adherent with an epithelial morphology, and normal colorectal cells NCM460, which expressed colonic epithelial cell associated antigens, was isolated with TRIzol reagent (Invitrogen, California, USA). The cDNA was synthesized with Moloney murine leukemia virus (M-MLV) reverse transcriptase (Roche, Basel, Switzerland) using random primers and was subjected to PCR amplification using rTaq polymerase (Takara Bio Inc, Shiga, Japan).
The 20-μL PCR reaction mixture contained the following: 1 μL DNA (100 ng), 0.4 μL forward primer (10 μM), 0.4 μL reverse primer (10 μM), and 10 μL SYBR Premix ExTapTM II (2×), and 8.2 μL RNase-free H2O (Roche, Basel, Switzerland).
Results
Normal and cancer samples
A total of 317 samples in TCGA with complete clinical information were obtained, which include 41 normal and 276 CRC samples. Among the CRC samples, there are 45 stage I, 110 stage II, 82 stage III, and 39 stage IV.
Differential expression genes and isoforms
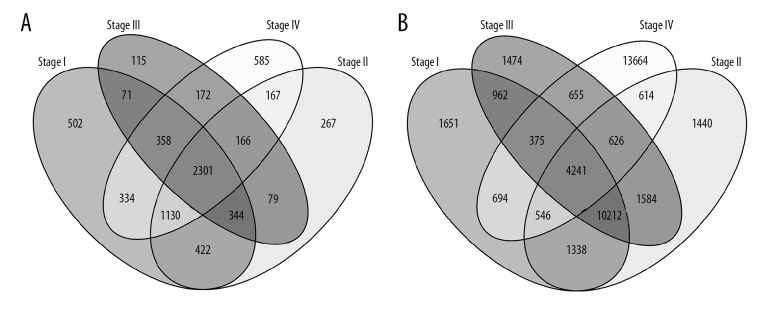
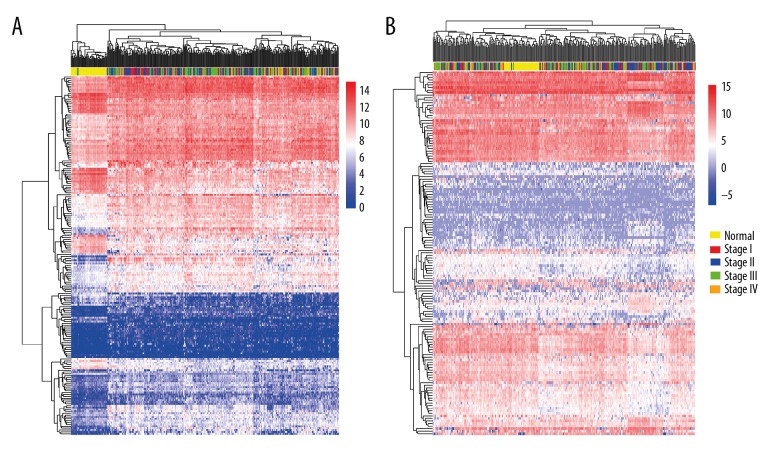
DEGs and DEIs were screened out for stage I, stage II, stage III, and stage IV CRC samples compared with normal samples. Overlapping gene and isoform numbers among the 4 lists of DEGs and DEIs are shown in Figure 1. The hierarchical clustering of the overlapping DEGs/DEIs and samples is shown in Figure 2. Although the cancer samples of different stages were mixed with each other, the normal samples were mostly separated from the cancers based on the expression profiles of both DEGs and DEIs.
Figure 1.
The overlapping DEGs (A) and DEIs (B) among the 4 stages of CRC samples compared with the normal ones.
Figure 2.
The hierarchical clustering. (A) The hierarchical clustering of DEGs and the normal and CRC samples. (B) The hierarchical clustering of DEIs and the normal and CRC samples.
Enriched functions
A total of 49 and 29 GO terms were found to be significantly enriched in the overlapping genes and isoforms, respectively, which are mainly associated with cell and muscle system processes, as well as RNA synthesis. The top 10 most significantly enriched GO terms of the overlapping DEGs and DEIs are shown in Tables 1 and 2, respectively. DEGs and DEIs were all associated with muscle development, while RNA expression regulation-related GO terms were specific to DEGs and adhesion-related GO terms were specific to DEIs. A KEGG pathway (fatty acid metabolism, P-value=0.378) was found to be significantly enriched in overlapping DEGs, and no KEGG pathway was significantly associated with overlapping DEIs.
Table 1.
The top 10 most significant GO terms of the overlapping DEGs.
| Category | GO Name | P-value | Genes |
|---|---|---|---|
| BP | Regulation of transcription from RNA polymerase II promoter | 6.25×10⁻³ | MDFI, KAT2A, CBX4, NUFIP1, LEF1, PDX1, PPARGC1A, BRCA1, TARBP1, LIF, INHBA, GTF2F2, NKX2-5, TWIST1, ALX1 |
| BP | Regionalization | 9.20×10⁻³ | MDFI, KAT2A, HOXC13, TBX20, LEF1, EN1, ALX1 |
| BP | Regulation of striated muscle tissue development | 0.0105 | BCL2, LEF1, NKX2-5, TWIST1 |
| BP | Chordate embryonic development | 0.0107 | KAT2A, TBX15, LEF1, EN1, HOXD1, NKX2-5, BRCA1, TWIST1, ALX1 |
| BP | Pattern specification process | 0.0110 | MDFI, KAT2A, HOXC13, TBX20, LEF1, EN1, GRHL3, ALX1 |
| BP | Regulation of muscle development | 0.0111 | BCL2, LEF1, NKX2-5, TWIST1 |
| BP | Embryonic development ending in birth or egg hatching | 0.0112 | KAT2A, TBX15, LEF1, EN1, HOXD1, NKX2-5, BRCA1, TWIST1, ALX1 |
| BP | Positive regulation of transcription, DNA-dependent | 0.0116 | LIF, INHBA, GTF2F2, TBX20, NUFIP1, LEF1, PDX1, PPARGC1A, NKX2-5, BRCA1, ALX1 |
| MF | Neurotransmitter receptor activity | 0.0119 | GABRD, ANXA9, SSTR1, CHRNA6, NPFFR1 |
| BP | Positive regulation of RNA metabolic process | 0.0123 | LIF, INHBA, GTF2F2, TBX20, NUFIP1, LEF1, PDX1, PPARGC1A, NKX2-5, BRCA1, ALX1 |
BP – biological process; MF – molecular function.
Table 2.
The top 10 most significant GO terms of the overlapping DEIs.
| Category | GO Name | P-value | Genes |
|---|---|---|---|
| BP | Muscle contraction | 2.32×10⁻⁴ | LTB4R, MYL6B, CALD1, TAZ, ASPH, HOMER1, FKBP1B |
| BP | Muscle system process | 3.84×10⁻⁴ | LTB4R, MYL6B, CALD1, TAZ, ASPH, HOMER1, FKBP1B |
| BP | Cell adhesion | 5.57×10⁻⁴ | TYRO3, PDPN, KITLG, MFGE8, CCR8, CD96, COL17A1, CORO1A, PTK2B, ITGAV, COMP, COL8A1, ADAM15 |
| BP | Biological adhesion | 5.64×10⁻⁴ | TYRO3, PDPN, KITLG, MFGE8, CCR8, CD96, COL17A1, CORO1A, PTK2B, ITGAV, COMP, COL8A1, ADAM15 |
| BP | Cell proliferation | 8.00×10⁻⁴ | PDPN, PTK2B, VEGFA, CD276, TNFSF14, KITLG, COL8A1, TACC3, FKBP1B, ERCC2 |
| CC | Basement membrane | 0.00171 | COL17A1, VEGFA, COL8A1, ENTPD2, RELL2 |
| BP | Cell-substrate adhesion | 0.00234 | CORO1A, COL17A1, PTK2B, ITGAV, ADAM15 |
| CC | Extracellular matrix part | 0.00733 | COL17A1, VEGFA, COL8A1, ENTPD2, RELL2 |
| CC | Postsynaptic density | 0.0114 | KLHL17, PTK2B, CALD1, HOMER1 |
| BP | Positive regulation of cell migration | 0.0142 | CORO1A, PDPN, PTK2B, VEGFA |
BP – biological process; CC – cellular component.
Prognostic biomarkers for CRC development and prognosis
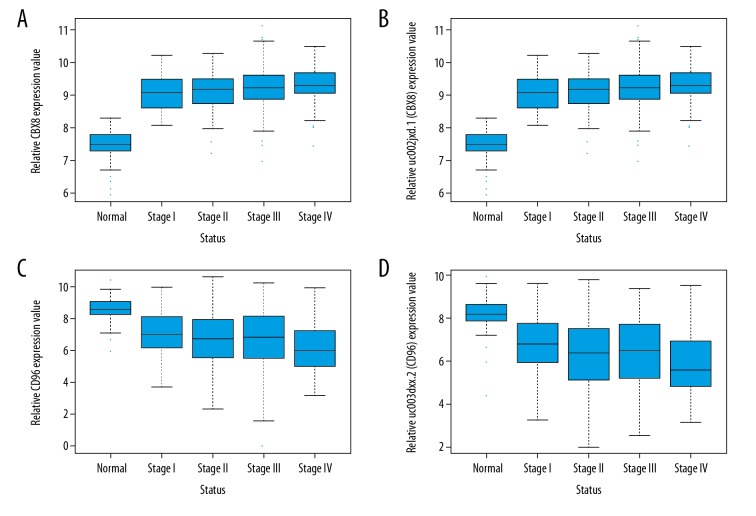
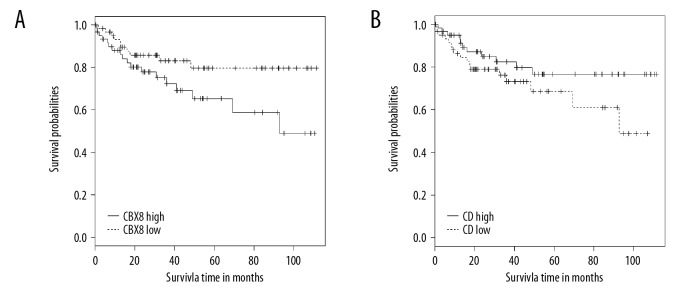
A total of 143 DEIs and 192 DEGs (data not shown) were found to be steadily down- or up-regulated with the development of CRC (from stage I to stage IV). In addition, 16 genes were found to be steadily down- or up-regulated at both gene and isoform levels (down-regulated genes: C20orf151, CD96, ZC3H12D, MOSC2 and IER5L; up-regulated genes: NAT1, LOC388796, EHHADH, LPCAT3, DNAJC28, PHF7, KBTBD11, WDR90, MSH5, CBX8, and FXYD5). As an example, the expression values of CBX8 and CD96 at gene and isoform levels in normal and cancer samples of different stages are shown in Figure 3. The expression values of CBX8 increased with the progression of CRC at gene (Figure 3A) and isoform (Figure 3B) level. For CD96, the expression values at gene (Figure 3C) and isoform (Figure 3D) levels decreased with CRC development. High CBX8 (Figure 4A) and CD96 (Figure 4B) levels were found to be significantly associated with worse and better CRC OS, respectively.
Figure 3.
The expression value of CBX8 and CD96 at gene and isoform levels in normal samples and in different stages of CRC. (A) Expression value of CBX8 at gene level. (B) Expression value of CBX8 at isoform level. (C) Expression value of CD96 at gene level. (D) Expression value of CD96 at isoform level.
Figure 4.
The KM survival plot of CBX8 (A) and CD96 (B) obtained from GSE38832.
RT-PCR analysis
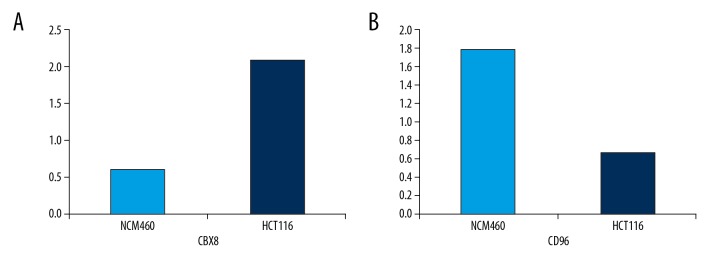
For CBX8 and CD96, we further confirmed their expression differences in CRC cells HCT116 and colorectal cells NCM460 through use of RT-PCR. Primers for CBX8 and CD96 were as follows: CBX8: Forward Primer: ATGGAGCTTTCAGCGGTGG, Reverse Primer: ATGCGTCCTTTCCGTATGCG; CD96: Forward Primer: CAAACACAGACAGTAGGCTTCTT Reverse Primer: GGGGATGATAGACAGCAATCAG. As a result, consistent with the results of RNA-seq analysis, the expression level of CBX8 in HCT116 cells was significantly higher than in NCM460 cells, and expression level of CD96 in HCT116 cells was significantly lower than in NCM460 cells (Figure 5).
Figure 5.
RT-PCR analysis of CBX8 (A) and CD96 (B) expression levels in CRC cell line HCT116 and colorectal cell line NCM460.
Discussion
Rapid development of high-throughput gene expression profiling technologies, such as gene microarray and NGS, have accumulated a large volume of transcriptome data, most of which remains unexploited. Some databases have been developed to deposit them and can be accessed freely, such as GEO, Sequence Read Archive (SRA), and TCGA. Deep analysis of these data would revolutionize understanding of the progression of many diseases, particularly cancers. Here, through analysis of the many CRC samples from TCGA, we sought to identify some potential biomarkers that play important roles in CRC.
CRC is one of the most common malignant cancers, with ~20% distant metastasis and a low 5-year survival rate [19]. CRC initiation can attribute chromosomal instability, aberrant DNA methylation, and microsatellite instability [20]. Inflammation and microRNAs were also reported to be associated with CRC prognosis and survival [21]. Some risk factors that contribute to the progression of CRC have been identified, including diabetes, body mass index (BMI), and intestinal microenvironment [22,23]. Genetics and epigenetics were also verified to contribute to the initiation and progression of CRC. For example, down-regulation of RAB27A and RAB27B is associated with metastasis and poor prognosis [24], and 2 single-nucleotide polymorphisms (SNP) – rs2234767 and rs1800682 – of FAS can affect the progression of CRC by regulating the recruitment to chromatin of SP1/STAT1 complex [25]. Strikingly, muscle and skeletal system-related processes were found to be significantly enriched in both DEGs and DEIs in our study. Previous studies have proven skeletal and muscle metastasis sites in multiple types of cancers [26,27]. Variations of some muscle-specific molecules were also verified to affect the progression of CRC. For example, the muscle-specific miR-113b was down-regulated in CRC [28], and the expression of alpha smooth muscle actin (caspase-3 and Ki-67) can influence the effectiveness of Ocoxin® oral solution in liver metastatic CRC [29]. All of those studies should provide valuable therapeutic targets for CRC.
Alternative splicing is an important post-transcriptional mechanism that can result in multiple isoforms of a single gene. Deregulation of an isoform sometimes has no influence on the overall expression of the mRNA, but still facilitates the progression of some diseases. In addition, rapid development of NGS promotes the identification of more and more new isoforms, some of which are thought of potential biomarkers in cancers. For example, the ELF5 isoform is tissue-specific and is significantly altered in many types of cancers [30], and the alternative splicing of ER, HER2, and CD44 were also screened out in a study by Inoue [31]. In the present study, we identified 16 genes with sustained down- or up-regulated expression values at both isoform and gene levels with the development of CRC, which may be important biomarkers of CRC. Among these 16 genes, expression levels of CBX8 and CD96 were illustrated in normal and in cancer samples in different stages (Figure 3). Combined with the survival analysis from an independent dataset (Figure 4), our results suggest that CBX8 acts as an oncogene and CD96 acts as a suppressor gene in CRC.
CBX8, also known as PC3 and RC1, is a novel biomarker with DNA repair function and can promote tumorigenesis in several types of cancers [32]. CBX8 was found to be overexpressed in hepatocellular carcinoma (HCC) and was significantly associated with poor prognosis of HCC patients [33]. In CRC, the role of CBX8 remains unclear due to its function of inhibiting CRC cell proliferation but promoting CRC metastasis [34]. We identified its overexpression in CRC and its relationship with poor CRC prognosis in different datasets for the first time. To determine the role of CBX8 in CRC, further experimental studies are still needed. For CD96 (TACTILE), studies have mainly focussed on acute myeloid leukemia [35–37], but it might be a novel target in the development of CRC.
Conclusions
Through combined analysis of expression data at gene and isoform levels, we screened out 16 signatures with sustained decreased/increased expression values with CRC development. Survival analysis based on another independent dataset also indicated important roles of some of the 16 genes in CRC. Our study provides some potential targets that may be helpful in the treatment of CRC.
Footnotes
Conflict of interest
None.
Source of support: Departmental sources
References
- 1.Guo M, Dou J. Advances and perspectives of colorectal cancer stem cell vaccine. Biomed Pharmacother. 2015;76:107–20. doi: 10.1016/j.biopha.2015.10.027. [DOI] [PubMed] [Google Scholar]
- 2.Owusu BY, Vaid M, Kaler P, Klampfer L, et al. Prognostic and predictive significance of stromal fibroblasts and macrophages in colon cancer. Biomark Cancer. 2015;7(Suppl 1):29–37. doi: 10.4137/BIC.S25247. [DOI] [PMC free article] [PubMed] [Google Scholar]
- 3.Tawk R, Abner A, Ashford A, Brown CP. Differences in colorectal cancer outcomes by race and insurance. Int J Environ Res Public Health. 2015;13(1) doi: 10.3390/ijerph13010048. ijerph13010048. [DOI] [PMC free article] [PubMed] [Google Scholar]
- 4.Hubbard JM. Management of colorectal cancer in older adults. Clin Geriatr Med. 2016;32(1):97–111. doi: 10.1016/j.cger.2015.08.002. [DOI] [PubMed] [Google Scholar]
- 5.van Eeghen EE, Bakker SD, van Bochove A, Loffeld RJ, et al. Impact of age and comorbidity on survival in colorectal cancer. J Gastrointest Oncol. 2015;6(6):605–12. doi: 10.3978/j.issn.2078-6891.2015.070. [DOI] [PMC free article] [PubMed] [Google Scholar]
- 6.Gimeno-García AZ, Hernández-Álvarez-de-Buylla N, Nicolás-Pérez D, et al. Colorectal cancer screening in the familial risk population: Is colonoscopy still the strategy of choice? Gastroenterol Hepatol. 2016;39(5):352–60. doi: 10.1016/j.gastrohep.2015.09.009. [DOI] [PubMed] [Google Scholar]
- 7.Williams C, DiLeo A, Niv Y, Gustafsson JÅ. Estrogen receptor beta as target for colorectal cancer prevention. Cancer Lett. 2016;372(1):48–56. doi: 10.1016/j.canlet.2015.12.009. [DOI] [PMC free article] [PubMed] [Google Scholar]
- 8.Liu Q, Zhao S, Su PF, Yu S. Gene and isoform expression signatures associated with tumor stage in kidney renal clear cell carcinoma. BMC Syst Biol. 2013;7(Suppl 5):S7. doi: 10.1186/1752-0509-7-S5-S7. [DOI] [PMC free article] [PubMed] [Google Scholar]
- 9.Kalvala A, Gao L, Aguila B, et al. Overexpression of Rad51C splice variants in colorectal tumors. Oncotarget. 2015;6(11):8777–87. doi: 10.18632/oncotarget.3209. [DOI] [PMC free article] [PubMed] [Google Scholar]
- 10.Manrique I, Nguewa P, Bleau AM, et al. The inhibitor of differentiation isoform Id1b, generated by alternative splicing, maintains cell quiescence and confers self-renewal and cancer stem cell-like properties. Cancer Lett. 2015;356(2 Pt B):899–909. doi: 10.1016/j.canlet.2014.10.035. [DOI] [PubMed] [Google Scholar]
- 11.Lockstone HE. Exon array data analysis using Affymetrix power tools and R statistical software. Brief Bioinform. 2011;12(6):634–44. doi: 10.1093/bib/bbq086. [DOI] [PMC free article] [PubMed] [Google Scholar]
- 12.Kapur K, Xing Y, Ouyang Z, Wong WH. Exon arrays provide accurate assessments of gene expression. Genome Biol. 2007;8(5):R82. doi: 10.1186/gb-2007-8-5-r82. [DOI] [PMC free article] [PubMed] [Google Scholar]
- 13.Hoff AM, Johannessen B, Alagaratnam S, et al. Novel RNA variants in colorectal cancers. Oncotarget. 2015;6(34):36587–602. doi: 10.18632/oncotarget.5500. [DOI] [PMC free article] [PubMed] [Google Scholar]
- 14.Zhang W, Yu Y, Hertwig F, et al. Comparison of RNA-seq and microarray-based models for clinical endpoint prediction. Genome Biol. 2015;16:133. doi: 10.1186/s13059-015-0694-1. [DOI] [PMC free article] [PubMed] [Google Scholar]
- 15.Cancer Genome Atlas Research Network. Weinstein JN, Collisson EA, Mills GB, et al. The Cancer Genome Atlas Pan-Cancer analysis project. Nat Genet. 2013;45(10):1113–20. doi: 10.1038/ng.2764. [DOI] [PMC free article] [PubMed] [Google Scholar]
- 16.Leng N, Dawson JA, Thomson JA, et al. EBSeq: An empirical Bayes hierarchical model for inference in RNA-seq experiments. Bioinformatics. 2013;29(8):1035–43. doi: 10.1093/bioinformatics/btt087. [DOI] [PMC free article] [PubMed] [Google Scholar]
- 17.Huang da W, Sherman BT, Lempicki RA. Systematic and integrative analysis of large gene lists using DAVID bioinformatics resources. Nat Protoc. 2009;4(1):44–57. doi: 10.1038/nprot.2008.211. [DOI] [PubMed] [Google Scholar]
- 18.Tripathi MK, Deane NG, Zhu J, et al. Nuclear factor of activated T-cell activity is associated with metastatic capacity in colon cancer. Cancer Res. 2014;74(23):6947–57. doi: 10.1158/0008-5472.CAN-14-1592. [DOI] [PMC free article] [PubMed] [Google Scholar]
- 19.Miyoshi N, Ohue M, Shingai T, et al. Clinicopathological characteristics and prognosis of stage IV colorectal cancer. Mol Clin Oncol. 2015;3(5):1093–98. doi: 10.3892/mco.2015.598. [DOI] [PMC free article] [PubMed] [Google Scholar]
- 20.Tariq K, Ghias K. Colorectal cancer carcinogenesis: A review of mechanisms. Cancer Biol Med. 2016;13(1):120–35. doi: 10.28092/j.issn.2095-3941.2015.0103. [DOI] [PMC free article] [PubMed] [Google Scholar]
- 21.Colussi D, Brandi G, Bazzoli F, Ricciardiello L. Molecular pathways involved in colorectal cancer: Implications for disease behavior and prevention. Int J Mol Sci. 2013;14(8):16365–85. doi: 10.3390/ijms140816365. [DOI] [PMC free article] [PubMed] [Google Scholar]
- 22.Wang X, Huycke MM. Colorectal cancer: Role of commensal bacteria and bystander effects. Gut Microbes. 2015;6(6):370–76. doi: 10.1080/19490976.2015.1103426. [DOI] [PMC free article] [PubMed] [Google Scholar]
- 23.Ottaiano A, Nappi A, Tafuto S, et al. Diabetes and body mass index are associated with neuropathy and prognosis in colon cancer patients treated with capecitabine and oxaliplatin adjuvant chemotherapy. Oncology. 2016;90(1):36–42. doi: 10.1159/000442527. [DOI] [PubMed] [Google Scholar]
- 24.Dong W, Cui J, Yang J, et al. Decreased expression of Rab27A and Rab27B correlates with metastasis and poor prognosis in colorectal cancer. Discov Med. 2015;20(112):357–67. [PubMed] [Google Scholar]
- 25.Wang S, Wu S, Meng Q, et al. FAS rs2234767 and rs1800682 polymorphisms jointly contributed to risk of colorectal cancer by affecting SP1/STAT1 complex recruitment to chromatin. Sci Rep. 2016;6:19229. doi: 10.1038/srep19229. [DOI] [PMC free article] [PubMed] [Google Scholar]
- 26.Tuoheti Y, Okada K, Osanai T, et al. Skeletal muscle metastases of carcinoma: A clinicopathological study of 12 cases. Jpn J Clin Oncol. 2004;34(4):210–14. doi: 10.1093/jjco/hyh036. [DOI] [PubMed] [Google Scholar]
- 27.Stenzl A, Cowan NC, De Santis M, et al. The updated EAU guidelines on muscle-invasive and metastatic bladder cancer. Eur Urol. 2009;55(4):815–25. doi: 10.1016/j.eururo.2009.01.002. [DOI] [PubMed] [Google Scholar]
- 28.Lv LV, Zhou J, Lin C, et al. DNA methylation is involved in the aberrant expression of miR-133b in colorectal cancer cells. Oncol Lett. 2015;10(2):907–12. doi: 10.3892/ol.2015.3336. [DOI] [PMC free article] [PubMed] [Google Scholar]
- 29.Márquez J, Mena J, Hernandez-Unzueta I, et al. Ocoxin(R) oral solution slows down tumor growth in an experimental model of colorectal cancer metastasis to the liver in Balb/c mice. Oncol Rep. 2016;35(3):1265–72. doi: 10.3892/or.2015.4486. [DOI] [PMC free article] [PubMed] [Google Scholar]
- 30.Piggin CL, Roden DL, Gallego-Ortega D, et al. ELF5 isoform expression is tissue-specific and significantly altered in cancer. Breast Cancer Res. 2016;18(1):4. doi: 10.1186/s13058-015-0666-0. [DOI] [PMC free article] [PubMed] [Google Scholar]
- 31.Inoue K, Fry EA. Aberrant splicing of estrogen receptor, HER2, and CD44 genes in breast cancer. Genet Epigenet. 2015;7:19–32. doi: 10.4137/GEG.S35500. [DOI] [PMC free article] [PubMed] [Google Scholar]
- 32.Xiao W, Ou C, Qin J, et al. CBX8, a novel DNA repair protein, promotes tumorigenesis in human esophageal carcinoma. Int J Clin Exp Pathol. 2014;7(8):4817–26. [PMC free article] [PubMed] [Google Scholar]
- 33.Gao SB, Sun SL, Zheng QL, et al. Genetic alteration and misexpression of Polycomb group genes in hepatocellular carcinoma. Am J Cancer Res. 2015;5(10):2969–79. [PMC free article] [PubMed] [Google Scholar]
- 34.Tang J, Wang G, Zhang M, et al. Paradoxical role of CBX8 in proliferation and metastasis of colorectal cancer. Oncotarget. 2014;5(21):10778–90. doi: 10.18632/oncotarget.2502. [DOI] [PMC free article] [PubMed] [Google Scholar]
- 35.Chávez-González A, Dorantes-Acosta E, Moreno-Lorenzana D, et al. Expression of CD90, CD96, CD117, and CD123 on different hematopoietic cell populations from pediatric patients with acute myeloid leukemia. Arch Med Res. 2014;45(4):343–50. doi: 10.1016/j.arcmed.2014.04.001. [DOI] [PubMed] [Google Scholar]
- 36.Larsen HØ, Roug AS, Nielsen K, et al. Nonviral transfection of leukemic primary cells and cells lines by siRNA-a direct comparison between Nucleofection and Accell delivery. Exp Hematol. 2011;39(11):1081–89. doi: 10.1016/j.exphem.2011.08.003. [DOI] [PubMed] [Google Scholar]
- 37.Majeti R. Monoclonal antibody therapy directed against human acute myeloid leukemia stem cells. Oncogene. 2011;30(9):1009–19. doi: 10.1038/onc.2010.511. [DOI] [PubMed] [Google Scholar]


