

Abstract
Background
Several epidemiology studies have explored the association between dietary B vitamins’ intake and the risk of esophageal cancer (EC). However, the results remain inconclusive. Thus, we conducted a systematic review with meta-analysis to evaluate such association.
Methods
Literature retrieval was performed using PubMed (Medline), ScienceDirect, and Cochrane Library electronic databases for all studies published from database inception to December 2017.
Results
The meta-analysis included 19 studies and showed an overall decreased risk of EC (OR=0.77, 95% CI: 0.68–0.87) in association with multivitamin B (ie, B1, B2, B3, B5, B6, B9, and B12) dietary intake. In a subgroup analysis based on vitamin B subclass, B1, B3, B6, and B9 vitamins were associated with decreased EC risk (vitamin B1: OR=0.68, 95% CI: 0.56–0.82; vitamin B3: OR=0.70, 95% CI: 0.53–0.94; vitamin B6: OR=0.64, 95% CI: 0.49–0.83; and vitamin B9: OR=0.69, 95% CI: 0.55–0.86). By contrast, no association was detected between dietary vitamin B2 and vitamin B5 intake and EC risk (vitamin B2: OR=0.86, 95% CI: 0.64–1.16; vitamin B5: OR=0.49, 95% CI: 0.20–1.20), whereas a potential non-linear dose–response association was found between dietary vitamin B12 intake and EC risk. A statistically significant, inverse association was observed for an increase of 100 µg/day in supplemental vitamin B6 and B9 and EC risk (vitamin B6: OR=0.98, 95% CI: 0.98–0.99; vitamin B9: OR= 0.89; 95% CI: 0.86–0.94).
Conclusion
These findings support that vitamin B may have an influence on carcinogenesis of the esophagus. Vitamin B1, B3, B6, B9 showed a decreased risk of EC, and vitamin B12 showed an increased risk of EC.
Keywords: B vitamins, esophageal cancer, meta-analysis
Introduction
Esophageal cancer (EC) has been ranked as the eighth most common cancer and the sixth leading cause of cancer-related deaths worldwide.1 Its epidemiology varies widely, particularly in incidence rates among geographic regions.2 The latest epidemiological studies indicated the highest rate of EC located on the “esophageal cancer belt” ie, China, South Africa, and France.3,4 Possible risk factors for EC include alcohol drinking, hot-temperature food items, cigarette smoking, chronic mucosal irritation, and a family history of cancers.5–7 Deficiency of nutrients, such as vitamins and micro-elements, was also found to be associated with an increased risk of EC, whereas a high intake of fruit and vegetables has been considered to be effective in prevention.6 Several previous research studies have evaluated the effect of beta-carotene, vitamin A, C, and E on EC.8–17 Regarding multivitamin B, most studies only examined folate intake and EC risk, and no relevant pooled analyses have been performed. Thus, we conducted a meta-analysis of the current epidemiological articles to better characterize the association between multivitamin B intake and EC risk.
Materials and methods
Search strategy
We conducted a systematic search for published articles and abstracts that evaluated the relationships between B vitamins (B1, B2, B3, B5, B6, B9, B12) and the risk of esophageal carcinoma in humans.
We conducted systemic searches of PubMed (Medline), ScienceDirect, and Cochrane Library electronic databases (from database inception to December 2017). The searches were performed using ((((cohort studies) OR case–control studies)) AND (((((((((((((vitamin B) OR vitamin B1) OR vitamin B2) OR vitamin B3) OR vitamin B5) OR vitamin B6) OR vitamin B9) OR vitamin B12) OR thiamin) OR riboflavin) OR pyridoxal) OR folate) OR cyanocobalamin)) AND (((((cancer) OR neoplasm) OR carcinoma)) AND Esophag*) in all fields. In addition, we scrutinized references from relevant original reports, review articles, and meta-analyses to identify other appropriate studies.
Inclusion criteria
In order to be included, the following criteria were needed: 1) the study was designed as a cohort, nested case–control or case–control study; 2) the study reported vitamin B and any kind of B vitamin group intake and the risk of EC; 3) the results reported effect estimates (RR, OR) and 95% CIs for comparisons between high and low dietary vitamin B intake. When multiple levels of vitamin B intake were presented, the ratio comparing the highest intake vs the lowest intake was chosen. When data from several publications were overlapping, we selected the articles with the most comprehensive data for inclusion in this meta-analysis.
Data extraction and quality assessment
Two researchers independently reviewed titles and abstracts of potentially eligible research identified by the search strategy and extracted the date using a standard extraction form from each included publication: the first author’s name, publication year, source of control, study design, country where the study was performed, type of cancer, specific vitamin measured, number of cases, number of controls or cohort size, total sample size, lowest vitamin B level, highest vitamin B level, difference between the highest and lowest vitamin B levels, and the risk estimates on EC and corresponding 95% CIs for the highest vs lowest categories of vitamin B intake or for each category, factors adjusted for. Adjusted ratios were extracted in preference to non-adjusted ratios.
Two authors independently assessed the quality of included studies using the Newcastle–Ottawa Scale (NOS), which is a validated scale for assessing the quality of non-randomized studies in meta-analyses.18,19 This scale awards a maximum of 9 points to each study: 4 for selection of participants and measurement of exposure, 2 for comparability of cohorts on the basis of the design or analysis, and 3 for evaluation of methodological quality outcomes. We assigned scores of 7 or higher to high-quality studies.20,21
Statistical analyses
In this meta-analysis, we calculated effect estimates (RR or OR) and 95% CIs in each study to evaluate the relationship between vitamin B intake and the risk of EC. We used a fixed effects model (Mantel–Haenszel method) when heterogeneity was negligible, and a random effects model (DerSimonian and Laird method) when heterogeneity was significant. Heterogeneity was assessed using I2 statistic. Significant heterogeneity was indicated if I2 values were greater than 50%.22,23 We also performed a sensitivity analysis by removing individual studies from the meta-analysis when statistically significant heterogeneity was detected. We also used Egger’s and Begg’s tests to assess publication bias.24,25 All tests were two-sided and results were regarded as statistically significant if P<0.05. All statistical analyses were done by using STATA software (version 12.0; StataCorp LP, College Station, TX, USA).
Results
Literature search
Figure 1 shows the literature search results and screening of this study. We identified 390 observational studies from PubMed (Medline), ScienceDirect, and Cochrane Library. A total of 332 articles were assessed after eliminating 58 duplicate papers. A total of 268 articles were excluded owing to reported irrelevant results after reviewing the title and abstract. In addition, three additional studies were found by a manual search of the reference lists. In total, full text of 67 articles was reviewed. Among them, 13 studies did not show the association of vitamin B and EC risk, because these 13 articles explored the relationship between nutrient intervention or mineral compound vitamin B or all the nutrient intake and risk of EC or precancerous lesions. Four articles did not report sufficient data for estimation of OR/RR, three articles did not separately report the 95% CI, nine articles were reviews, 12 articles reported the prognosis of EC patients, five articles focused on gene type and vitamin B exposures, and two articles focused on blood vitamin B9, B12. As a result, 19 articles were finally selected for the meta-analysis.8,9,26–42
Figure 1.

The flow diagram of screened, excluded, and analyzed publications.
Characteristics and quality of included studies
We identified 19 articles in our study. Tables 1 and 2 show the main characteristics extracted from included studies. All the studies were conducted in Asia, Europe, America, and Australia and were published from 1988 to 2017. Among all the studies, one study was a cohort study42 and 18 studies were case–control studies.8,9,26–41
Table 1.
Characteristics of studies on B vitamin intake and esophageal cancer risk
| Author | Year | Source of control | Study of design | Country | Cancer type | Vitamin B | Exposure ascertainment | OR (95% CI) for highest vs lowest category | Participants (cases) | Adjust variables | New Castle–Ottawa scale |
|---|---|---|---|---|---|---|---|---|---|---|---|
|
| |||||||||||
| Jessri et al | 2011 | HB | Case–control | Iran | ESCC | VB1 | FFQ | 0.34 (0.06–2.85) | 144 (48) | Age, gender, energy intake, BMI, smoking status, physical activity, education level, gastroesophageal reflux disease symptoms | 8 |
| Ibiebele et al | 2011 | PB | Case–control | Australian | EAC | VB1 | FFQ | 0.78 (0.57–1.07) | 519 (147) | Age, gender, education, BMI, alcohol intake, smoking status, energy intake, NSAID use | 8 |
| ESCC | VB1 | FFQ | 0.41 (0.25–0.67) | 429 (57) | Age, gender, education, BMI, alcohol intake, smoking status, energy intake, NSAID use | 8 | |||||
| Mayne et al | 2001 | PB | Case–control | US | EAC | VB1 | FFQ | 0.73 (0.50–1.07) | 969 (282) | Age, gender, site, race, proxy status, income, education, BMI, smoking status, alcohol, energy intake | 8 |
| ESCC | VB1 | FFQ | 0.78 (0.46–1.30) | 893 (206) | Age, gender, site, race, proxy status, income, education, BMI, smoking status, alcohol, energy intake | 8 | |||||
| Zhang et al | 1997 | HB | Case–control | US | EAC | VB1 | FFQ | 0.80 (0.30–2.10) | 48 (18) | NR | 6 |
| Brown et al | 1988 | HB | Case–control | US | EC | VB1 | FFQ | 0.60 (0.30–1.10) | 629 (207) | Smoking status, alcohol intake | 6 |
| Sharp et al | 2013 | PB | Case–control | Ireland | EAC | VB2 | FFQ | 1.07 (0.63–1.82) | 129 (64) | Age, gender, total energy intake | 9 |
| Jessri et al | 2011 | HB | Case–control | Iran | ESCC | VB2 | FFQ | 0.22 (0.07–0.86) | 144 (48) | Age, gender, energy intake, BMI, smoking status, physical activity, education level, gastroesophageal reflux disease symptoms | 8 |
| Ibiebele et al | 2011 | PB | Case–control | Australian | EAC | VB2 | FFQ | 1.32 (0.98–1.80) | 518 (146) | Age, gender, education, BMI, alcohol intake, smoking status, energy intake, NSAID use | 8 |
| ESCC | VB2 | FFQ | 0.78 (0.50–1.21) | 422 (50) | Age, gender, education, BMI, alcohol intake, smoking status, energy intake, NSAID use | 8 | |||||
| Mayne et al | 2001 | PB | Case–control | US | EAC | VB2 | FFQ | 1.11 (0.82–1.52) | 969 (282) | Age, gender, site, race, proxy status, income, education, BMI, smoking status, alcohol, energy intake | 8 |
| ESCC | VB2 | FFQ | 1.26 (0.84–1.89) | 893 (206) | Age, gender, site, race, proxy status, income, education, BMI, smoking status, alcohol, energy intake | 8 | |||||
| Bao et al | 2013 | PB | Case–control | China | ESCC | VB2 | Serum | 0.46 (0.32–0.67) | 212 (106) | Age, gender, site | 7 |
| Fanidi et al | 2014 | PB | Nested case–control | European | ESCC | VB2 | Serum | 1.21 (0.54–2.72) | 252 (123) | Age, gender, country, educational attainment, smoking status, alcohol intake | 8 |
| EAC | VB2 | Serum | 1.95 (0.84–4.52) | 268 (26) | Age, gender, country, educational attainment, smoking status, alcohol intake | 8 | |||||
| Zhang et al | 1997 | HB | Case–control | US | EAC | VB2 | Food records | 0.40 (0.20–1.10) | 44 (13) | NR | 6 |
| Chen et al | 2009 | PB | Case–control | US | EAC | VB2 | Validated HHHQ | 0.50 (0.20–1.00) | 573 (124) | Age, gender, respondent type, BMI, alcohol intake, tobacco use, education level, family history, vitamin supplement use | 8 |
| Jessri et al | 2011 | HB | Case–control | Iran | ESCC | VB3 | FFQ | 0.38 (0.15–1.82) | 144 (48) | Age, gender, energy intake, BMI, smoking status, physical activity, education level, gastroesophageal reflux disease symptoms | 8 |
| Ibiebele et al | 2011 | PB | Case–control | Australian | EAC | VB3 | FFQ | 0.71 (0.52–0.96) | 515 (143) | Age, gender, education, BMI, alcohol intake, smoking status, energy intake, NSAID use | 8 |
| ESCC | VB3 | FFQ | 0.69 (0.43–1.12) | 421 (49) | Age, gender, education, BMI, alcohol intake, smoking status, energy intake, NSAID use | 8 | |||||
| Mayne et al | 2001 | PB | Case–control | US | EAC | VB3 | FFQ | 1.07 (0.77–1.48) | 969 (282) | Age, gender, site, race, proxy status, income, education, BMI, smoking status, alcohol, energy intake | 8 |
| ESCC | VB3 | FFQ | 0.74 (0.48–1.16) | 893 (206) | Age, gender, site, race, proxy status, income, education, BMI, smoking status, alcohol, energy intake | 8 | |||||
| Zhang et al | 1997 | HB | Case–control | US | EAC | VB3 | FFQ | 0.20 (0.10–0.70) | 44 (13) | NR | 6 |
| Chen et al | 2009 | PB | Case–control | US | EAC | VB3 | Validated HHHQ | 0.80 (0.40–1.50) | 573 (124) | Age, gender, respondent type, BMI, alcohol intake, tobacco use, education level, family history, vitamin supplement use | 8 |
| Jessri et al | 2011 | HB | Case–control | Iran | ESCC | VB5 | FFQ | 0.49 (0.35–2.08) | 144 (48) | Age, gender, energy intake, BMI, smoking status, physical activity, education level, gastroesophageal reflux disease symptoms | 8 |
| Sharp et al | 2013 | PB | Case–control | Ireland | EAC | VB6 | FFQ | 0.37 (0.22–0.63) | 142 (46) | Age, gender, total energy intake | 9 |
| Jessri et al | 2011 | HB | Case–control | Iran | ESCC | VB6 | FFQ | 0.17 (0.05–0.91) | 145 (49) | Age, gender, energy intake, BMI, smoking status, physical activity, education level, gastroesophageal reflux disease symptoms | 8 |
| Ibiebele et al | 2011 | PB | Case–control | Australian | EAC | VB6 | FFQ | 0.53 (0.39–0.74) | 517 (146) | Age, gender, education, BMI, alcohol intake, smoking status, energy intake, NSAID use | 8 |
| ESCC | VB6 | FFQ | 0.66 (0.42–1.05) | 423 (52) | Age, gender, education, BMI, alcohol intake, smoking status, energy intake, NSAID use | 8 | |||||
| Xiao et al | 2014 | PB | cohort | US | ESCC | VB6 | FFQ | 0.86 (0.51–1.45) | 4,471,303 (25) | Age, gender, race, education, marital status, health status, BMI, smoking status, alcohol, vigorous physical activity, multivitamin use, family history of cancer, energy intake | 7 |
| EAC | VB6 | FFQ | 1.00 (0.76–1.32) | 4,471,303 (98) | Age, gender, race, education, marital status, health status, BMI, smoking status, alcohol, vigorous physical activity, multivitamin use, family history of cancer, energy intake | 7 | |||||
| Mayne et al | 2001 | PB | Case–control | US | EAC | VB6 | FFQ | 0.53 (0.38–0.73) | 969 (282) | Age, gender, site, race, proxy status, income, education, BMI, smoking status, alcohol, energy intake | 8 |
| ESCC | VB6 | FFQ | 0.45 (0.30–0.69) | 893 (206) | Age, gender, site, race, proxy status, income, education, BMI, smoking status, alcohol, energy intake | 8 | |||||
| Fanidi et al | 2014 | PB | Nested Case–control | European | ESCC | VB6 | Serum | 2.26 (1.06–4.84) | 257 (128) | Age, gender, country, educational attainment, smoking status, alcohol intake | 8 |
| EAC | VB6 | Serum | 0.63 (0.30–1.33) | 270 (16) | Age, gender, country, educational attainment, smoking status, alcohol intake | 8 | |||||
| Galeone et al | 2006 | HB | Case–control | Italy and Swiss | ESCC | VB6 | FFQ | 0.99 (0.60–1.31) | 405 (108) | Age, center, education, BMI, smoking, alcohol drinking | 7 |
| Zhang et al | 1997 | HB | Case–control | US | EAC | VB6 | FFQ | 0.20 (0.10–0.70) | 44 (13) | NR | 6 |
| Chen et al | 2009 | PB | Case–control | US | EAC | VB6 | Validated HHHQ | 0.7 (0.30–1.30) | 573 (124) | Age, gender, respondent type, BMI, alcohol intake, tobacco use, education level, family history, vitamin supplement use | 8 |
| Ling | 2013 | PB | Case–control | China | ESCC | VB9 | Serum | 0.11 (0.04–0.33) | 48 (6) | Age, gender, smoking habit, drinking | 8 |
| Sharp et al | 2013 | PB | Case–control | Ireland | EAC | VB9 | FFQ | 0.52 (0.30–0.89) | 136 (55) | Age, gender, total energy intake | 8 |
| Zhao et al | 2011 | HB | Case–control | China | ESCC | VB9 | FFQ | 0.61 (0.36–1.07) | 174 (52) | Age, gender | 6 |
| Jessri et al | 2011 | HB | Case–control | Iran | ESCC | VB9 | FFQ | 0.08 (0.02–0.90) | 144 (48) | Age, gender, energy intake, BMI, smoking status, physical activity, education level, gastroesophageal reflux disease symptoms | 8 |
| Chang et al | 2015 | PB | Case–control | China | EC | VB9 | Plasma | 1.58 (0.95–2.64) | 178 (75) | Age, gender, BMI, education, smoking status, alcohol drinking frequency | 8 |
| Ibiebele et al | 2011 | PB | Case–control | Australian | EAC | VB9 | FFQ | 0.72 (0.53–0.98) | 491 (117) | Age, gender, education, BMI, alcohol intake, smoking status, energy intake, NSAID use | 8 |
| ESCC | VB9 | FFQ | 0.78 (0.51–1.19) | 430 (56) | Age, gender, education, BMI, alcohol intake, smoking status, energy intake, NSAID use | 8 | |||||
| Aune et al | 2011 | HB | Case–control | Uruguay | EC | VB9 | FFQ | 0.29 (0.14–0.60) | 2,102 (70) | Age, gender, residence, education, income, interviewer, smoking status, alcohol, dietary fiber, iron, BMI, energy intake | 7 |
| Xiao et al | 2014 | PB | cohort | US | ESCC | VB9 | FFQ | 1.07 (0.59–1.94) | 4471303 (21) | Age, gender, race, education, marital status, health status, BMI, smoking status, alcohol, vigorous physical activity, multivitamin use, family history of cancer, energy intake | 7 |
| EAC | VB9 | FFQ | 1.00 (0.76–1.31) | 4471303 (98) | Age, gender, race, education, marital status, health status, BMI, smoking status, alcohol, vigorous physical activity, multivitamin use, family history of cancer, energy intake | 7 | |||||
| Mayne et al | 2001 | PB | Case–control | US | EAC | VB9 | FFQ | 0.48 (0.36–0.66) | 969 (282) | Age, gender, site, race, proxy status, income, education, BMI, smoking status, alcohol, energy intake | 8 |
| ESCC | VB9 | FFQ | 0.58 (0.39–0.86) | 893 (206) | Age, gender, site, race, proxy status, income, education, BMI, smoking status, alcohol, energy intake | 8 | |||||
| Bao et al | 2013 | PB | Case–control | China | ESCC | VB9 | Serum | 0.43 (0.29–0.62) | 212 (106) | Age, gender, site | 7 |
| Fanidi et al | 2014 | PB | Nested case–control | European | ESCC | VB9 | Serum | 1.03 (0.47–2.24) | 255 (126) | Age, gender, country, educational attainment, smoking status, alcohol intake | 8 |
| EAC | VB9 | Serum | 1.68 (0.79–3.56) | 274 (26) | Age, gender, country, educational attainment, smoking status, alcohol intake | 8 | |||||
| Galeone et al | 2006 | HB | Case–control | Italy and Swiss | ESCC | VB9 | FFQ | 0.68 (0.46–1.00) | 404 (90) | Age, center, education, BMI, smoking, alcohol drinking | 7 |
| Tavani et al | 2012 | HB | Case–control | Italy | EC | VB9 | FFQ | 0.26 (0.14–0.48) | 443 (128) | Age, gender, study center, year of interview, education, alcohol drinking, tobacco smoking, BMI, energy intake, physical activity | 6 |
| Bollschweil et al | 2002 | PB | Case–control | Germany | EAC | VB9 | FFQ | 5.00 (2.10–13.60) | 38 (25) | NR | 6 |
| ESCC | VB9 | FFQ | 3.20 (1.30–9.10) | 29 (16) | NR | 6 | |||||
| Zhang et al | 1997 | HB | Case–control | US | EAC | VB9 | FFQ | 0.70 (0.30–1.70) | 49 (18) | NR | 6 |
| Qin et al | 2008 | HB and PB | Case–control | China | EC | VB9 | FFQ | 0.52 (0.33–0.82) | 360 (120) | NR | 5 |
| Brown et al | 1988 | HB | Case–control | US | EC | VB9 | FFQ | 0.70 (0.40–1.30) | 629 (207) | Smoking status, alcohol intake | 6 |
| Chen et al | 2009 | PB | Case–control | US | EAC | VB9 | HHHQ | 0.50 (0.30–1.00) | 573 (124) | Age, gender, respondent type, BMI, alcohol intake, tobacco use, education level, family history, vitamin supplement use | 8 |
| Yang et al | 2005 | HB | Case–control | Japan | EC | VB9 | SQFFQ | 0.77 (0.45–1.31) | 270 (62) | Smoking status, alcohol intake, total energy intake | 6 |
| Sharp et al | 2013 | PB | Case–control | Ireland | EAC | VB12 | FFQ | 3.87 (2.22–6.73) | 124 (81) | Age, gender, total energy | 8 |
| Jessri et al | 2011 | HB | Case–control | Iran | ESCC | VB12 | FFQ | 1.33 (0.60–3.03) | 143 (47) | Age, gender, energy intake, BMI, smoking status, physical activity, education level, gastroesophageal reflux disease symptoms | 8 |
| Chang et al | 2015 | PB | Case–control | China | EC | VB12 | Plasma | 3.07 (1.73–5.45) | 195 (93) | Age, gender, BMI, education, smoking status, alcohol drinking frequency | 8 |
| Ibiebele et al | 2011 | PB | Case–control | Australian | EAC | VB12 | FFQ | 0.96 (0.71–1.30) | 528 (155) | Age, gender, education, BMI, alcohol intake, smoking status, energy intake, NSAID use | 8 |
| ESCC | VB12 | FFQ | 0.89 (0.58–1.32) | 438 (65) | Age, gender, education, BMI, alcohol intake, smoking status, energy intake, NSAID use | 8 | |||||
| Xiao et al | 2014 | PB | cohort | US | ESCC | VB12 | FFQ | 0.85 (0.52–1.41) | 4471303 (28) | Age, gender, race, education, marital status, health status, BMI, smoking status, alcohol, vigorous physical activity, multivitamin use, family history of cancer, energy intake | 7 |
| EAC | VB12 | FFQ | 1.04 (0.80–1.34) | 4471303 (123) | Age, gender, race, education, marital status, health status, BMI, smoking status, alcohol, vigorous physical activity, multivitamin use, family history of cancer, energy intake | 7 | |||||
| Mayne et al | 2001 | PB | Case–control | US | EAC | VB12 | FFQ | 1.39 (1.10–1.76) | 969 (282) | Age, gender, site, race, proxy status, income, education, BMI, smoking status, alcohol, energy intake | 8 |
| ESCC | VB12 | FFQ | 1.51 (1.15–2.00) | 893 (206) | Age, gender, site, race, proxy status, income, education, BMI, smoking status, alcohol, energy intake | 8 | |||||
| Fanidi et al | 2014 | PB | Nested case–control | European | ESCC | VB12 | Serum | 1.07 (0.51–2.23) | 274 (145) | Age, gender, country, educational attainment, smoking status, alcohol intake | 8 |
| EAC | VB12 | Serum | 1.17 (0.56–2.44) | 298 (18) | Age, gender, country, educational attainment, smoking status, alcohol intake | 8 | |||||
Abbreviations: BMI, body mass index; EAC, esophageal adenocarcinoma; EC, esophageal carcinoma; ESCC, esophageal squamous cell carcinoma; HB, hospital-based; N/A, not available; NR, not reported; NSAID, nonsteroidal anti-inflammatory drug; PB, population-based; VB, vitamin B; FFQ, food frequency questionnaires; HHQ, health habits and history questionnaires.
Table 2.
Characteristics of studies on B vitamin intake
| Author | Year | Vitamin B | Exposure ascertainment | Highest vs lowest category |
|---|---|---|---|---|
|
| ||||
| Jessri et al | 2011 | VB1 | FFQ | – |
| Ibiebele et al | 2011 | VB1 | FFQ | 0.4–1.5 vs 2.1–5.8 (mg/d) |
| VB1 | FFQ | 0.4–1.5 vs 2.1–5.8 (mg/d) | ||
| Mayne et al | 2001 | VB1 | FFQ | – |
| VB1 | FFQ | – | ||
| Zhang et al | 1997 | VB1 | FFQ | – |
| Brown et al | 1988 | VB1 | FFQ | – |
| Sharp et al | 2013 | VB2 | FFQ | ≤1.8 vs ≥2.8 mg (mg/d) |
| Jessri et al | 2011 | VB2 | FFQ | – |
| Ibiebele et al | 2011 | VB2 | FFQ | 0.5–1.8 vs 2.7–7.1 (mg/d) |
| VB2 | FFQ | 0.5–1.8 vs 2.7–7.1 (mg/d) | ||
| Mayne et al | 2001 | VB2 | FFQ | – |
| VB2 | FFQ | – | ||
| Bao et al | 2013 | VB2 | Serum | <2,401.86 vs >2845.42 (μg/L) |
| Fanidi et al | 2014 | VB2 | Serum | 2.5–9.4 vs 21.4–199 (nmol/L) |
| VB2 | Serum | 2.5–9.4 vs 21.4–199 (nmol/L) | ||
| Zhang et al | 1997 | VB2 | Food records | – |
| Chen et al | 2009 | VB2 | Validated HHHQ | – |
| Jessri et al | 2011 | VB3 | FFQ | – |
| Ibiebele et al | 2011 | VB3 | FFQ | 28–50 mg |
| VB3 | FFQ | 28–50 mg | ||
| Mayne et al | 2001 | VB3 | FFQ | – |
| VB3 | FFQ | – | ||
| Zhang et al | 1997 | VB3 | FFQ | – |
| Chen et al | 2009 | VB3 | Validated HHHQ | – |
| Jessri et al | 2011 | VB5 | FFQ | – |
| Sharp et al | 2013 | VB6 | FFQ | ≤2.3 vs ≥3.2 (mg/d) |
| Jessri et al | 2011 | VB6 | FFQ | – |
| Ibiebele et al | 2011 | VB6 | FFQ | 0.3–1.1 vs 1.5–3.0 (mg/d) |
| VB6 | FFQ | 0.3–1.1 vs 1.5–3.0 (mg/d) | ||
| Xiao et al | 2014 | VB6 | FFQ | – |
| VB6 | FFQ | – | ||
| Mayne et al | 2001 | VB6 | FFQ | – |
| VB6 | FFQ | – | ||
| Fanidi et al | 2014 | VB6 | Serum | 7.2–25.6 vs 47.7–272 (nmol/L) |
| VB6 | Serum | 7.2–25.6 vs 47.7–272 (nmol/L) | ||
| Galeone et al | 2006 | VB6 | FFQ | – |
| Zhang et al | 1997 | VB6 | FFQ | – |
| Chen et al | 2009 | VB6 | Validated HHHQ | – |
| Ling | 2013 | VB9 | Serum | <17.04 vs >34.19 (μg/L) |
| Sharp et al | 2013 | VB9 | FFQ | ≤318 vs ≥421 (μg/d) |
| Zhao et al | 2011 | VB9 | FFQ | <230 vs >300 (μg/d) |
| Jessri et al | 2011 | VB9 | FFQ | – |
| Chang et al | 2015 | VB9 | Plasma | ≤8.90 vs >17.66 (nmol/L) |
| Ibiebele et al | 2011 | VB9 | FFQ | 42–230 vs 336–673 (μg/d) |
| VB9 | FFQ | 42–230 vs 336–673 (μg/d) | ||
| Aune et al | 2011 | VB9 | FFQ | – |
| Xiao et al | 2014 | VB9 | FFQ | – |
| VB9 | FFQ | – | ||
| Mayne et al | 2001 | VB9 | FFQ | – |
| VB9 | FFQ | – | ||
| Bao et al | 2013 | VB9 | Serum | <28.27 vs >35.06 (μg/L) |
| Fanidi et al | 2014 | VB9 | Serum | 0.3–9.1 to −18.2–109 (nmol/L) |
| VB9 | Serum | 0.3–9.1 to −18.2–109 (nmol/L) | ||
| Galeone et al | 2006 | VB9 | FFQ | – |
| Tavani et al | 2012 | VB9 | FFQ | <208.77 vs >312.47 (μg/d) |
| Bollschweiler et al | 2002 | VB9 | FFQ | 0–164 (μg/d) |
| VB9 | FFQ | 0–164 (μg/d) | ||
| Zhang et al | 1997 | VB9 | FFQ | – |
| Qin et al | 2008 | VB9 | FFQ | – |
| Brown et al | 1988 | VB9 | FFQ | – |
| Chen et al | 2009 | VB9 | HHHQ | – |
| Yang et al | 2005 | VB9 | SQFFQ | <300 vs >400 (μg/d) |
| Sharp et al | 2013 | VB12 | FFQ | ≤6.4 vs ≥9.7 (μg/d) |
| Jessri et al | 2011 | VB12 | FFQ | – |
| Chang et al | 2015 | VB12 | Plasma | ≤154.23 vs >324.06 (pmol/L) |
| Ibiebele et al | 2011 | VB12 | FFQ | 0–1.1 vs 2.1–7.8 (μg/d) |
| VB12 | FFQ | 0–1.1 vs 2.1–7.8 (μg/d) | ||
| Xiao et al | 2014 | VB12 | FFQ | – |
| VB12 | FFQ | – | ||
| Mayne et al | 2001 | VB12 | FFQ | – |
| VB12 | FFQ | – | ||
| Fanidi et al | 2014 | VB12 | Serum | 75.1–265 vs 392–2,737 (pmol/L) |
| VB12 | Serum | 75.1–265 vs 392–2,737 (pmol/L) | ||
Abbreviations: VB, vitamin B; FFQ, food frequency questionnaires; HHHQ, health habits and history questionnaires; SQFFQ, semi-quantitative food frequency questionnaires.
The quality of all studies was assessed by using the NOS scale. The overall methodological quality of articles is presented in Table 1. Overall, eleven studies had a score of 8,26,27,30,32,33,35–40 four had a score of 7,8,9,34,42 and the remaining studies had a score of 6.28,29,36,37,39,41
Multivitamin B intake
Our results showed a statistically significant inverse association between use of multivitamin B supplements and EC (OR=0.70; 95% CI: 0.59–0.83). There was statistically significant heterogeneity among all the studies (I2=77.9%; P=0.00).
Subgroup analysis of the source of the control group
Subgroup analysis of the source of the control group showed that dietary vitamin B was a protective factor for EC in both subgroups (hospital-based: OR=0.575, 95% CI: 0.492–0.672; population-based: OR=0.868, 95% CI: 0.820–0.919).
Subgroup analysis of EC pathological types
Subgroup analysis based on EC pathological types showed that dietary vitamin B was protective against esophageal squamous cell carcinoma (OR=0.762, 95% CI: 0.697–0.833) and esophageal adenocarcinoma (OR=0.870, 95% CI: 0.811–0.933).
Vitamin B1 intake
The association between vitamin B1 intake and EC risk was examined in seven case–control studies. The multivariable adjusted ORs for each study and combination of all studies for the highest vs lowest level of dietary vitamin B1 intake are shown in Figure 2. The pooled OR of EC for the highest vs lowest level of vitamin B1 intake was 0.68 (95% CI: 0.56–0.82). No heterogeneity was detected (I2=0.0%, P=0.432). It was not possible to perform dose–response meta-analyses due to limited data.
Figure 2.

Forest plot between highest vs lowest categories of vitamin B1 intake and EC risk.
Abbreviation: EC, esophageal cancer.
Vitamin B2 intake
We did not observe a statistically significant association for vitamin B2 supplements and EC risk (Figure 3, OR=0.86; 95% CI: 0.64–1.16) based on eleven studies. There was statistically significant heterogeneity among the studies on dietary vitamin B2 intake (I2=70.2%; P<0.001).
Figure 3.

Forest plot between highest vs lowest categories of vitamin B2 intake and esophageal cancer risk.
Abbreviation: ES, esophageal squamous carcinoma.
Vitamin B3 intake
As shown in Figure 4, seven studies examined the association between vitamin B3 intake and EC risk. The pooled OR for the highest vs lowest vitamin B3 intake was 0.70 (95% CI: 0.53–0.94, I2=53.9%, P=0.043). Dose–response meta-analyses were not done due to data limitations.
Figure 4.

Forest plot between highest vs lowest categories of vitamin B3 intake and esophageal cancer risk.
Abbreviation: ES,.
Vitamin B5 intake
There was only one study which showed the association between vitamin B5 intake and EC risk (OR=0.49, 95% CI:0.20–1.20), suggesting that vitamin B5 intake was not significantly associated with the risk of EC.
Vitamin B6 intake
A total of 13 studies assessed the association between dietary vitamin B6 intake and EC risk. Figure 5 shows that the pooled OR of EC risk for the highest vs the lowest categories of vitamin B6 intake was 0.64 (95% CI: 0.49–0.83, I2=73.0%, P=0.00), indicating that vitamin B6 intake had a protective effect against EC risk. For an increase of 100 µg/day of dietary vitamin B6 intake, a statistically significant, inverse association with EC risk (OR=0.98, 95% CI: 0.98–0.99) was detected.
Figure 5.

Forest plot between highest vs lowest categories of vitamin B6 intake and esophageal cancer risk.
Abbreviation: ES,.
Vitamin B9 intake
The association between dietary folate intake and EC risk was examined in 15 studies. The multivariable adjusted ORs for each study and combination of all studies for the highest vs lowest level of dietary folate intake are shown in Figure 6. The pooled OR of EC for the highest vs lowest level of dietary folate intake was 0.63 (95% CI: 0.56–0.71). There was statistically significant heterogeneity among the studies on dietary folate intake (I2=70.2%; P=0.00). Dose–response meta-analysis was based on seven studies. A statistically significant, inverse association was observed for an increase of 100 µg/day in supplemental vitamin B9 and EC risk (OR=0.89; 95% CI: 0.86–0.94).
Figure 6.

Forest plot between highest vs lowest categories of vitamin B9 intake and esophageal cancer risk.
Abbreviation: ES,.
Vitamin B12 intake
Inconsistent associations were observed for use of vitamin B12 supplements and EC risk in our study (OR=1.34, 95% CI: 1.05–1.70). Heterogeneity was high (I2=73.6%, P=0.00), as shown in Figure 7. Using restricted cubic spline function, we found a potential non-linear dose–response association between dietary vitamin B12 intake and EC risk (Pnon-linearity=0.0001) (Figure 8). The non-linear curve showed that there was a dose–response association between vitamin B12 dose and decreased risk of EC approximately below 5.5 µg/day, whereas the EC risk did not decrease further above 5.5 µg/day.
Figure 7.

Forest plot between highest vs lowest categories of vitamin B12 intake and esophageal cancer risk.
Abbreviation: ES,.
Figure 8.
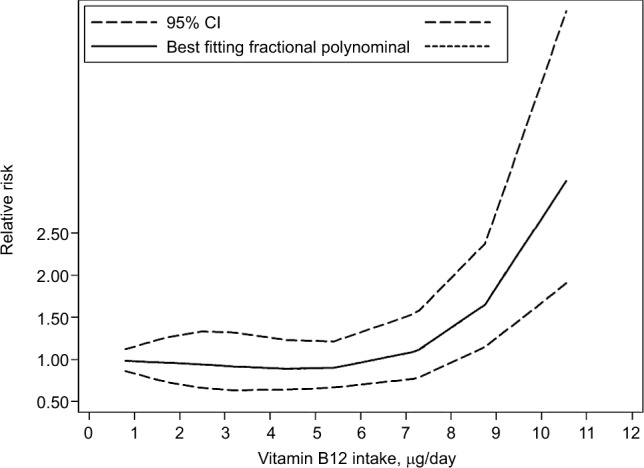
Non-linear dose–response analysis on vitamin B12 intake and esophageal cancer risk.
Publication bias
Publication bias was evaluated by Egger’s24 and Begg’s tests.25 The results disclosed no evidence of publication bias for EC (Egger: t=0.38, P=0.575; Begg: z=1.34 P=0.179).
Sensitivity analysis
As a result, a sensitivity analysis of multivitamin B intake was conducted, and after each study was sequentially excluded from the pooled analysis, the conclusion was not affected by exclusion of any specific study.
Discussion
Epidemiological investigations have suggested that there are significant relationships between diet-associated factors and EC. B vitamins may be one factor. Because some B vitamins cannot be synthesized in the human body, they can only be obtained through dietary. Fruit and vegetables are important dietary sources of some B vitamins. The reason why vitamin B affects the risk of cancer may be because it is essential for the biosynthesis of nucleotides, replication of DNA, supply of methyl groups, and the growth and repair of cells.43–46
In the present review, there was no epidemiologic research that assessed the association between total B vitamin consumption and EC risk among people. There were only studies which evaluated the relationship between several subclasses of B vitamins and EC risk. Thus, this study is the most comprehensive meta-analysis providing evidence to indicate these results. We found that total vitamin B intake was significantly associated with reduced EC risk. In addition, we evaluated the potential association of vitamin B subclasses and EC risk, respectively. In the subgroup analysis, we found that vitamin B1, B3, B6, and B9 may be protective factors, but vitamin B12, in contrast, was positively associated with risk of EC.
Previous studies have shown that consuming large quantities of vegetables, fruit, vitamins, and antioxidants can reduce the risk of EC.47–49 One potential reason for vitamin B12 being different from other B vitamins may be because it is derived exclusively from foods of animal origin, and it is simply a marker for consumption of animal protein. In previous studies, the risk of adenocarcinomas of the esophagus was linked to high-fat diets50,51 because esophageal adenocarcinoma generally arises from Barrett’s epithelium.52 Additionally, research has shown that diets low in animal protein and rich in fruit, vegetables, and fiber can reduce the risk of malignant transformation.33,47
B-group vitamin supplementation may have antioxidant and anti-inflammatory effects.53,54 The biological mechanisms responsible for the protective effect of high-dosage vitamin B are unclear. One possible explanation is that B vitamins and additional nutrients sourced from fruit and vegetables are involved in the one-carbon metabolism.55–57 The metabolic pathway of one-carbon metabolism has been frequently implicated in carcinogenesis, because of its involvement in maintaining nucleotide biosynthesis and methylation reactions. Imbalances and deficiencies among crucial one-carbon metabolism nutrients may interfere with DNA replication, DNA repair, and regulation of gene expression, any of which could promote carcinogenesis.58,59 Like the vitamin B3, vitamin B6 and vitamin B9, they are indispensable in the biosynthesis of four bases of DNA (thymidine, guanine, adenine, and cytosine). Deficiency of one or more of the three vitamins required for DNA maintenance is known to cause abnormal pairing of the four bases, which can then result in mutations and the development of cancer.60 Intake of vitamin B6 was reported to increase immunoglobulin G and T4(helper) lymphocytes in humans.61 Folate deficiency was suggested to be related to increased carcinogenesis, an effect that may be mediated through participation in methyl metabolism.62
Limitations
There were some limitations in our study that should be addressed. First, most studies included in our analysis were case–control studies, which may have caused recall bias, and could have caused potential heterogeneity, although the methodological quality of these observational studies was medium to high. More prospective cohort studies are needed to test this association. Second, it was a challenge to evaluate the quantity of vitamin B intake accurately because vitamin B can be sourced from various food types, and may be influenced by the type of cultivation, crop variety and location, as well as the specific morphological part of the plant eaten.
In conclusion, results from the present meta-analysis indicate that vitamin B intake is inversely associated with EC risk.
Conclusion
Our findings support that vitamin B may have an influence on carcinogenesis of the esophagus. Vitamin B1, B3, B6, and B9 showed a decreased risk of EC, vitamin B12 showed an increased risk of EC. (It is clear that scientists must apply the very best science in characterizing the safety of vitamin supplements.)
Acknowledgments
This work was funded by the MiaoPu Foundation of Henan Cancer Hospital.
Footnotes
Disclosure
The authors report no conflicts of interest in this work.
References
- 1.Ferlay J, Soerjomataram I, Dikshit R, et al. Cancer incidence and mortality worldwide: sources, methods and major patterns in GLOBOCAN 2012. Int J Cancer. 2015;136(5):E359–E386. doi: 10.1002/ijc.29210. [DOI] [PubMed] [Google Scholar]
- 2.Di Pardo BJ, Bronson NW, Diggs BS, Thomas CR, Jr, Hunter JG, Dolan JP. The Global Burden of Esophageal Cancer: A Disability-Adjusted Life-Year Approach. World J Surg. 2016;40(2):395–401. doi: 10.1007/s00268-015-3356-2. [DOI] [PubMed] [Google Scholar]
- 3.Boyle P, Levin B. World cancer report. Lyon, France: IARC Press; 2008. [Google Scholar]
- 4.Muñoz N. Epidemiological aspects of oesophageal cancer. Endoscopy. 1993;25(9):609–612. doi: 10.1055/s-2007-1010415. [DOI] [PubMed] [Google Scholar]
- 5.Wang JM, Xu B, Rao JY, Shen HB, Xue HC, Jiang QW. Diet habits, alcohol drinking, tobacco smoking, green tea drinking, and the risk of esophageal squamous cell carcinoma in the Chinese population. Eur J Gastroenterol Hepatol. 2007;19(2):171–176. doi: 10.1097/MEG.0b013e32800ff77a. [DOI] [PubMed] [Google Scholar]
- 6.Morita M, Kumashiro R, Kubo N, et al. Alcohol drinking, cigarette smoking, and the development of squamous cell carcinoma of the esophagus: epidemiology, clinical findings, and prevention. Int J Clin Oncol. 2010;15(2):126–134. doi: 10.1007/s10147-010-0056-7. [DOI] [PubMed] [Google Scholar]
- 7.Falk GW. Risk factors for esophageal cancer development. Surg Oncol Clin N Am. 2009;18(3):469–485. doi: 10.1016/j.soc.2009.03.005. [DOI] [PubMed] [Google Scholar]
- 8.Galeone C, Pelucchi C, Levi F, et al. Folate intake and squamous-cell carcinoma of the oesophagus in Italian and Swiss men. Ann Oncol. 2006;17(3):521–525. doi: 10.1093/annonc/mdj107. [DOI] [PubMed] [Google Scholar]
- 9.Aune D, Deneo-Pellegrini H, Ronco AL, et al. Dietary folate intake and the risk of 11 types of cancer: a case-control study in Uruguay. Ann Oncol. 2011;22(2):444–451. doi: 10.1093/annonc/mdq356. [DOI] [PubMed] [Google Scholar]
- 10.World Cancer Research Fund/American Institute for Cancer Research . Food, nutrition, physical activity and the prevention of cancer; A global perspective. Washington, DC: AICR; 2007. [Google Scholar]
- 11.Sanjoaquin MA, Allen N, Couto E, Roddam AW, Key TJ. Folate intake and colorectal cancer risk: A meta-analytical approach. Int J Cancer. 2005;113(5):825–828. doi: 10.1002/ijc.20648. [DOI] [PubMed] [Google Scholar]
- 12.Larsson SC, Giovannucci E, Wolk A. Folate intake, MTHFR polymorphisms, and risk of esophageal, gastric, and pancreatic cancer: a meta-analysis. Gastroenterology. 2006;131(4):1271–1283. doi: 10.1053/j.gastro.2006.08.010. [DOI] [PubMed] [Google Scholar]
- 13.Chainani-Wu N. Diet and oral, pharyngeal, and esophageal cancer. Nutr Cancer. 2002;44(2):104–126. doi: 10.1207/S15327914NC4402_01. [DOI] [PubMed] [Google Scholar]
- 14.Terry P, Lagergren J, Ye W, Nyrén O, Wolk A. Antioxidants and cancers of the esophagus and gastric cardia. Int J Cancer. 2000;87(5):750–754. [PubMed] [Google Scholar]
- 15.Tuyns AJ, Riboli E, Doornbos G, Péquignot G. Diet and esophageal cancer in Calvados (France) Nutr Cancer. 1987;9(2-3):81–92. doi: 10.1080/01635588709513915. [DOI] [PubMed] [Google Scholar]
- 16.Decarli A, Liati P, Negri E, Franceschi S, La Vecchia C. Vitamin A and other dietary factors in the etiology of esophageal cancer. Nutr Cancer. 1987;10(1-2):29–37. doi: 10.1080/01635588709513938. [DOI] [PubMed] [Google Scholar]
- 17.Nomura AM, Ziegler RG, Stemmermann GN, Chyou PH, Craft NE. Serum micronutrients and upper aerodigestive tract cancer. Cancer Epidemiol Biomarkers Prev. 1997;6(6):407–412. [PubMed] [Google Scholar]
- 18.Wells G, Shea B, O’Connell D, et al. The Newcastle-Ottawa Scale (NOS) for assessing the quality of nonrandomised studies in meta-analyses. Ottawa (ON): Ottawa Hospital Research Institute; 2009. [Accessed September 12, 2018]. Available from: http://www.ohri.ca/programs/ [Google Scholar]
- 19.Higgins JP, Green S. Cochrane Handbook for Systematic Reviews of Interventions, Version 5.1.0. 2011. [Accessed September 12, 2018]. Available from: https://training.cochrane.org/handbook.
- 20.Chak E, Rutherford GW, Steinmaus C. The role of breast-feeding in the prevention of Helicobacter pylori infection: a systematic review. Clin Infect Dis. 2009;48(4):430–437. doi: 10.1086/596499. [DOI] [PubMed] [Google Scholar]
- 21.Li Y, Yang H, Cao J. Association between Alcohol Consumption and Cancers in the Chinese Population—A Systematic Review and Meta-Analysis. PLoS One. 2011;6(4):e18776. doi: 10.1371/journal.pone.0018776. [DOI] [PMC free article] [PubMed] [Google Scholar]
- 22.Deeks JJ, Higgins JPT, Altman DG.Analyzing data and undertaking metaanalyses, Ch. 9 Higgins J, Oxford Green S, Cochrane Handbook for Systematic Reviews of Interventions 5.0.1 UK: The Cochrane Collaboration; 2008 [Google Scholar]
- 23.Higgins JPT, Thompson SG, Deeks JJ, Altman DG. Measuring inconsistency in meta-analyses. BMJ. 2003;327(7414):557–560. doi: 10.1136/bmj.327.7414.557. [DOI] [PMC free article] [PubMed] [Google Scholar]
- 24.Egger M, Smith GD, Schneider M, Minder C. Bias in meta-analysis detected by a simple, graphical test. BMJ. 1997;315(7109):629–634. doi: 10.1136/bmj.315.7109.629. [DOI] [PMC free article] [PubMed] [Google Scholar]
- 25.Begg CB, Mazumdar M. Operating characteristics of a rank correlation test for publication bias. Biometrics. 1994;50(4):1088–1101. [PubMed] [Google Scholar]
- 26.Bollschweiler E, Wolfgarten E, Nowroth T, Rosendahl U, Mönig S, Hölscher A. Vitamin intake and risk of subtypes of esophageal cancer in Germany. J Cancer Res Clin Oncol. 2002;128(10):575–580. doi: 10.1007/s00432-002-0380-z. [DOI] [PMC free article] [PubMed] [Google Scholar]
- 27.Huang GL, Wang SK, Su M, et al. Serum folate, MTHFR C677T Polymorphism and Esophageal Squamous Cell Carcinoma Risk. Biomed Environ Sci. 2013;26(12):1008–1012. doi: 10.3967/bes2013.039. [DOI] [PubMed] [Google Scholar]
- 28.Sharp L, Carsin AE, Cantwell MM, Anderson LA, Murray LJ, FINBAR Study Group Intakes of Dietary Folate and Other B Vitamins are Associated with Risks of Esophageal Adenocarcinoma, Barrett’s Esophagus, and Reflux Esophagitis. J Nutr. 2013;143(12):1966–1973. doi: 10.3945/jn.113.174664. [DOI] [PubMed] [Google Scholar]
- 29.Zhao P, Lin F, Li Z, Lin B, Lin J, Luo R. Folate intake, methylenetetra-hydrofolate reductase polymorphisms, and risk of esophageal cancer. Asian Pac J Cancer Prev. 2011;12(8):2019–2023. [PubMed] [Google Scholar]
- 30.Jessri M, Rashidkhani B, Hajizadeh B, Jessri M, Gotay C. Macronutrients, vitamins and minerals intake and risk of esophageal squamous cell carcinoma: a case-control study in Iran. Nutr J. 2011;20:10–137. doi: 10.1186/1475-2891-10-137. [DOI] [PMC free article] [PubMed] [Google Scholar]
- 31.Chang S-C, Goldstein BY, Mu L, et al. Plasma folate, vitamin B12, and homocysteine and cancers of the esophagus, stomach, and liver in a Chinese population. Nutr Cancer. 2015;67(2):212–223. doi: 10.1080/01635581.2015.989375. [DOI] [PMC free article] [PubMed] [Google Scholar]
- 32.Ibiebele TI, Hughes MC, Pandeya N, et al. Study of Digestive Health; Australian Cancer Study High intake of folate from food sources is associated with reduced risk of esophageal cancer in an Australian population. J Nutr. 2011;141:274–283. doi: 10.3945/jn.110.131235. [DOI] [PMC free article] [PubMed] [Google Scholar]
- 33.Mayne ST, Risch HA, Dubrow R, et al. Nutrient intake and risk of subtypes of esophageal and gastric cancer. Cancer Epidemiol Biomarkers Prev. 2001;10:1055–1062. [PubMed] [Google Scholar]
- 34.Bao L, Peng J, Huang G, et al. The study on the relationship between serum folic acid and vitamin B2 levels and esophageal cancer. Wei Sheng Yan Jiu. 2013;42(3):451–454. Chinese. [PubMed] [Google Scholar]
- 35.Fanidi A, Relton C, Ueland PM, et al. A prospective study of one-carbon metabolism biomarkers and cancer of the head and neck and esophagus. Int J Cancer. 2015;136(4):915–927. doi: 10.1002/ijc.29051. [DOI] [PubMed] [Google Scholar]
- 36.Tavani A, Malerba S, Pelucchi C, et al. Dietary folates and cancer risk in a network of case-control studies. Ann Oncol. 2012;23(10):2737–2742. doi: 10.1093/annonc/mds212. [DOI] [PubMed] [Google Scholar]
- 37.Zhang ZF, Kurtz RC, Yu GP. Adenocarcinomas of the esophagus and gastric cardia: The role of diet. Nutr Cancer. 1997;27(3):298–309. doi: 10.1080/01635589709514541. [DOI] [PubMed] [Google Scholar]
- 38.Qin JM, Wang XM, Chen B, et al. Study on the ingestion of folate and polymorphism of MTHFR C677T with esophageal cancer in Xinjiang Kazakh. Zhonghua Liu Xing Bing Xue Za Zhi. 2008;29(1):30–33. Chinese. [PubMed] [Google Scholar]
- 39.Brown LM, Blot WJ, Schuman SH, et al. Environmental factors and high risk of esophageal cancer among men in coastal South Carolina. J Natl Cancer Inst. 1988;80(20):1620–1625. doi: 10.1093/jnci/80.20.1620. [DOI] [PubMed] [Google Scholar]
- 40.Chen H, Tucker KL, Graubard BI, et al. Nutrient Intakes and Adenocarcinoma of the Esophagus and Distal Stomach. Nutr Cancer. 2002;42(1):33–40. doi: 10.1207/S15327914NC421_5. [DOI] [PubMed] [Google Scholar]
- 41.Yang C-X, Matsuo K, Ito H, et al. Gene–environment interactions between alcohol drinking and the MTHFR C677T polymorphism impact on esophageal cancer risk: results of a case–control study in Japan. Carcinogenesis. 2005;26(7):1285–1290. doi: 10.1093/carcin/bgi076. [DOI] [PubMed] [Google Scholar]
- 42.Xiao Q, Freedman ND, Ren J, Hollenbeck AR, Abnet CC, Park Y. Intakes of folate, methionine, vitamin B6 and vitamin B12 with risk of esophageal and gastric cancer in a large cohort study. Br J Cancer. 2014;110(5):1328–1333. doi: 10.1038/bjc.2014.17. [DOI] [PMC free article] [PubMed] [Google Scholar]
- 43.Smith AD, Kim YI, Refsum H. Is folic acid good for everyone? Am J Clin Nutr. 2008;87(3):517–533. doi: 10.1093/ajcn/87.3.517. [DOI] [PubMed] [Google Scholar]
- 44.Liu L, Wylie RC, Andrews LG, Tollefsbol TO. Aging, cancer and nutrition: the DNA methylation connection. Mech Ageing Dev. 2003;124(10-12):989–998. doi: 10.1016/j.mad.2003.08.001. [DOI] [PubMed] [Google Scholar]
- 45.Ebbing M, Bønaa KH, Nygård O, et al. Cancer incidence and mortality after treatment with folic acid and vitamin B12. JAMA. 2009;302(19):2119–2126. doi: 10.1001/jama.2009.1622. [DOI] [PubMed] [Google Scholar]
- 46.Zhou YH, Tang JY, Wu M, et al. Effect of folic acid supplementation on cardiovascular outcomes: a systematic review and meta-analysis. PLoS One. 2011;6(9):e25142. doi: 10.1371/journal.pone.0025142. [DOI] [PMC free article] [PubMed] [Google Scholar]
- 47.Navarro Silvera SA, Mayne ST, Gammon MD, et al. Diet and lifestyle factors and risk of subtypes of esophageal and gastric cancers: classification tree analysis. Ann Epidemiol. 2014;24(1):50–57. doi: 10.1016/j.annepidem.2013.10.009. [DOI] [PMC free article] [PubMed] [Google Scholar]
- 48.Brown LM, Swanson CA, Gridley G, et al. Adenocarcinoma of the Esophagus: Role of Obesity and Diet. J Natl Cancer Inst. 1995;87(2):104–109. doi: 10.1093/jnci/87.2.104. [DOI] [PubMed] [Google Scholar]
- 49.Palli D, Bianchi S, Decarli A, et al. A case-control study of cancers of the gastric cardia in Italy. Br J Cancer. 1992;65(2):263–266. doi: 10.1038/bjc.1992.52. [DOI] [PMC free article] [PubMed] [Google Scholar]
- 50.Kabat GC, Ng SK, Wynder EL. Tobacco, alcohol intake, and diet in relation to adenocarcinoma of the esophagus and gastric cardia. Cancer Causes Control. 1993;4(2):123–132. doi: 10.1007/BF00053153. [DOI] [PubMed] [Google Scholar]
- 51.Tzonou A, Lipworth L, Garidou A, et al. Diet and risk of esophageal cancer by histologic type in a low-risk population. Int J Cancer. 1996;68(3):300–304. doi: 10.1002/(SICI)1097-0215(19961104)68:3<300::AID-IJC6>3.0.CO;2-5. [DOI] [PubMed] [Google Scholar]
- 52.Kim R, Weissfeld JL, Reynolds JC, Kuller LH. Etiology of Barrett’s metaplasia and esophageal adenocarcinoma. Cancer Epidemiol Biomark Prev. 1997;6(5):369–377. [PubMed] [Google Scholar]
- 53.Ullegaddi R, Powers HJ, Gariballa SE. B-group vitamin supplementation mitigates oxidative damage after acute ischaemic stroke. Clin Sci (Lond) 2004;107(5):477–484. doi: 10.1042/CS20040134. [DOI] [PubMed] [Google Scholar]
- 54.Ullegaddi R, Powers HJ, Gariballa SE. Antioxidant supplementation with or without B-group vitamins after acute ischemic stroke: a randomized controlled trial. JPEN J Parenter Enteral Nutr. 2006;30(2):108–114. doi: 10.1177/0148607106030002108. [DOI] [PubMed] [Google Scholar]
- 55.Olsen A, Halkjær J, van Gils CH, et al. Dietary intake of the water-soluble vitamins B1, B2, B6, B12 and C in 10 countries in the European Prospective Investigation into Cancer and Nutrition. Eur J Clin Nutr. 2009;63(Suppl 4):S122–S149. doi: 10.1038/ejcn.2009.78. [DOI] [PubMed] [Google Scholar]
- 56.United States Department of Health and Human Services USDoA . Dietary Guidelines for Americans, U.S Dept. of Health and Human Services 2005. Washington DC: US Dept of Agriculture; 2005. [Google Scholar]
- 57.WCRF/AICR, Food, nutrition, physical activity and the prevention of cancer . A global perspective. USA: World Cancer Research Fund International; 2007. [Google Scholar]
- 58.Choi SW, Mason JB. Folate and carcinogenesis: an integrated scheme. J Nutr. 2000;130(2):129–132. doi: 10.1093/jn/130.2.129. [DOI] [PubMed] [Google Scholar]
- 59.Kim Y. Folate and carcinogenesis: evidence, mechanisms, and implications. J Nutr Biochem. 1999;10(2):66–88. doi: 10.1016/s0955-2863(98)00074-6. [DOI] [PubMed] [Google Scholar]
- 60.Folkers K. Relevance of the biosynthesis of coenzyme Q10 and of the four bases of DNA as a rationale for the molecular causes of cancer and a therapy. Biochem Biophys Res Commun. 1996;224(2):358–361. doi: 10.1006/bbrc.1996.1033. [DOI] [PubMed] [Google Scholar]
- 61.Folkers K, Morita M, McRee J., Jr The Activities of Coenzyme Q10 and Vitamin B6 for Immune Responses. Biochem Biophys Res Commun. 1993;193(1):88–92. doi: 10.1006/bbrc.1993.1593. [DOI] [PubMed] [Google Scholar]
- 62.Rogers AE. Methyl donors in the diet and responses to chemical carcinogens. Am J Clin Nutr. 1995;61(3 Suppl):659S–665S. doi: 10.1093/ajcn/61.3.659S. [DOI] [PubMed] [Google Scholar]