

Abstract
Hemoglobin mass (tHb) is a key determinant of maximal oxygen uptake (VO 2 max). We examined whether oxyhemoglobin desaturation (ΔS a O 2 ) at VO 2 max modifies the relationship between tHb and VO 2 max at moderate altitude (1,625 m). Seventeen female and 16 male competitive, endurance-trained moderate-altitude residents performed two tHb assessments and two graded exercise tests on a cycle ergometer to determine VO 2 max and ΔS a O 2 . In males and females respectively, VO 2 max (ml·kg −1 ·min −1 ) ranged from 62.5–83.0 and 44.5–67.3; tHb (g·kg −1 ) ranged from 12.1–17.5 and 9.1–13.0; and S a O 2 at VO 2 max (%) ranged from 81.7–94.0 and 85.7–95.0. tHb was related to VO 2 max when expressed in absolute terms and after correcting for body mass (r=0.94 and 0.86, respectively); correcting by ΔS a O 2 did not improve these relationships (r=0.93 and 0.83). Additionally, there was a negative relationship between tHb and S a O 2 at VO 2 max (r=–0.57). In conclusion, across a range of endurance athletes at moderate altitude, the relationship between tHb and VO 2 max was found to be similar to that observed at sea level. However, correcting tHb by ΔS a O 2 did not explain additional variability in VO 2 max despite significant variability in ΔS a O 2 ; this raises the possibility that tHb and exercise-induced ΔS a O 2 are not independent in endurance athletes.
Key words: endurance performance, oxygen transport, exercise-induced desaturation, hypoxia, altitude
Introduction
VO 2 max is a critical factor for endurance exercise performance because it sets the upper limit for aerobic metabolism 1 19 20 . The primary limitation of VO 2 max is the rate of oxygen delivery to the working muscle 1 24 ; many physiological parameters that influence oxygen delivery during exercise have been described previously 1 20 23 .
One parameter that influences VO 2 max is the total mass of hemoglobin in circulation (tHb) 35 . tHb influences VO 2 max both via its relationship with hemoglobin concentration ([Hb]) and arterial oxygen content (C a O 2 ) 35 , and via its relationship with total blood volume, venous return and ventricular filling, and maximal cardiac output 10 18 21 35 . However, tHb and [Hb] are not the only factors that influence C a O 2 ; arterial oxygen partial pressure and arterial oxygen saturation (S a O 2 ) also influence C a O 2 . During high-intensity exercise, S a O 2 can drop significantly in a variety of athletes; this condition is known as exercise-induced arterial desaturation (EIAD). When EIAD was initially described in the literature, it was thought that decreased arterial oxyhemoglobin concentration during exercise led to decreased C a O 2 . However, high-intensity exercise increases arterial blood temperature and can lead to plasma volume shifts and hemoconcentration; in individuals that do not experience EIAD, these changes can lead to an increase in C a O 2 during high-intensity exercise 36 , and therefore EIAD may simply prevent an increase in C a O 2 during high intensity 15 . Regardless, it is clear that EIAD has a detrimental effect on VO 2 max, because ameliorating EIAD by increasing the fraction of inspired oxygen from 21% to 26% leads to an increase in VO 2 max only in individuals with EIAD 15 .
At sea level, EIAD is uncommon in recreationally active subjects, but ~50% of elite endurance athletes experience some degree of EIAD 25 . As altitude increases, EIAD is exacerbated in all individuals 22 . There is also significant interindividual variability in the severity of EIAD experienced during exercise, even within groups of similarly trained athletes 12 26 . Therefore, assuming EIAD and tHb are independent, EIAD may influence the relationship between tHb and VO 2 max.
Although tHb and EIAD both influence oxygen delivery during exercise, to date there have been no studies looking at how these factors interact to influence VO 2 max. Therefore, the purpose of this study was to determine whether EIAD influences the relationship between tHb and VO 2 max in moderately to highly trained competitive male and female endurance athletes at moderate altitude (1,625 meters). Additionally, previous research has indicated that females may be more likely to experience EIAD than males due to anatomical differences 8 9 . However, direct comparisons of EIAD between competitive, endurance-trained male and female athletes are lacking. Therefore, a secondary aim of this study was to compare severity of EIAD at moderate altitude in men and women after taking into account aerobic capacity.
Methods
Subjects
Seventeen female and sixteen male competitive endurance-trained cyclists and triathletes residing at moderate altitude (1,500–2,000 meters) took part in this study. Subjects were required to maintain moderate-altitude residence throughout participation in the study, and testing occurred at 1,625 meters. Endurance-trained was defined as cycling, running, and/or swimming for more than 10 h per week for men and more than 8 h per week for women over the month prior to inclusion in the study. All subjects had participated in at least one discipline-specific competitive race in the previous calendar year. At the time of the first visit, males were required to hold at a minimum a USA Cycling Category 2 or USA triathlon license; females were required to hold at a minimum a USA Cycling Category 3 or USA triathlon license. Subjects were screened to ensure that they were between the ages of 18–42 years old, free from known cardio-respiratory disease as assessed by the Physical Activity Readiness Questionnaire (PAR-Q), had not donated blood in the previous 8 weeks, and were non-smokers. Subjects were not excluded from the study if they had participated in short sojourns to sea level (<7 days) in the 8 weeks prior to participation in the study, because hemoglobin mass has previously been shown to be stable for up to two weeks following descent to sea level in endurance-trained moderate-altitude residents 28 . Females were screened to ensure they were not pregnant or breast feeding, and all females undertook a urine hCG test prior to participating (AccuMed, USA).
Experimental design
Because duplicate measurements reduce the typical error of a measurement by √2 17 , measurements of all primary outcomes (tHb, VO 2 max, and S a O 2 ) were performed twice. On the first of four visits to the lab, written informed consent was obtained. In order to confirm that there were no changes in tHb throughout the study, visits one and four consisted of identical measurements of tHb, whereas visits two and three consisted of identical graded exercise tests (GXT) to measure maximal oxygen uptake and S a O 2 during exercise. All visits were separated by at least one day, and for each subject, GXTs were performed at the same time of day, plus or minus one hour. This study was conducted in accordance with the ethical standards of the International Journal of Sports Medicine 16 .
Total hemoglobin mass
Total hemoglobin mass was measured via the optimized carbon monoxide rebreathing procedure 27 34 as described previously 32 33 . Subjects were instructed to refrain from exercise for two hours preceding these visits due to the possible interactions between exercise and carboxyhemoglobin kinetics. For this study, the coefficient of variability was 2.7% (95% confidence interval: 2.2%– 3.7%).
Graded exercise test
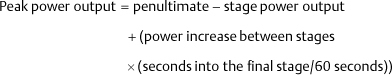
On visits two and three, subjects performed a maximal GXT on a cycle ergometer (Lode Excalibur Sport, Groningen, Netherlands). For these visits, subjects were instructed to arrive at the lab two hours postprandial, and were instructed to not consume alcohol or perform vigorous activity for 24 h prior to either GXT. Prior to the GXT, body mass was measured on a digital scale (Combics 1, Sartorius Weighing Technology, Göttingen, Germany) in cycling clothes and without shoes. Oxygen consumption and other metabolic parameters were measured via computerized open-circuit indirect calorimetry, which was calibrated according to the manufacturer’s specifications (TrueOne 2400, Parvo Medics, Sandy, UT, USA). Heart rate was measured using a heart rate monitor (Polar Electro, Kempele, Finland), and peripheral oxygen saturation was measured continuously via forehead pulse oximetry (Nellcor N-595, Medtronic, Minneapolis, MN, USA). Forehead pulse oximetry was chosen due to its ability to determine S a O 2 with relatively low bias and high precision compared to other non-invasive measurement options 37 . After five minutes of rest on the ergometer, baseline S a O 2 was measured for one minute. Each subject was then allowed a 10-min warm-up period during which the subject rode at a self-selected power not exceeding the power output of the first stage of the GXT. Following the warm-up period, the subject put on a nose clip and began breathing through the open-circuit spirometry system. The GXT began at an individualized power output of 4 W·kg −1 for males and 3 W·kg −1 for females, rounded down to the nearest 20 W increment, and increased 20 W every minute until subjects reached volitional exhaustion or until cadence could not be maintained above 60 RPM. This sex-specific protocol was used in order to elicit volitional exhaustion in this subject population in about 10–12 min, which has been reported to be an optimal duration for determining VO 2 max 4 . During each GXT, all subjects reached an RPE>17 and a HR max within 10% of age-predicted HR max . As previously described, VO 2 max was calculated as the highest 30-s average oxygen consumption; S a O 2 at VO 2 max was calculated as the average S a O 2 during the same 30 s used to determine VO 2 max 3 32 . Peak power output was calculated as described previously using the following equation 3 32 :
Mild, moderate, and severe EIAD were classified as a S a O 2 at VO 2 max between 93–95%, 88–93%, and<88%, respectively 7 . The coefficients of variation for VO 2 max and S a O 2 at VO 2 max using these duplicate measurements were 3.5% (95% confidence interval: 2.8–4.7%) and 1.4% (95% confidence interval: 1.2–1.8%), respectively.
Saturation-adjusted tHb
To determine how saturation influences the relationship between tHb and VO 2 max, saturation-adjusted tHb was calculated as sat-adj tHb = tHb · (S a O 2 at VO 2 max).
Statistics
To determine if there were differences between duplicate tests, dependent t-tests were used to compare measurements. In order to determine the degree of agreement between duplicate measurements, intraclass correlation coefficients were calculated; to assess the typical error of duplicate measurements, the coefficient of variation was calculated as a percent change 17 . To determine the relationship between tHb and VO 2 max, as well as the relationship between saturation-adjusted tHb and VO 2 max, simple linear regressions were performed. Linear regression models were compared using Williams t-test. To assess differences in S a O 2 at VO 2 max between sexes, multiple linear regression was performed with sex and VO 2 max as independent variables and S a O 2 at VO 2 max as the dependent variable. For all regression analyses, bivariate normality was assessed using Q-Q plots and Shapiro-Wilk tests on the residuals, homoscedasticity and linearity were assessed using scatter plots of normalized residuals, and autocorrelation was assessed using the Box-Pierce test. Unstandardized regression coefficients from linear models are reported using the symbol β. All analyses were performed in R, version 3.3.2 (R Core Team, Vienna, Austria), and alpha was set to 0.05. Trends were noted if 0.05< p <0.1. Results are represented as the mean±SD.
Results
Subject characteristics and measures of reliability between duplicate measures are given in Table 1 . Of the 33 subjects who participated, 32 completed all experimental procedures; one female subject was withdrawn due to illness after completing the first two visits, so her results represent only a single measurement of each parameter.
Table 1 Subject Characteristics and Measurement Variability.
| Male n=16 | Female n=17 | Coefficient of variation (%) | Intra-class correlation coefficient | |
|---|---|---|---|---|
| Age | 25.6±4.6 | 28.6±6.0 | – | – |
| Weekly Training Duration (hours) | 16.3±5.4 (Range: 10–30) | 13.5±4.1 (Range: 8.2–25) | – | – |
| Body Mass (kg) | 69.7±4.8 | 58.4±5.1 | 0.8 | 0.99 |
| Height (cm) | 182.1±4.1 | 165.5±5.1 | – | – |
| Absolute VO 2 max (L·min −1 ) | 5.12±0.45 | 3.22±0.43 | 3.5 | 0.99 |
| Normalized VO 2 max (mL·kg −1 ·min −1 ) | 73.4±5.4 | 55.2±5.9 | 3.5 | 0.96 |
| RER at VO 2 max | 1.05±0.05 | 1.07±0.06 | 1.4 | 0.86 |
| HR max | 184±9 | 185±11 | 2.0 | 0.85 |
| Peak Power Output (W) | 429±26 | 292±31 | 2.4 | 0.99 |
| S a O 2 at Rest (%) | 98.18±0.94 | 98.86±0.87 | 0.8 | 0.49 |
| S a O 2 at VO 2 max (%) | 88.8±3.1 | 92.0±2.8 | 1.4 | 0.86 |
| Desaturation from Rest (%) | 9.1±3.5 | 6.9±2.6 | 16.1 | 0.84 |
| Absolute tHb (g) | 977±102 | 647±100 | 2.7 | 0.99 |
| Normalized tHb (g·kg −1 ) | 14.0±1.3 | 11.1±1.3 | 2.7 | 0.99 |
Values are mean±SD. VO 2 max: Maximal oxygen uptake during graded exercise test; RER: Respiratory exchange ratio; HR max: maximum heart rate during graded exercise test; Peak Power Output: peak power output during graded exercise test; S a O 2 : arterial oxyhemoglobin saturation; tHb: total hemoglobin mass. Weekly training duration was calculated from self-reported hours of endurance training per week over the month preceding inclusion in study. tHb parameters are the average of two measurements, whereas all graded exercise test parameters (VO 2 max, RER at VO 2 max, HR max, Peak Power Output, S a O 2 at VO 2 max, and Desaturation from Rest) are taken from the 2 nd graded exercise test, because VO 2 max was significantly higher for this test.
There were no significant differences between tests for the following measures: tHb, body mass, S a O 2 at rest, S a O 2 at VO 2 max, desaturation from rest, maximum heart rate, maximum RER, peak power output, and maximum RPE (all p=N.S.). VO 2 max was significantly higher for the second GXT, both when expressed as L·min −1 (delta=0.064 L·min −1 , p=0.048) and when expressed as mL·min −1 ·kg −1 (delta=1.21 mL·min −1 ·kg −1 , p=0.02). The change in VO 2 max between trials was not different between males and females (p=N.S.). Although there was no significant difference in peak power output between tests, the difference in VO 2 max between tests was related to the difference in peak power output (p<0.001, r 2 =0.44), which indicates that there may have been a learning effect that took place between GXTs. The magnitude of the difference in VO 2 max between tests was small (<2%). To examine whether this difference influenced our conclusions, all further analyses were performed twice, once using results from the average of both GXTs, and once using results from only the second GXT. There were no differences in any conclusion regardless of which variables were used, and therefore all results are presented from the second GXT, includingVO 2 max, S a O 2 at VO 2 max, peak RER, and peak power output.
Exercise-induced arterial desaturation
At VO 2 max, the average desaturation from rest was 9.1±3.5% for males and 6.9±2.6% for females. In males, S a O 2 at VO 2 max ranged from 81.7% to 94.0%; in females S a O 2 at VO 2 max ranged from 85.7% to 95%. Overall, 94% of subjects experienced greater than 4% desaturation from rest (95% confidence interval: 80%–99%), with no statistical difference between men and women ( Table 2 ). S a O 2 at VO 2 max was negatively related to VO 2 max, both when expressed as an absolute (r=–0.58, p<0.001) and when normalized to body mass (r=–0.55, p<0.001). When split by sex, this relationship was observed only in the female cohort (for females, absolute: r=–0.59, p<0.05; normalized: r=–0.62, p<0.05). There was no significant difference in the severity of EIAD between males and females after accounting for VO 2 max (p=N.S.).
Table 2 Prevalence of Exercise-induced Arterial Desaturation.
| EIAD Severity | Male (%) n=16 | Female (%) n=17 |
|---|---|---|
| Mild | 12.5 [1–38] | 24 [7–50] |
| Moderate | 50 [25–75] | 53 [28–77] |
| Severe | 38 [15–65] | 12 [1–36] |
| Overall | 100 [79–100] | 88 [64–99] |
Values are presented as percent [95% confidence interval]. EIAD: exercise-induced arterial desaturation. Mild, moderate, and severe EIAD were classified as an S a O 2 at VO 2 max between 93–95%, 88–93%, and<88%, respectively 3 .
Relationship between tHb and VO 2 max
tHb was positively related to VO 2 max when both parameters were expressed as absolute values (β tHb =5.07; r 2 =0.88, p<0.001; Fig. 1a ) and when both parameters were normalized to body mass (β tHb =4.70; r 2 =0.73, p<0.001; Fig. 2a ). When split by sex, the magnitude of the correlation decreased, but similar relationships were observed in both males (absolute: r 2 =0.44, p<0.01; normalized: r 2 =0.32, p=0.02) and in females (absolute: r 2 =0.67, p<0.01; normalized: r 2 =0.42, p<0.01).
Fig. 1.
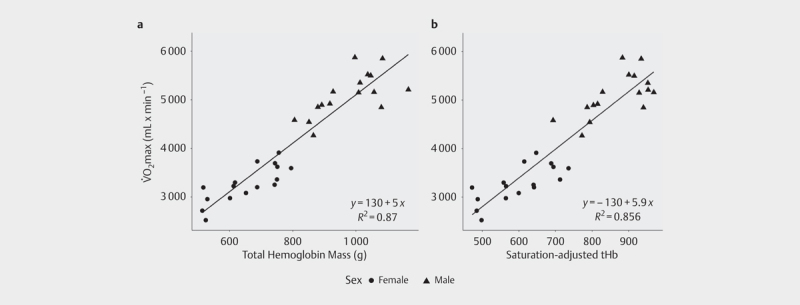
Relationship between VO 2 max and a absolute total hemoglobin mass (tHb); b total hemoglobin mass adjusted by arterial oxygen saturation during maximal aerobic exercise, without taking into account body mass. No significant difference was found between regressions (p=N.S.).
Fig. 2.
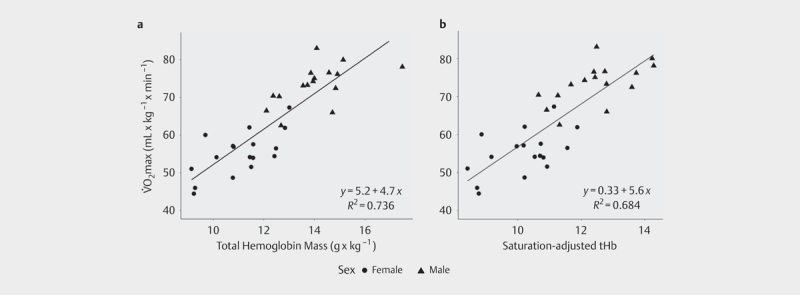
Relationship between VO 2 max normalized by body mass and a body mass-normalized total hemoglobin mass (tHb); b total hemoglobin mass adjusted by arterial oxygen saturation during maximal aerobic exercise, after normalizing by body mass. No significant difference was found between regressions (p=N.S.).
Saturation-adjusted tHb
When tHb was adjusted by S a O 2 at VO 2 max, this parameter was positively related to VO 2 max, both when expressed as absolute values (β=6.05; r 2 =0.87, p<0.001; Fig. 1b ) and when normalized to body mass (β=5.65; r 2 =0.68, p<0.01; Fig. 2b ). When compared to the model between tHb and VO 2 max, there was no significant difference between the amounts of explained variability, either for the absolute (p=N.S.; Fig. 1 ) or for the body mass normalized models (p=N.S.; Fig. 2 ).
tHb and S a O 2 at VO 2 max
Across all subjects, when tHb was normalized by body mass, it was negatively related to S a O 2 at maximal exercise (r 2 =0.32, p<0.001; Fig. 3 ). When split by sex, there was a trend for this relationship to show up in females (r 2 =0.22, p=0.06) but not males (r 2 =0.06, p=N.S.). After diagnostic testing of this model, this analysis was re-run after removing one male subject who exerted a high degree of influence on the original model. In the reduced data set, there was still a significant relationship between tHb and S a O 2 at VO 2 max (r 2 =0.202, p=0.01). A secondary analysis of this data revealed that when only subjects who experienced an S a O 2 at VO 2 max less than 91% were analyzed (which included 15 subjects), r 2 increased from 0.32 to 0.48 (p<0.01 for this model).
Fig. 3.
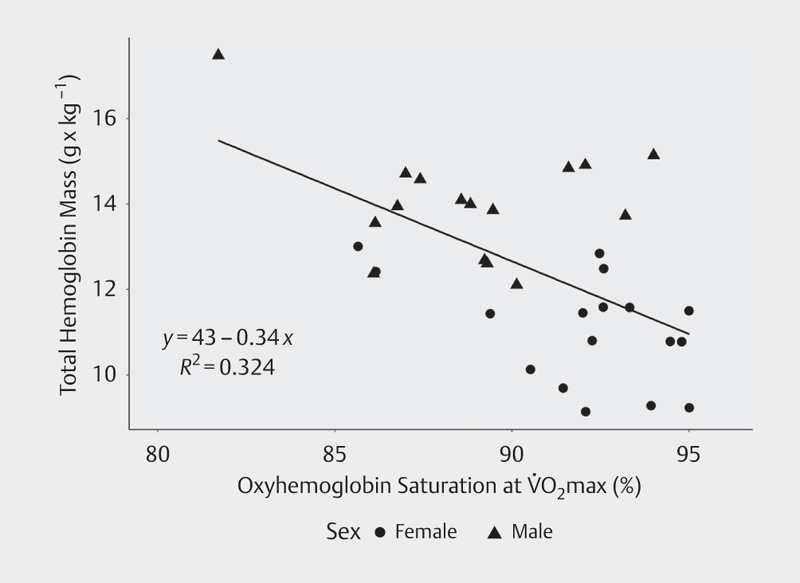
Relationship between S a O 2 at VO 2 max and total hemoglobin mass (r 2 =0.324, p<0.001).
Discussion
The primary findings from this study are that 1) adjusting tHb by S a O 2 at VO 2 max did not improve the amount of explained variability in VO 2 max, and 2) after correcting for aerobic capacity, there was no difference in severity of EIAD between males and females. Additionally, we found that tHb was negatively related to S a O 2 at VO 2 max.
The finding that S a O 2 at VO 2 max did not explain additional variability in the relationship between tHb and VO 2 max was contrary to our hypothesis. This was despite a high prevalence of EIAD and a large range of observed desaturation values in this cohort. If tHb and S a O 2 at VO 2 max were both independent predictors of VO 2 max, it would be expected that the relationship between tHb and VO 2 max would improve after taking into account S a O 2 at VO 2 max. However, accounting for S a O 2 at VO 2 max resulted in no significant changes in the relationship between these variables, which indicates that tHb and EIAD may not be independent. This concept is supported by our finding that S a O 2 at VO 2 max was negatively correlated to tHb ( Fig. 3 ). Although we do not have direct evidence to explain these results, there are two possible physiological explanations. One possibility is that individuals with high tHb may experience more severe desaturation during exercise due to the presence of high blood volume. High blood volume enables greater venous return and ventricular filling, and is therefore a prerequisite for high cardiac output; however, as cardiac output increases, pulmonary capillary transit time decreases, which is believed to be one of the predominate factors leading to exercise-induced hypoxemia and desaturation in athletes 6 31 .
Another possible explanation for this finding is that desaturation during exercise may influence the regulation of tHb. It is well documented that hypoxia can augment erythropoiesis and increase tHb 13 . Although very little research has been performed to directly study this issue, previous research indicates that hypoxemia during high-intensity exercise may interact with environmental hypoxia to create a larger erythropoietic stimulus in individuals who experience more severe EIAD. For example, in athletes with S a O 2 at VO 2 max below 91%, three minutes of maximal aerobic exercise at sea level was found to elevate serum erythropoietin (EPO) for at least 24 h following exercise, and were found to increase reticulocyte count 96 h following exercise, whereas individuals with S a O 2 at VO 2 max above 91% had no significant change in EPO or reticulocytes over time 29 . Additional research by the same group found that the increase in circulating EPO 24 h following high-intensity exercise was ~50% higher when the exercise was performed in simulated normobaric hypoxia (2,100 meters compared to 1,000 meters) 30 . This finding was hypothesized to be a function of the significantly lower S a O 2 during exercise in the simulated hypoxia compared to the control condition. To our knowledge, only one study has followed up on these results to examine whether high-intensity exercise performed in hypoxia can augment increases in hemoglobin mass over time compared to the equivalent training in normoxia. Brocherie et al. reported that 6 bouts of sprint interval training performed in hypoxia throughout a two-week live-high/train-low training camp increased tHb by 4% on average, compared to a control group that lived high but performed sprint interval training in normoxia, which increased tHb only by 2.8% (although these were not statistically different, in part due to low sample size) 2 . Taken together, these results raise the possibility that individual variability in EIAD severity during exercise may be one factor that influences tHb in endurance athletes, especially over long durations of time or in athletes residing at moderate altitude. However, we do not have direct evidence to support this hypothesis, and therefore further experimental research is required to fully elucidate the relationship between EIAD and tHb.
Our finding that there was no difference in severity or prevalence of EIAD at moderate altitude between endurance-trained males and females is in contrast to our hypothesis. Previous work has identified that females experience more severe mechanical respiratory constraints during exercise compared to males 8 14 , which can exacerbate EIAD and has led to the hypothesis that females may be more likely than males to exhibit EIAD 5 . Our findings do not support this hypothesis. Our lab has previously published similar findings in endurance-trained male and female cyclists, where we reported no significant difference between males and females in S a O 2 at VO 2 max at moderate altitude 3 . Interestingly, this study did find a statistically significant difference in the degree of desaturation in males versus females, but it was males, not females, that exhibited larger desaturation. One important caveat to this previous finding is that the statistical tests used for these comparisons did not take into account aerobic capacity, which is known to be a confounding variable for EIAD 5 7 8 . Taken together with previous work in this area, our findings seem to indicate that although females may generally have respiratory anatomy that increases susceptibility to EIAD, the severity of this phenomenon depends upon a complex interplay of several physiological, anatomical, and environmental (i. e., altitude) factors, some of which seem to be of different importance in males versus females.
One strength of this study was that we were able to examine a relatively large sample of both male and female endurance athletes across a range of abilities. This can help to explain the finding that VO 2 max increased between GXTs. This finding is not unprecedented; for example, Edgett et al. recently analyzed the reliability of VO 2 max measured over three GXTs performed on a cycle ergometer in 45 recreationally active adults, using a similar exercise protocol to this study 11 . This group found an increase of 0.066 L O 2 * min −1 between the first and second GXT, and an increase of 0.030 LO 2 * min −1 between the second and third GXT (although only the first and third were statistically different). Interestingly, the magnitude of the change in VO 2 max between the first and second GXT is almost identical to the statistically significant increase of 0.064 LO 2 * min −1 that we found in the current work. Although this increase in VO 2 max was statistically significant, the small magnitude of this change (<2%) is likely not of practical significance and did not have an effect on our conclusions. However, this finding is important because it helps to quantify the magnitude of the learning effect during graded exercise tests on VO 2 max.
One limitation of this study is that despite the relatively large sample size, it is still possible that S a O 2 explains a small but significant portion of the variability in the relationship between tHb and VO 2 max that we were underpowered to detect. Another limitation of this study is that we did not directly measure arterial oxygen saturation or oxygen content. Although pulse oximetry has previously been shown to reliably measure S a O 2 during exercise 37 , direct measurements of arterial blood gas, pH, and temperature during exercise could lead to further insights on this topic. Finally, it is difficult to determine causal relationships when looking at cross-sectional data. An additional factor that may influence the relationship between tHb and VO 2 max is maximal cardiac output, and future research is therefore required on this subject.
Conclusions
At moderate altitude, over 90% of endurance-trained males and females experienced EIAD. Despite a wide range of exercise-induced desaturation values, taking into account S a O 2 at VO 2 max did not improve the relationship between tHb and VO 2 max at moderate altitude. This finding may be in part due to a relationship between oxyhemoglobin desaturation during exercise and tHb, which warrants further investigation. Future research is required determine how other physiological parameters, such as cardiac output, influence the relationship between tHb and VO 2 max.
Acknowledgements
This study was funded in part by a Student Research Award from the Rocky Mountain Chapter of the American College of Sports Medicine, as well as a University of Colorado Beverly Sears Graduate Student Grant. The authors would like to thank Dillon Frisco and Peter Kim for their assistance with this study.
Footnotes
Conflicts of interest The authors declare that they have no conflict of interest.
References
- 1.Bassett D R, Howley E T. Limiting factors for maximum oxygen uptake and determinants of endurance performance. Med Sci Sports Exerc. 2000;32:70–84. doi: 10.1097/00005768-200001000-00012. [DOI] [PubMed] [Google Scholar]
- 2.Brocherie F, Millet G P, Hauser A, Steiner T, Rysman J, Wehrlin J P, Girard O. “Live high–train low and high” hypoxic training improves team-sport performance. Med Sci Sports Exerc. 2015;47(10):2140–2149. doi: 10.1249/MSS.0000000000000630. [DOI] [PubMed] [Google Scholar]
- 3.Brothers M D, Hilger K, Carson J M, Sullivan L, Byrnes W C. GXT responses in altitude-acclimatized cyclists during sea-level simulation. Med Sci Sports Exerc. 2007;39:1727–1735. doi: 10.1249/mss.0b013e3181238a3f. [DOI] [PubMed] [Google Scholar]
- 4.Buchfuhrer M J, Hansen J E, Robinson T E, Sue D Y, Wasserman K, Whipp B J. Optimizing the exercise protocol for cardiopulmonary assessment. J Appl Physiol. 1983;55:1558–1564. doi: 10.1152/jappl.1983.55.5.1558. [DOI] [PubMed] [Google Scholar]
- 5.Dempsey J, Amann M, Harms C, Wetter T. Respiratory system limitations to performance in the healthy athlete: Some answers, more questions! Dtsch Z Für Sportmed. 2012:157–162. [Google Scholar]
- 6.Dempsey J A, Hanson P G, Henderson K S. Exercise-induced arterial hypoxaemia in healthy human subjects at sea level. J Physiol. 1984;355:161–175. doi: 10.1113/jphysiol.1984.sp015412. [DOI] [PMC free article] [PubMed] [Google Scholar]
- 7.Dempsey J A, Wagner P D. Exercise-induced arterial hypoxemia. J Appl Physiol. 1999;87:1997–2006. doi: 10.1152/jappl.1999.87.6.1997. [DOI] [PubMed] [Google Scholar]
- 8.Dominelli P B, Foster G E, Dominelli G S, Henderson W R, Koehle M S, McKenzie D C, Sheel A W. Exercise-induced arterial hypoxaemia and the mechanics of breathing in healthy young women: Hypoxaemia and ventilatory mechanics in exercising women. J Physiol. 2013;591:3017–3034. doi: 10.1113/jphysiol.2013.252767. [DOI] [PMC free article] [PubMed] [Google Scholar]
- 9.Dominelli P B, Render J N, Molgat-Seon Y, Foster G E, Romer L M, Sheel A W. Oxygen cost of exercise hyperpnoea is greater in women compared with men. J Physiol. 2015;593:1965–1979. doi: 10.1113/jphysiol.2014.285965. [DOI] [PMC free article] [PubMed] [Google Scholar]
- 10.Dunn A, Lo V, Donnelly S. The role of the kidney in blood volume regulation: The kidney as a regulator of the hematocrit. Am J Med Sci. 2007;334:65–71. doi: 10.1097/MAJ.0b013e318095a4ae. [DOI] [PubMed] [Google Scholar]
- 11.Edgett B A, Bonafiglia J T, Raleigh J P, Rotundo M P, Giles M D, Whittall J P, Gurd B J. Reproducibility of peak oxygen consumption and the impact of test variability on classification of individual training responses in young recreationally active adults. Clin Physiol Funct Imaging. 2017;38:630–638. doi: 10.1111/cpf.12459. [DOI] [PubMed] [Google Scholar]
- 12.Gaston A-F, Durand F, Roca E, Doucende G, Hapkova I, Subirats E. Exercise-induced hypoxaemia developed at sea level influences responses to exercise at moderate altitude. PLoS One. 2016;11:e0161819. doi: 10.1371/journal.pone.0161819. [DOI] [PMC free article] [PubMed] [Google Scholar]
- 13.Gore C J, Sharpe K, Garvican-Lewis L A, Saunders P U, Humberstone C E, Robertson E Y, Wachsmuth N B, Clark S A, McLean B D, Friedmann-Bette B, Neya M, Pottgiesser T, Schumacher Y O, Schmidt W F. Altitude training and haemoglobin mass from the optimised carbon monoxide rebreathing method determined by a meta-analysis. Br J Sports Med. 2013;47:i31–i39. doi: 10.1136/bjsports-2013-092840. [DOI] [PMC free article] [PubMed] [Google Scholar]
- 14.Guenette J A, Witt J D, McKenzie D C, Road J D, Sheel A W. Respiratory mechanics during exercise in endurance-trained men and women. J Physiol. 2007;581:1309–1322. doi: 10.1113/jphysiol.2006.126466. [DOI] [PMC free article] [PubMed] [Google Scholar]
- 15.Harms C A, McClaran S R, Nickele G A, Pegelow D F, Nelson W B, Dempsey J A. Effect of exercise-induced arterial O2 desaturation on VO2max in women. Med Sci Sports Exerc. 2000;32:1101–1108. doi: 10.1097/00005768-200006000-00010. [DOI] [PubMed] [Google Scholar]
- 16.Harriss D J, Macsween A, Atkinson G. Standards for ethics in sport and exercise science research: 2018 update. Int J Sports Med. 2017;38:1126–1131. doi: 10.1055/s-0043-124001. [DOI] [PubMed] [Google Scholar]
- 17.Hopkins W G. Measures of reliability in sports medicine and science. Sports Med. 2000;30:1–15. doi: 10.2165/00007256-200030010-00001. [DOI] [PubMed] [Google Scholar]
- 18.Horwitz L D, Lindenfeld J. Effects of enhanced ventricular filling on cardiac pump performance in exercising dogs. J Appl Physiol. 1985;59:1886–1890. doi: 10.1152/jappl.1985.59.6.1886. [DOI] [PubMed] [Google Scholar]
- 19.Joyner M J. Physiological limits to endurance exercise performance: influence of sex. J Physiol. 2017;595:2949–2954. doi: 10.1113/JP272268. [DOI] [PMC free article] [PubMed] [Google Scholar]
- 20.Joyner M J, Coyle E F. Endurance exercise performance: The physiology of champions. J Physiol. 2008;586:35–44. doi: 10.1113/jphysiol.2007.143834. [DOI] [PMC free article] [PubMed] [Google Scholar]
- 21.Krip B, Gledhill N, Jamnik V, Warburton D. Effect of alterations in blood volume on cardiac function during maximal exercise. Med Sci Sports Exerc. 1997;29:1469–1476. doi: 10.1097/00005768-199711000-00013. [DOI] [PubMed] [Google Scholar]
- 22.Lawler J, Powers S K, Thompson D. Linear relationship between VO2max and VO2max decrement during exposure to acute hypoxia. J Appl Physiol. 1988;64:1486–1492. doi: 10.1152/jappl.1988.64.4.1486. [DOI] [PubMed] [Google Scholar]
- 23.Lundby C, Montero D, Joyner M. Biology of VO2 max: looking under the physiology lamp. Acta Physiol 2016 Available from: http://doi.wiley.com/10.1111/apha.12827 [DOI] [PubMed]
- 24.Lundby C, Robach P. Performance enhancement: What are the physiological limits? Physiology. 2015;30:282–292. doi: 10.1152/physiol.00052.2014. [DOI] [PubMed] [Google Scholar]
- 25.Powers S K, Martin D, Cicale M, Collop N, Huang D, Criswell D. Eur J Appl Physiol. 1988;58:298–302. [Google Scholar]
- 26.Powers S K, Dodd S, Lawler J, Landry G, Kirtley M, McKnight T, Grinton S. Incidence of exercise-induced hypoxemia in elite endurance athletes at sea level. Eur J Appl Physiol. 1992;65:37–42. doi: 10.1007/BF00417266. [DOI] [PubMed] [Google Scholar]
- 27.Prommer N, Schmidt W. Loss of CO from the intravascular bed and its impact on the optimised CO-rebreathing method. Eur J Appl Physiol. 2007;100:383–391. doi: 10.1007/s00421-007-0439-2. [DOI] [PubMed] [Google Scholar]
- 28.Prommer N, Thoma S, Quecke L, Gutekunst T, VöLzke C, Wachsmuth N, Niess A M, Schmidt W. Total hemoglobin mass and blood volume of elite Kenyan runners. Med Sci Sports Exerc. 2010;42:791–797. doi: 10.1249/MSS.0b013e3181badd67. [DOI] [PubMed] [Google Scholar]
- 29.Roberts D, Smith D J. Erythropoietin concentration and arterial haemoglobin saturation with supramaximal exercise. J Sports Sci. 1999;17:485–493. doi: 10.1080/026404199365795. [DOI] [PubMed] [Google Scholar]
- 30.Roberts D, Smith D J, Donnelly S, Simard S. Plasma-volume contraction and exercise-induced hypoxaemia modulate erythropoietin production in healthy humans. Clin Sci. 2000;98:39–45. [PubMed] [Google Scholar]
- 31.Rowell L B, Taylor H L, Wang Y, Carlson W S. Saturation of arterial blood with oxygen during maximal exercise. J Appl Physiol. 1964;19:284–286. doi: 10.1152/jappl.1964.19.2.284. [DOI] [PubMed] [Google Scholar]
- 32.Ryan B J, Goodrich J A, Schmidt W, Kane L A, Byrnes W C. Ten days of intermittent, low-dose carbon monoxide inhalation does not significantly alter hemoglobin mass, aerobic performance predictors, or peak-power exercise tolerance. Int J Sports Med. 2016;37:884–889. doi: 10.1055/s-0042-108197. [DOI] [PubMed] [Google Scholar]
- 33.Ryan B J, Goodrich J A, Schmidt W F, Stothard E R, Wright K P, Byrnes W C. Haemoglobin mass alterations in healthy humans following four-day head-down tilt bed rest. Exp Physiol. 2016;101:628–40. doi: 10.1113/EP085665. [DOI] [PMC free article] [PubMed] [Google Scholar]
- 34.Schmidt W, Prommer N. The optimised CO-rebreathing method: A new tool to determine total haemoglobin mass routinely. Eur J Appl Physiol. 2005;95:486–495. doi: 10.1007/s00421-005-0050-3. [DOI] [PubMed] [Google Scholar]
- 35.Schmidt W, Prommer N. Impact of alterations in total hemoglobin mass on VO2max. Exerc Sport Sci Rev. 2010;38:68–75. doi: 10.1097/JES.0b013e3181d4957a. [DOI] [PubMed] [Google Scholar]
- 36.Scroop G C, Shipp N J. Exercise-induced hypoxemia: Fact or fallacy? Med Sci Sports Exerc. 2010;42:120–126. doi: 10.1249/MSS.0b013e3181ad0117. [DOI] [PubMed] [Google Scholar]
- 37.Yamaya Y, Bogaard H J, Wagner P D, Niizeki K, Hopkins S R. Validity of pulse oximetry during maximal exercise in normoxia, hypoxia, and hyperoxia. J Appl Physiol. 2002;92:162–168. doi: 10.1152/japplphysiol.00409.2001. [DOI] [PubMed] [Google Scholar]