

Abstract
Spleen tyrosine kinase (Syk) is an essential player in immune signaling through its ability to couple multiple classes of membrane immunoreceptors to intracellular signaling pathways. Ligand binding leads to the recruitment of Syk to a phosphorylated cytoplasmic region of the receptors called ITAM. Syk binds to ITAM with high‐affinity (nanomolar K d) via its tandem pair of SH2 domains. The affinity between Syk and ITAM is allosterically regulated by phosphorylation at Y130 in a linker connecting the tandem SH2 domains; when Y130 is phosphorylated, the binding affinity decreases (micromolar K d). Previous equilibrium binding studies attribute the increase in the binding free energy to an intra‐molecular binding (isomerization) step of the tandem SH2 and ITAM, but a physical basis for the increased free energy is unknown. Here, we provide evidence that Y130 phosphorylation imposes an entropy penalty to isomerization, but surprisingly, has negligible effect on the SH2 binding interactions with ITAM and thus on the binding enthalpy. An analysis of NMR chemical shift differences characterized conformational effects of ITAM binding, and binding thermodynamics were measured from isothermal titration calorimetry. Together the data support a previously unknown mechanism for the basis of regulating protein–protein interactions through protein phosphorylation. The decreased affinity for Syk association with immune receptor ITAMs by Y130 phosphorylation is an allosteric mechanism driven by an increased entropy penalty, likely contributed by conformational disorder in the SH2–SH2 inter‐domain structure, while SH2‐ITAM binding contacts are not affected, and binding enthalpy is unchanged.
Keywords: spleen tyrosine kinase (Syk), tandem SH2 domain (tSH2), doubly phosphorylated immunoreceptor tyrosine‐based activation motif (dp‐ITAM), entropic allostery, tyrosine phosphorylation allostery, regulation of protein–protein interaction, multi‐domain ensemble thermodynamics, multistate equilibrium with isomerization, NMR chemical shift difference analysis, isothermal titration calorimetry model and data analysis
Introduction
The non‐receptor spleen tyrosine kinase, Syk, is an essential player in hematopoietic cell signal transduction involved with distinguishing self from nonself.1, 2, 3, 4, 5 Syk transduces signals from immunoreceptors (e.g. B cell receptor, T cell receptors, Fc receptors) to various downstream pathways relating to proliferation, differentiation, phagocytosis, etc.2, 3 Thus, dysfunction of Syk is closely related with autoimmune diseases, inflammation, and malignancies.2 Recent studies have also revealed unusual roles of Syk in non‐immune cells such as a tumor promoter in some tumor types, but a tumor suppressor in others6; stablizing Bcl‐xL mRNA through nucleolin7; promoting the clearance of stress granules through authophagy8; and involving microglial cell dysfunction in Alzheimer's disease.9 This breadth of functionality is achieved through association of Syk with multiple proteins, including membrane immunoreceptors as well as cytoplasmic proteins.
Syk contains an N‐terminal SH2 domain, (N)SH2, linked by interdomain A, IA, to a C‐terminal SH2 domain, (C)SH2, followed by the catalytic kinase domain. The two SH2 domains plus IA are termed the tandem SH2 domains (tSH2; Fig. 1).10 Transduction in immune signaling relies on Syk tSH2 interaction with the cytosolic regions of immunoreceptors known as immunoreceptor tyrosine‐based activation motifs, or ITAMs, which contain a consensus sequence YXX(I/L)X6–10YXX(I/L).1, 11, 12 When immunoreceptors are activated by an extracellular signal, the two YXX(I/L) cassettes become phosphorylated.1, 13 Syk association with doubly phosphorylated ITAMs (dp‐ITAMs) is mediated by tSH2 through a bifunctional high affinity14, 15, 16, 17, 18, 19 (K d in nM ranges) association. Each SH2 domain binds one phosphorylated YXX(I/L) cassette in a head‐to‐tail fashion10: (C)SH2 binds to the N‐terminal pYXX(I/L) cassette while (N)SH2 binds to the C‐terminal pYXX(I/L) cassette (Fig. 1). After recruitment to the membrane, Syk is activated and phosphorylated at numerous tyrosyl sites in two linker regions to control downstream immune signaling.1 Phosphorylation of one site, Y130 (murine Syk numbering) in the IA linker connecting the two SH2 domains, plays a role in regulating immune signaling in cells by weakening the association of Syk with membrane receptors.1, 20 In vitro studies find that the introduction of negative charge on IA leads to greatly reduced affinity for peptides derived from dp‐ITAMs (K d increases from nM to μM range).21 Release of Syk from membrane immunoreceptors terminates the immune signaling response and would free Syk for alternative downstream signaling events.1, 2
Figure 1.

The structure of Syk tandem SH2 (tSH2) (PDB ID 1A81, Chains A and B). PyMol session files for these representations are provided in Supplementary material. (A) tSH2 complex with a dp‐ITAM peptide (ITP, Ac‐PDpYEPIRKGQRDLpYSGLNQR‐NH2). Syk tSH2 is shown in ribbon representation. Green: (N)SH2 domain (8–118). Cyan: Interdomain A (IA, 119–162). Blue: (C)SH2 domain (163–264). Y130 is highlighted in red sticks. ITP is drawn with gold sticks, with the phosphoryl groups of the two phosphotyrosines shown as gold spheres to indicate the binding pockets. The interface between the three domains is illustrated by showing the side chains of residues that are within 6 Å of any heavy atom from either of the other two domains. (B) tSH2 with the domain‐domain interface highlighted using spheres for the interface residues defined as in A.
The mechanism that regulates Syk binding to dp‐ITAM of immunoreceptors is not well understood in structural and physical terms. An unanswered question is how Y130 phosphorylation promotes the dissociation of Syk from dp‐ITAMs as Y130 is located in IA distal to the phosphotyrosine binding sites of the SH2 domains (>30 Å; Fig. 1).10 Previous NMR studies showed that negative charge at Y130 affects the inter‐domain structure of tSH2, rotationally decouples the two SH2 domains, and changes the overall hydrodynamic shape of tSH2 in the ligand‐free state.21 Nonetheless, how these perturbations in conformation upon Y130 phosphorylation reduce affinity between Syk tSH2 and receptor dp‐ITAMs is not clear.
The catalytic domain and the two SH2 domains of inactivated Syk form a compact structure,22 but once bound to dp‐ITAM regions, the Syk catalytic domain is thought to disengage from the rest of the protein and become activated.10, 22, 23 Accordingly, regulating the dissociation of Syk from the immunoreceptors is a property of the isolated tSH2 component of Syk and can be reasonably evaluated with the tSH2 fragment of Syk.
The binding of dp‐ITAM to Syk tSH2 is modeled in this study by a 2‐step process [Fig. 2(A)]. The first step is the intermolecular association of (C)SH2 with the N‐terminal pYXX(I/L) cassette of dp‐ITAM in a monofunctional binding complex. Second, the (N)SH2 domain associates with the C‐terminal pYXX(I/L) cassette through an intramolecular isomerization step to form the head‐to‐tail bifunctional complex with both SH2 domains ligated. One proposal put forward for the basis of reduced affinity between Syk and receptor ITAMs is that Y130 phosphorylation converts tSH2 to a conformation that cannot accommodate bifunctional binding and only one pYXX(I/L) cassette can associate at a time.21 This proposal was refuted recently using an NMR lineshape analysis; the binding process of tSH2 with negative charge added to IA was shown to remain bifunctional.24 It was concluded that the reduced affinity of Syk for immunoreceptors by Y130 phosphorylation is not due to preventing the second binding (isomerization) step, but is due to an increase in the free energy for the isomerization step, although the equilibrium strongly favors the forward direction for both unphosphorylated and phosphorylated tSH2.24
Figure 2.

Schematic for Syk tSH2 interaction with dp‐ITAMs of membrane immunoreceptors. The two SH2 domains, (N)SH2 and (C)SH2, are labeled “N” and “C,” respectively, and connected by the IA linker. dp‐ITAM peptide binds in a head to tail orientation and is shown with each pYXX(I/L) cassette represented by an open square. (A) The 3‐state equilibrium binding model for Syk tSH2. The first step is intermolecular binding of the N‐terminal pYXX(I/L) cassette to (C)SH2. The second step is intra‐molecular binding, or isomerization, for the association of the C‐terminal pYXX(I/L) cassette to (N)SH2. (B–D) Models of different potential mechanisms for the increased binding free energy of the isomerization step (indicated by the asterisk) when Y130 in IA is phosphorylated (indicated by a circled “–” on IA to highlight the negative charge introduced by phosphorylation). (B) Suboptimal interactions in the (N)SH2 phosphotyrosine pocket: altered tSH2 domain–domain orientation from Y130 phosphorylation negatively affects binding interactions of the N(SH2) phosphotyrosine pocket, which lies at the domain interface. (C) Suboptimal dp‐ITAM conformation: altered tSH2 domain structure requires dp‐ITAM to adopt a suboptimal bound state conformation as a result of the change in the relative position of the two binding sites. (D) Entropy‐based model, in which Y130 phosphorylation increases domain–domain motion and thus entropy penalty for the isomerization step.
The 3‐state model [Fig. 2(A)] is a simplification of the possible microstates for the association between tSH2 and dp‐ITAM. Each SH2 domain has been shown to bind each pYXX(I/L) cassette of ITAM, which gives nine alternative complexes of tSH2:dp‐ITAM with either a 1:1 or 1:2 stoichiometry, plus only the head‐to‐tail mode observed in the crystal structure (1A81) for the fully engaged, bifunctional complex.24 The potential for nine complexes was identified from a residue‐level analysis of NMR titration data. Fitting equilibrium binding data with both the full 10‐state model and the reduced 3‐state model justified use of the simplified 2‐step process in Figure 2(A) when the tSH2:dp‐ITAM molar ratio is approximately less than two,24 which is a condition used for the results reported here. Previous investigations on the association between dp‐ITAM‐derived peptides and Syk tSH2 reasonably assumed a single‐step process, which fits well the high‐affinity binding measured in these studies.14, 15, 16, 17, 18 In another case, a 3‐state model was adopted to fit surface plasmon resonance (SPR) data for Syk tSH2 binding an ITAM‐derived peptide with a rigid connector between the two pYXX(I/L) cassettes at lower temperature.19 The data were well fit with a 3‐state model. None of the experimental methods utilized in these earlier works provide the residue‐level characterization of titrations afforded by NMR chemical shifts24 and the potential presence of other complexes could not have been ruled out to substantiate the reduction to three states.
Here, we investigate the possible structural basis for the increased free energy of the second step involving intra‐molecular binding (isomerization) after Y130 phosphorylation by considering different possible mechanisms [Fig. 2(B–D)].
First, given that negative charge at position Y130 in IA alters the inter‐domain structure, that is the separation and orientation of the (N)SH2 relative to the (C)SH2,21, 24 reduced affinity of the isomerization step could arise from non‐optimal association at the (N)SH2 binding site, which lies at the SH2–SH2 interface (Fig. 1). The isomerization step for positioning the second pYXX(I/L) cassette in the (N)SH2 binding site would be less favorable if IA phosphorylation effects on conformational equilibrium of the tSH2 inter‐domain orientation and separation (i.e. the domain–domain structure) diminished binding interactions [Fig. 2(B)], or by requiring bound dp‐ITAM to adopt a higher free‐energy conformation than that when bound to unphosphorylated tSH2 [Fig. 2(C)]. Overall, the change in SH2 domain–domain orientation and weakened coupling of the two SH2 domains after Y130 phosphorylation could result in less favorable intermolecular association of dp‐ITAM in a bifunctional manner, which depends critically on matching the two pYXX(I/L) cassettes with the two SH2 binding sites.10
While the two mechanisms proposed above are perturbations of intermolecular interactions and would be manifest mainly in the binding enthalpy, another potential basis for the decreased binding affinity is that phosphorylation of IA alters the conformational fluctuations internal to IA and/or fluctuations of the SH2‐SH2 domain structure. A differential effect from phosphorylation on conformational fluctuations between the unligated and bound states would alter the entropy of the isomerization step. Because Y130 is distant to the two binding sites of the SH2 domains, the negative regulation of Syk‐receptor association by Y130 phosphorylation is allosteric. Entropically driven allostery (sometimes imprecisely referred to as dynamic allostery) has been increasingly recognized and discussed.25, 26, 27 As shown in Figure 2(D), an entropic basis for reducing the equilibrium for isomerization in the forward direction is that Y130 phosphorylation increases the entropy of the unligated and singly bound forms of tSH2 relative to the bifunctional complex, resulting in a higher entropy penalty for the isomerization step.
To test these models, chemical shift perturbation experiments from nuclear magnetic resonance (NMR) spectroscopy and isothermal titration calorimetry (ITC) experiments were performed. The data support the entropy‐driven model proposed in Figure 2(D).
Results and Discussion
Syk complexes for modeling the interaction between Syk tSH2 and immunoreceptor ITAMs
In the following text, (N)SH2 and (C)SH2 are used to denote the N‐terminal and C‐terminal SH2 domain, respectively, in the context of the whole tSH2 molecule, while N‐SH2 and C‐SH2 refer to isolated SH2 domain fragments of Syk. A high sequence identity exists between human and murine Syk (92% for (N)SH2, 94% for (C)SH2, and 100% for IA), and the tSH2 constructs used in this study are based on murine Syk.24
Three tSH2 forms were used to investigate the effect of linker A phosphorylation on the association of Syk and immunoreceptors: tSH2UN, the unphosphorylated Syk tandem SH2 domain (murine Syk Residues 8–264); tSH2PM, Syk tandem SH2 with a single Y130E mutation to mimic the effect of phosphorylation by introducing negative charge on IA, a substitution that has been used to study the behavior of the Y130‐phosphorylation in cells20, 28, 29; and tSH2FX, with IA (Residues 119–162) replaced by a (GGS)3GS(GGS)3 flexible linker. These tandem SH2 proteins have alternative forms of the linker connecting the two SH2 domains and have been utilized previously to investigate Syk IA phosphorylation.21, 24 The studies found that SH2‐SH2 domain structure in tSH2UN is well ordered and appropriately oriented in solution for bifunctional, high‐affinity binding to dp‐ITAMs, while the fully flexible linker in tSH2FX enables independent rotation of the two SH2 domains such that the SH2 domains are rotationally decoupled and not fixed in orientation. The precise SH2−SH2 domain structure and degree of inter‐domain association in tSH2PM are unknown but are intermediate to tSH2UN and tSH2FX. Isolated SH2 domains, N‐SH2 and C‐SH2, were also constructed to study as references for single‐domain binding parameters.
The 20‐residue dp‐ITAM peptide, ITP, contains two pYXX(I/L) cassettes (see Methods section for sequence), derives from the CD3ε chain of the T cell receptor, and has reported affinity of 20–30 nM for unphosphorylated tSH2 (tSH2UN)14, 16 and 2–6 μM for tSH2PM and tSH2FX.21, 24 Two half‐sized peptides corresponding to ITP Residues 1–9 and 10–20, N‐IHP and C‐IHP (see Methods section for sequences), respectively, each containing only one pYXX(I/L) cassette, were used to characterize monofunctional binding of individual SH2 domains to one pYXX(I/L) cassette.
Chemical‐shift perturbation profiles show characteristic interactions of SH2 domains with ITP and IHPs
Perturbations in NMR chemical shifts of a protein upon ligand association inform on the conformational effects of the binding process. Residue profiles of the chemical shift perturbation (CSP) from amide nuclei are a fingerprint for binding interactions between the protein and the ligand,30, 31, 32 and can reflect differences in tSH2 binding ITAM due to perturbations of the IA linker connecting the two SH2 domains of Syk. The 15N‐HSQC CSP profiles were determined for the three tSH2 forms (tSH2UN, tSH2PM, and tSH2FX) binding a dp‐ITAM peptide, ITP, with two pYXX(I/L) cassettes. We also examined complexes with two half‐sized, singly phosphorylated ITAM peptides, N‐IHP and C‐IHP (see Methods section). Only residues in the two SH2 domains can be queried by chemical‐shift analysis as resonances of residues in the linker regions are not observed in the 15N‐HSQC spectra for tSH2UN and tSH2FX (only a few are observed for tSH2PM) due to exchange broadening.21
A characteristic pattern in the CSP residue profile emerges when ITP binds any of the tSH2 forms. This CSP profile is shown in Figure 3(A) for ITP binding tSH2UN, and for all nine complexes (three proteins tSH2UN, tSH2PM, and tSH2FX binding with three peptides ITP, N‐IHP, and C‐IHP) in the Figure S2. The distribution of CSP values [Fig. 3(B)] shows that ~10% of the values stand out from the population with a CSP ≥ 0.15 ppm [Fig. 3(A,B)]. These high‐CSP residues are found to all contact ITP when mapped to the crystallographic structure (PDB ID 1A81) and reside in the same secondary‐structure elements in both SH2 domains [Fig. 3(C,D)]: the EF loop ((N)SH2: I75, G77, G78; (C)SH2: S226, G230) and BG loop ((N)SH2: G97, L102; (C)SH2: G249) of the specificity pocket; the αA helix ((N)SH2: E25; (C)SH2: S177) and βD strand ((N)SH2: Y63; (C)SH2: H214) of the phosphotyrosine pocket. That these high‐CSP residues are in analogous locations on each SH2 domain [Fig. 3(D)] is reasonable considering that each pYXX(I/L) cassette interacts with residues in the specificity pocket and the phosphotyrosine pocket following the canonical binding mode for SH2 domains. Similar CSP patterns are seen for other SH2 domains such as Src SH233, Vav SH234, 35, Spt6 N‐terminal SH236, and PI3K p85 N‐terminal SH2.37 It is noteworthy that the highest CSP values [0.3–0.5 ppm; Fig. 3(A)] are mostly from the glycine residues (G77, G78, G97, G230, and G249) in the EF and BG loops that appear to gate access to the specificity pockets.34, 35 These glycine residues are highly conserved across different Syk variants from various species (>92% occurrence, which is higher than at least half of all Syk tSH2 residues, see Fig. S1). The importance of these loop regions is further suggested by the report that a single mutation in the EF loop of PI3K p85 N‐terminal SH2 can cause significant changes in SH2 structure and binding specificity.38, 39 Because the large CSP values reflect intermolecular interactions, as opposed to effects remote to the binding region, chemical shift differences were analyzed in detail to better understand the effect of IA state on ITAM binding, and presented in the next sections.
Figure 3.

Chemical shift perturbation. CSP = , where Δδ is the chemical shift difference of unligated Syk tSH2UN (0.3 mM) and tSH2UN in the presence of ITP (0.6 mM). Resonances for Residues 114–167 in the IA region are exchange broadened. (A) CSP plotted as a function of residue number. Residues with CSP ≥ 0.15 ppm (dotted line) are labeled. (B) Histogram for the CSP values in A. Bin size is 0.01 ppm. Approximately 10% of the resonances exhibit large CSP values greater than 0.15 ppm (dotted line). (C) CSP values mapped to the tSH2UN/ITP crystal structure (PDB ID 1A81) with only the SH2 domains and ITP shown for clarity. Red: residues with CSP ≥ 0.15 ppm. Blue: residues with CSP < 0.15 ppm. White: CSP unknown. The ITP peptide is drawn as in Figure 1. (D) A similar pattern of high CSP values is mapped to (N)SH2 and (C)SH2, and viewed with the two SH2 domains similarly oriented. The (C)SH2 domain (dotted box) is rotated to a similar orientation as the (N)SH2 domain. The secondary structural elements with high‐CSP residues (red) are labeled.
Chemical shift covariance analysis
The characteristic patterns apparent in the CSP profile for ITAM peptide complexes [Figs. 3(A) and S2] suggest that ITAM binding to Syk tSH2 elicits a consistent perturbation that is reported in the chemical shift variations of the two SH2 domains. A covariance analysis of chemical shifts40 was, therefore, explored to gain insight into the influence of Y130 phosphorylation on the affinity of Syk for receptor ITAMs under the premise that differences in the response between two proteins would be detected in the covariance analysis by a loss of correlation.
A covariance analysis of chemical shifts, introduced by Melacini et al.,40 is based on the assumption of a rapid equilibrium between states giving rise to changes in chemical shift, here the ligand‐free and ITAM‐bound states of tSH2. Melacini et al. correlated CSP values, which are combined chemical shifts of 1HN and 15N, and calculated Pearson's correlation coefficients for this scalar quantity. The approach taken here differs by using the component chemical shift differences for the individual 15N and 1HN nuclei. It is possible to take advantage of the greater information of individual nuclei rather than the combined CSP, a scalar quantity, by using a distance correlation coefficient, DCOR, which is effective for capturing the correlative behavior of vector quantities.41, 42 The details for both the chemical shift correlation analysis and DCOR calculation are given in Supplementary material.
DCOR values based on distance correlations of the chemical shift differences between free and bound states were computed with data from the three forms of tSH2 in complex with ITP, N‐IHP, and C‐IHP. Chemical shift data were included for the 84 residues with 15N‐HSQC peak assignments common to all 12 tSH2 states (see Supplementary material). An IHP complex was taken to be analogous to the canonical head‐to‐tail tSH2 complex. That is, data for a canonical IHP complex comprised (N)SH2 chemical shifts from a C‐IHP/tSH2 complex and (C)SH2 chemical shifts from an N‐IHP/tSH2 complex, and DCOR coefficients were computed from chemical shift differences between unligated tSH2 proteins and the proteins bound with IHPs. The resulting distributions of DCOR values are plotted in Figure 4 (solid black curves, IHPs only). As expected, the changes in chemical shift overall are highly correlated with all DCOR values being greater than 0.4 and a large fraction greater than 0.9. DCOR computed by including only the three IHP canonical complexes (black curve) captures correlations in the perturbations of monofunctional binding of the single pYXX(I/L) cassette. To examine the perturbative effects associated with bifunctional binding, we include chemical shift differences from each ITP complex along with those of the IHP complexes in the covariance analysis. Addition of tSH2PM/ITP or tSH2FX/ITP shifts the distribution toward even larger DCOR values (red and blue, respectively). By contrast, tSH2UN/ITP (green) diminishes correlation and many fewer coefficients are above 0.85. Together, these results suggest that the perturbative responses for bifunctional binding of tSH2PM and tSH2FX are highly overlapped with the perturbation from IHP binding, while bifunctional binding to tSH2UN somehow differs. The nature of the difference is further examined below with evaluation of individual chemical shift changes.
Figure 4.
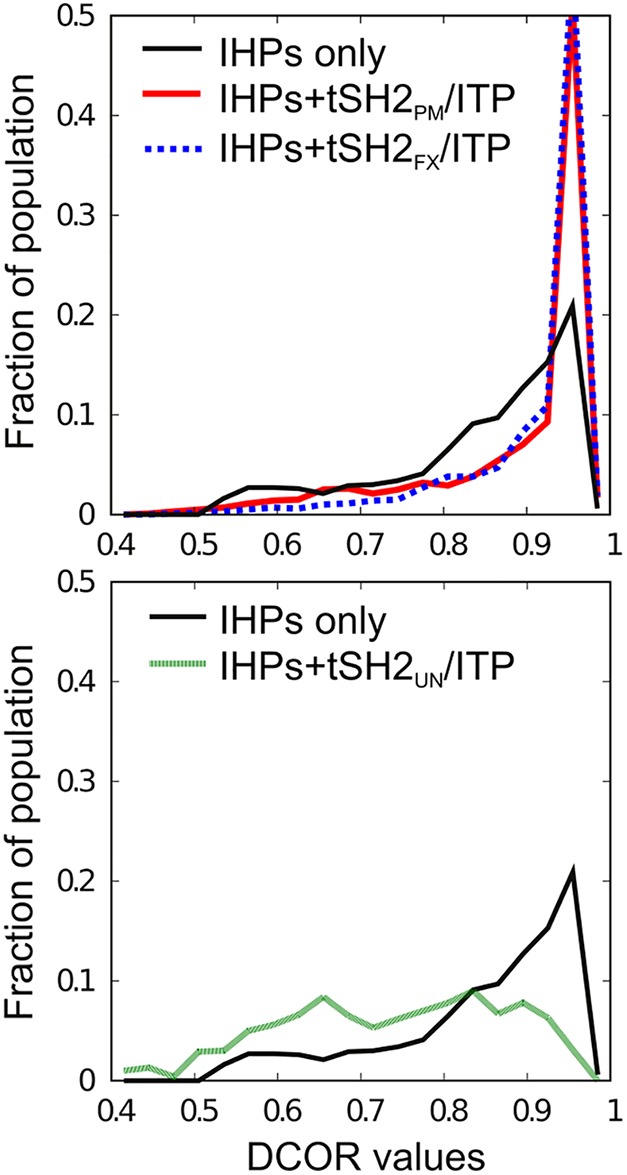
DCOR values based on distance correlations of the chemical shift differences (Δδ) between free and bound states for the three forms of tSH2 in complex with ITP, N‐IHP and C‐IHP. Chemical shifts are from 84 residues with 15N HSQC assignments observed in all 12 tSH2 states. An IHP complex includes resonances of (N)SH2 residues for the C‐IHP/tSH2 complex and of (C)SH2 residues for the N‐IHP/tSH2 complex. The DCOR values were calculated either among the three IHP complexes only (black), or among these three IHP sets plus one of the ITP complexes (red for tSH2PM, blue dotted for tSH2FX, and green for tSH2UN).
Chemical shift differences (Δδ) suggest the altered linker state causes structural changes at the SH2‐SH2 interface, but ITP binding abolishes the differences due to negatively charged IA
Because of the high sensitivity of chemical shifts to conformational equilibrium,30, 31, 32 we made a closer examination of chemical shift differences by assessing Δδ, the individual difference of amide δ(1HN) or δ(15N) chemical shifts upon binding. By the example of chemical shift sensitivity, a 0.1 Å change of a hydrogen bond distance could lead to a proton Δδ value of 0.5 ppm;31, 43 the Δδ value is up to 0.8 ppm for 1HN and 1.5 ppm for 15N in examples of protein–protein interactions.30, 44 Analysis of individual components of each nucleus provides more information than the combined scalar CSP quantity.
The 1HN and 15N Δδ values of SH2 residues in tSH2PM or tSH2FX relative to tSH2UN in either ligand‐free or bound states are shown in Figure 5. For each pair, the Δδ values are plotted on a 2D plane with the corresponding histogram projected along each dimension. For all six pairs, the distribution of Δδ values of both amide 1HN and 15N dimensions are narrowly centered around 0; most Δδ values (blue dots) range from −0.05 to 0.05 ppm for 1HN dimension and from −0.35 to 0.35 ppm for 15N dimension, which is approximately 2σ from the mean of each dimension in Figure 5(A). These narrow distributions for the large majority of peaks indicate the overall tertiary structure of the SH2 domains is not strongly affected by the form of the linker in either the ligand‐free or ITP‐bound states. Nonetheless, there are several residues that are outliers by showing large Δδ values (red diamonds) beyond the range of [−0.05, 0.05] ppm for the 1HN dimension or [−0.35, 0.35 ppm] for the 15N dimension. The outliers in the pairwise comparisons in Figure 5 are discussed below and in the following two sections.
Figure 5.

Plots are the main chain amide chemical shift differences (Δδ for 1HN and 15N) between tSH2UN and either tSH2PM (A, C, and E) to examine the effect of IA negative charge, or tSH2FX (B, D, and F) to examine the effect of a flexible linker. Pairwise comparisons are made for the ligand‐free state (A and B), the ITP bound state (C and D), and the IHP‐bound state (E and F). For each pair of structures, n is the number of resonances resolved for both structures and shown in the plot. The distribution projected in each dimension is shown as a histogram along the top and right hand side (bin size: 0.01 ppm for Δδ1HN and 0.05 ppm for Δδ15N). Δδ values more than ~2σ from the mean of (A), that is the range [−0.05, 0.05] ppm for Δδ1HN or [−0.35, 0.35] ppm for Δδ15N, are colored red and labeled by residue; all other values are shown in blue. The Δδ values are mapped with the same colors onto the Syk tSH2 structure below each plot. The gray bars in E and F indicate that the SH2 domains are binding to the two isolated half IHP peptides instead of a full‐length ITP peptide. Only Δδ values corresponding to the (N)SH2 domain binding to C‐IHP and the (C)SH2 domain binding N‐IHP are plotted in E and F.
The effect of Y130 phosphorylation on the ligand‐free state conformation is considered from comparing tSH2PM versus tSH2UN [Fig. 5(A)]. The outliers in Δδ values are mapped to the structure in the bottom panel of Figure 5(A) (red) and found to be mostly from residues located in the interface of the two SH2 domains. Interface residues (side chains) are shown as sticks in Figure 1(A) and as spheres in Figure 1(B). That interfacial residues have relatively large Δδ values is consistent with the previously reported changes in domain‐domain orientation and rotational decoupling when residue 130 is negatively charged.21 For tSH2FX versus tSH2UN in the ligand‐free state [Fig. 5(B)], the outliers are not only from the same residues along the interface as in Figure 5(A), but also residues in or close to the C‐terminus of the (C)SH2 domain. These outliers may reflect domain–domain associations that are not present in tSH2UN or tSH2PM but occur in tSH2FX where the two SH2 domains are rotationally independent.24
A striking result is the comparison between the bifunctional ITP complexes of tSH2PM and tSH2UN shown in Figure 5(C). Remarkably, there are no outliers in Δδ values in stark contrast to all other pairwise comparisons, including the unligated states of these two proteins [Fig. 5(A)]. The lack of outliers in the distribution in Figure 5(C) is not a result of fewer resonances [96 in Fig. 5(C) vs. 130 in Fig. 5(A)]; the same behavior is observed in chemical‐shift difference plots limited to the 84 residues sufficiently resolved in all the 12 states included for this study (Fig. S3). This behavior is further illustrated with overlays of the 15N‐HSQC spectra (Fig. 6). A zoomed in the region of the spectra of unligated proteins (left panel) shows a number of peaks with different chemical shifts for tSH2UN and tSH2PM, while these peaks for the ITP‐bound proteins (right panel) become nearly degenerate, even in the case of G249, which is substantially shifted upon ITP binding. The underlying conformational differences reflected in the observed SH2 domain resonances (structural or dynamic) between unphosphorylated tSH2UN and tSH2PM with negatively charged IA appear to no longer be present in the ITP‐bound state. In contrast, there are numerous outlier Δδ values in the comparison of ITP‐bound states for tSH2FX and tSH2UN [Fig. 5(D)]. Thus, the conformational changes introduced by replacing IA with a totally flexible linker (tSH2FX) cannot be rescued by ITP binding.
Figure 6.

Overlay of the 2D 15N1H TROSY HSQC spectra for tSH2UN and tSH2PM in the unligated (left) or ITP‐bound (right) state. Spectra were recorded at 298 K with 0.3 mM protein alone or in the presence of 0.6 mM ITP. Resonances labeled in black have bigger chemical shift differences between tSH2UN and tSH2PM in the unligated state than in the ITP‐bound state.
The chemical shift differences in the IHP‐bound state of tSH2PM or tSH2FX relative to tSH2UN were also determined to consider the monofunctional binding process of a pYXX(I/L) cassette binding independently to an SH2 domain. Chemical shift changes are observed for resonances from both SH2 domains upon addition of either N‐IHP or C‐IHP, and thus it is clear that IHP peptides bind both SH2 domains.24 Only the association of the SH2 corresponding to the head‐to‐tail binding [see Fig. 1(A)] is relevant for considering single‐SH2 binding effects in comparison with bifunctional dp‐ITAM binding, so only Δδ values corresponding to (N)SH2 binding C‐IHP and (C)SH2 binding N‐IHP are shown for analysis of the IHP chemical shift changes in Figure 5. Examination of panels E and F comparing the IHP bound states finds a number of outliers (red diamonds) for both tSH2PM and tSH2FX relative to tSH2UN. Comparison with panels A and B, respectively, finds that many of the outliers for the bound‐states are also present in the free‐state as outliers. Further, these outliers are not from residues with large CSP values characteristic of binding ITP [Figs. 3(A) and S2). Together, the data suggest that these large Δδ values occur from structural perturbations arising from the altered linker state rather than binding. We investigate this possibility further in the next section.
Difference of chemical shift differences (ΔΔδ) reveal the tSH2 linker state affects ITP but not IHP binding
We sought to separate Δδ signals due to IA‐caused conformational perturbations that occur in the unligated state from those that result from a disparate binding response. There are several common resonances that appear as outliers in a given row of Figure 5, which suggests many of the large Δδ values observed in Figure 5(D–F) reflect structural differences in the ligand‐free state rather than perturbations caused by binding. To examine this possibility further, we analyzed the difference in chemical‐shift differences, ΔΔδ = ΔδBOUND − ΔδFREE, where ΔδBOUND and ΔδFREE are the chemical shift difference between two tSH2 forms in a bound state and the ligand‐free state, respectively. ΔΔδ would effectively remove ligand‐free state conformational perturbations if they simply carry over unchanged to the bound state.
The ΔΔδ values for tSH2UN compared with tSH2PM and to tSH2FX are shown in Figure 7, where the value plotted in Figure 7 is the difference between two values in Figure 5 panels indicated in the upper right corner. The analysis is restricted to the 84 resonances that are observed in all 12 tSH2 states to ensure the same residues are compared in all cases. It is clear from the narrow distribution with no outliers in Figure 7(C,D) that binding the IHP peptides does not induce chemical shift differences for these SH2 residues beyond what is present in the free state; the distributions of ΔΔδ values are centered at zero and do not extend beyond 0.05 ppm (1HN dimension) or 0.35 ppm (15N dimension) in magnitude. By contrast, the ΔΔδ distributions for binding ITP [Figure 7(A,B)] indicate there are chemical shift differences beyond what appears in the free state; the distributions of ΔΔδ values are broader and with outliers. Moreover, these outliers are from Y63, G77, G78, G97, and G230, residues that have high CSP values indicative of binding ITP (Figs. 3 and S2). These data together suggest that conformational changes induced by binding ITP depend on the linker state (e.g., Y130 phosphorylation or fully‐disrupted linker), while binding an IHP to a single SH2 domain is not sensitive to linker state.
Figure 7.

Difference of chemical shift differences (ΔΔδ) to remove perturbations present in the unligated states from the bound state observations. Each plot is the difference between the two plots in Figure 5 indicated in the upper right corner. The ΔΔδ values are for either ITP (A and B) or IHP (C and D) binding, and compare tSH2UN to either tSH2PM (A and C) or tSH2FX (B and D). Color code and bin sizes are the same as Figure 5. The analysis includes resonances (n = 84) that are defined in all 12 HSQC spectra, and thus common to three protein forms in all four states to ensure a consistent comparison.
Chemical shift differences (Δδ) imply SH2‐SH2 interactions in the ITP complex of tSH2UN and tSH2 PM but not tSH2 FX
We looked for conformational effects reflected by chemical shifts that might result from bifunctional binding and not from an individual pYXX(I/L) cassette of IHPs binding SH2. We, therefore, examined the chemical shift differences of each tSH2 protein ligated with either ITP or IHP: Δδ = δ(tSH2i/ITP) − δ(tSH2i/IHP).
As shown in Figure 8(C), the distributions of Δδ values are narrow and compact for tSH2FX binding with ITP versus IHPs; all values are within the range of [−0.05, 0.05] ppm for 1HN dimension and [−0.35, 0.35] ppm for 15N dimension. These data suggest no substantial inter‐domain effects for tSH2FX binding ITP.
Figure 8.

Chemical shift differences (Δδ) for a given tSH2 protein binding to ITP with two pYXX(I/L) cassettes versus binding to IHP with one cassette. These differences are for binding with tSH2UN (A), tSH2PM (B), or tSH2FX (C). Color code and bin sizes are the same as Figure 5. Residues shown are the common set (n = 84) among all three proteins in all four states to minimize bias.
In contrast, the distribution of Δδ values is wider for tSH2UN or tSH2PM binding ITP versus IHPs [Fig. 8(A,B), respectively], and a small number of outlier resonances exist. Interestingly, the outliers – G230, Y243, and S244 – are in the SH2–SH2 interface or the (C)SH2 specificity pocket; G230 is also adjacent to K231, which in the crystal structure forms a salt bridge to the C‐terminal pY of ITP bound in (N)SH2. These data suggest that ITP binding tSH2UN or tSH2PM does cause detectable perturbations on the SH2–SH2 interface. The fact that this perturbation occurs only during tSH2UN and tSH2PM but not tSH2FX binding with ITP implies that even though the SH2 domains are partly decoupled in tSH2PM,21, 24 SH2–SH2 interactions appear to exist in tSH2PM–ITP complex.
Entropy is the major cause of the decreased tSH2 binding affinity after Y130 phosphorylation
The lack of substantial differences in the SH2‐domain chemical shifts between the ITP‐bound states of tSH2UN and tSH2PM [Fig. 5(C)] suggests that the binding interactions of Syk with the receptor dp‐ITAM are highly similar whether or not Y130 is phosphorylated, and even though the conformational ensembles vary between unligated tSH2UN and tSH2PM given the differences in chemical shift [Fig. 5(A)]. Without effects on binding interactions, an enthalpic basis for the allosteric regulation of Syk‐receptor association by IA phosphorylation [Fig. 2(B,C)] is questionable. To specifically determine the thermodynamic basis for reduced affinity upon Y130 phosphorylation, the association between tSH2 constructs and ITP was characterized using isothermal titration calorimetry (ITC).
The ITC titration curves for the three forms of tSH2 binding ITP show only one apparent binding process with a stoichiometry number near unity (an example is shown in Fig. S4 for tSH2PM titrated with ITP). Accordingly, the ITC data must be reconciled in view of the two‐step binding process in Figure 2 required to adequately fit the titration data in the NMR lineshape analysis of tSH2 association with dp‐ITAM.24 The reconciliation is shown in Figure 9 comparing the two‐step process, and associated thermodynamic parameters for the NMR analysis [Fig. 9(A)], with the one‐step process and apparent parameters obtained from ITC [Fig. 9(B)]. Unlike the residue‐level resolution achieved for titrations followed by NMR spectral changes, ITC is unable to discriminate the formation of the single‐site and two‐site ligated forms as the readout contains unresolvable signals from both binding steps. The interpretation of the ITC data and apparent thermodynamic values in terms of the microscopic parameters is outlined below with Eqs. (1)–(7).
Figure 9.

The microscopic 3‐state binding process supported by NMR lineshape analysis is reconciled with the apparent 2 state binding from ITC data for the interactions between tSH2 constructs and ITP. (A) The microscopic 3 state process including thermodynamic parameters for intermolecular binding (K CN) and isomerization () required for global fitting of NMR titration data for multiple resonances from the two SH2 domains (Ref. 24). (B) The apparent 2 state binding relevant for interpreting the ITC titration curves.
The microscopic binding parameters for the two‐step process [Fig. 9(A)] were determined previously from the global fitting of multiple resonances from the two SH2 domains.24 In the first step of the kinetic model, ligand‐free tSH2 protein, NC, binds inter‐molecularly to the N‐terminal pYXX(I/L) cassette of free dp‐ITAM, L, through the (C)SH2 domain to form the monofunctional complex, NCN; in the second step, the (N)SH2 domain binds intra‐molecularly to the C‐terminal pYXX(I/L) cassette through isomerization to form the bifunctional complex, N′C′.24 K CN and are the equilibrium dissociation constant and equilibrium isomerization constant for the first and second binding steps, respectively,
| (1) |
| (2) |
The total protein (Ptotal) and ligand (Ltotal) concentrations (both free and bound states) are
| (3) |
| (4) |
and are the enthalpy changes for the intermolecular binding and isomerization steps, respectively. By the nature of isomerization, the second binding step does not depend on ligand concentration, and thus the monofunctional complex, NCN, and the bifunctional complex, N′C′, form at the constant ratio defined by .
Nevertheless, the 3‐state model cannot be used directly to fit the ITC titration curves, which show only one apparent binding process with a stoichiometry number near unity (Fig. S4). The ITC data were, therefore, fit to a pseudo 2‐state binding model [Fig. 9(B)], in which the bound state is a mixture of NCN and N′C′, and the binding stoichiometry is unity. Thus, the macroscopic apparent equilibrium dissociation constant K App is
| (5) |
The apparent enthalpy change of the pseudo 2‐state binding model, , is a function of and . A process to form 1 unit of N′C′ will also form unit of NCN and consume unit of NC and thus
| (6) |
Similarly, the corresponding apparent entropy change is
| (7) |
The apparent equilibrium dissociation constants were estimated from the binding curves fitted to the ITC data for each tSH2 form binding ITP. The parameters for a single SH2 domain binding one pYXX(I/L) cassette were also determined. As shown in Table 1, the tSH2 affinity for ITP depends on the state of linker A: K App is 27 ± 7 nM for tSH2UN, 1.4 ± 0.1 μM for tSH2PM, and 1.6 ± 0.1 μM for tSH2FX.The isolated SH2 domains showed lower affinities in binding with IHPs; K d ranges from 24 ± 3 to 190 ± 20 μM. In line with the conclusions from the previous NMR titration analysis,24 the data in Table 1 indicate that the binding between tSH2PM and dp‐ITAM is bifunctional because the binding affinity of tSH2PM with ITP is significantly higher (>10‐fold) than any of the single‐domain binding affinities. Further, the first step of tSH2 interaction with dp‐ITAM is likely through the C‐terminal SH2 domain interaction with the N‐terminal pYXX(I/L) cassette because this association has the highest affinity among all single‐domain binding processes. Comparing with the reported corresponding binding affinities from NMR analysis,24 these K d values are systematically lower by two‐ to three‐fold while the relative relationships are the same; this difference may be caused by the lower ionic strength of the ITC buffer (0.10 M for ITC buffer; 0.13 M for NMR buffer; see Methods section); a greater affinity at lower ionic strength is predicted based on the reported role of electrostatic interactions in SH2 domain recognition.16
Table 1.
Apparent Thermodynamics Parameters Determined from ITC Data Fitted with a 2‐State Modela
| Protein | Peptide | K App (μM) | (kcal/mol) | (kcal/mol) | (cal/mol/deg) |
|---|---|---|---|---|---|
| tSH2UN | ITP | 0.027 ± 0.007 | −15 ± 1 | −4.6 ± 0.2 | −15 ± 1 |
| tSH2PM | ITP | 1.4 ± 0.1 | −16 ± 1 | −7.8 ± 0.2 | −26 ± 1 |
| tSH2FX | ITP | 1.6 ± 0.1 | −16 ± 1 | −8.3 ± 0.1 | −28 ± 1 |
| Protein | Peptide |
K
d
(μM) |
ΔH°
(kcal/mol) |
TΔS°
(kcal/mol) |
ΔS°
(cal/mol/deg) |
| N‐SH2b | N‐IHP | 190 ± 20 | −2.5 ± 0.1 | 2.6 ± 0.2 | 8.6 ± 0.6 |
| N‐SH2b | C‐IHP | 130 ± 10 | −6.5 ± 0.4 | −1.2 ± 0.4 | −3.9 ± 1.4 |
| C‐SH2c | N‐IHP | 24 ± 3 | −5.8 ± 0.5 | 0.50 ± 0.43 | 1.7 ± 1.4 |
| C‐SH2c | C‐IHP | 100 ± 30 | −7.3 ± 0.9 | −1.8 ± 1.1 | −6.1 ± 3.5 |
All ITC tests were performed at 25°C and 1 atm. Estimates are shown as mean ±SD of the fitted values from at least two independent experiments; see Methods section for details. The stoichiometry numbers are between 0.9 and 1.1 for all tests. The estimates are for either the apparent macroscopic 2‐state binding of ITP to tSH2 constructs (Eqs. (5)–(7)), or the actual 2‐state binding of IHP to the isolated SH2 domains.
Isolated N‐terminal SH2 domain of Syk, residues Ser 8 to Gly 117.
Isolated C‐terminal SH2 domain of Syk, residues His 162 to Gln 264.
The apparent binding enthalpy and entropy were also determined for all interactions (Table 1). Notably, the apparent enthalpy changes of the three tSH2 constructs (tSH2UN, tSH2PM, and tSH2FX) for binding with ITP are similar (−15 ± 1, −16 ± 1, and − 16 ± 1 kcal/mol, respectively). By contrast, the apparent binding entropies differ substantially (−15 ± 1, −26 ± 1, and − 28 ± 1 cal/mol/deg for tSH2UN, tSH2PM, and tSH2FX, respectively). Comparing with tSH2UN, both tSH2PM and tSH2FX have a higher entropic penalty in binding ITP. These data indicate that entropy is the major cause for the decreased binding affinity of Syk tSH2 with dp‐ITAM when Y130 is phosphorylated. To gain more insight into the effects of the linker status on binding affinity, we turn to the microscopic 3‐state model.
The microscopic thermodynamics parameters for the isomerization step of the 3‐state model for tSH2 binding ITP peptide [Fig. 9(A)] can be calculated from the apparent thermodynamic parameters of the 2‐state ITC model assuming the first step of bifunctional binding is approximated by C‐SH2 binding N‐IHP, as done previously.24 If K App and K CN are known, the equilibrium isomerization constant, , can be calculated from Eqs. (1)–(5) as
| (8) |
If , , and are known, can be calculated from Eq. (6) as
| (9) |
Similarly,
| (10) |
Parameter values for the first binding step (K CN, , and ) are assumed for all three tSH2 forms to equal those of the isolated C‐SH2 binding N‐IHP.24 The resulting thermodynamic parameters for isomerization to bind the second site in the three tSH2 forms from Eqs. (8)–(10) are shown in Table 2.
Table 2.
Thermodynamics Parameters Calculated Using Eqs. (8)–(10) for the Isomerization Step in the Microscopic 3‐State Model of tSH2 Binding to ITP Peptidea
| Protein | Peptide |
(10−3) |
(kcal/mol) |
(kcal/mol) |
(cal/mol/deg) |
|---|---|---|---|---|---|
| tSH2UN | ITP | 1.2 ± 0.3 | −9.1 ± 0.6 | −5.1 ± 0.5 | −17 ± 2 |
| tSH2PM | ITP | 61 ± 8 | −11 ± 1 | −8.9 ± 0.5 | −30 ± 2 |
| tSH2FX | ITP | 73 ± 9 | −11 ± 1 | −9.4 ± 0.4 | −32 ± 1 |
Thermodynamic parameters are shown as value ±SD calculated with Eqs. (8)–(10) and error propagation functions. Values for K CN, , and for the first‐step, inter‐molecular binding, are from Table 1 for the isolated C‐SH2 binding with N‐IHP and are assumed to be the same for all three tSH2 proteins with alternative forms of the IA linker.
The results in Table 2 find that the introduction of a negative charge on IA increases the free energy for the isomerization step due to a higher entropic penalty for binding the second pYXX(I/L) cassette. The equilibrium of the isomerization step becomes less favorable in the direction of the bifunctional complex N′C′ for either tSH2PM ( = [61 ± 8] × 10−3) or tSH2FX ( = [73 ± 9] × 10−3) than it is for tSH2UN ( = [1.2 ± 0.3] × 10−3). The increased free energy of the isomerization step for tSH2PM and tSH2FX is due to the entropy associated with the second step ( = −17 ± 2, −30 ± 2, and − 32 ± 1 cal/mol/deg for tSH2UN, tSH2PM and tSH2FX, respectively), while the isomerization enthalpy is the same within the error limits for all forms of tSH2.
Additivity of ITP binding
Characterization of the two‐step binding process [Fig. 9(A)] invites consideration of the additivity of the binding free energy for the bifunctional association of ITP. Additivity is assessed by comparing the free energy of binding ITP to the intrinsic binding of the component parts, N‐IHP and C‐IHP, to the isolated SH2 domain. Any departure from additivity is expressed in terms of a “connection free energy”,45
| (11) |
With the assumption supported by the global analysis of NMR lineshapes24 that the free energy for the first step equals that of the isolated C‐SH2 binding N‐IHP, the connection free energy of the bifunctional binding for the tSH2–ITP complexes becomes the difference in the equilibrium for N‐SH2 binding C‐IHP and the isomerization step for binding ITP:
| (12) |
The results in Table 3 find that ITP binding to the unphosphorylated tSH2UN is close to additive with only about 10‐fold increase in the combined dissociation constants (27 ± 8 vs. 3.0 ± 0.4 nM) and a small (1.3 ± 0.9 kcal/mol). The departure from additivity is greater for tSH2PM and tSH2FX as expected from the reduced affinity when IA conformation is altered. Interestingly, in all three cases, the departure from additivity arises from opposing entropic and enthalpic contributions; it is the result of an entropic penalty for isomerization that is greater than a favorable gain in the enthalpy for bifunctional binding. The unfavorable cannot result from overall rotation/translation, and likely arises from configurational entropy. The formation of inter‐domain binding contacts of tSH2 relative to two isolated SH2 domains is a potential source of the favorable .
Table 3.
Departure from Thermodynamic Additivity for Bifunctional Binding of tSH2. Connection Thermodynamic Parameters for ITP Binding to the tSH2 Proteins from the Difference of the Equilibria for Isolated SH2 Domains Binding IHPs and tSH2 Proteins Binding ITP.a
|
|
|||||
|---|---|---|---|---|---|
| C‐SH2/N‐IHP + N‐SH2/C‐IHP | 3.0 ±0.4 nM | ||||
|
|
(kcal/mol) | T (kcal/mol) | (kcal/mol) | ||
| tSH2UN/ITP | 27 ± 8 nM | −2.6 ± 0.7 | −3.9 ± 0.6 | 1.3 ± 0.9 | |
| tSH2PM/ITP | 1.4 ± 0.3 μM | −4.1 ± 0.7 | −7.7 ± 0.6 | 3.6 ± 0.9 | |
| tSH2FX/ITP | 1.7 ± 0.3 μM | −4.5 ± 0.6 | −8.2 ± 0.6 | 3.7 ± 0.9 |
Conclusion
Results presented here from NMR chemical shift differences and binding thermodynamic measurements elucidate the allosteric mechanism for regulating the association of Syk with receptor ITAMs due to phosphorylation of Y130, a site remote to the dp‐ITAM binding regions [Fig. 1(A)]. The introduction of negative charge in the IA domain linking the two SH2 domains of Syk was found to decrease affinity for receptor dp‐ITAM by imposing an entropic penalty to binding, with essentially no effect on the energy of binding. Such an entropy‐based mechanism, absent of enthalpic contributions, suggests that intermolecular contacts are unchanged by phosphorylation, in distinct contrast to other protein–protein interactions regulated by phosphorylation. The entropic penalty can be rationalized to be an increase in the disorder of the inter‐domain structure imposed on the conformational ensemble of Syk tSH2 by Y130 phosphorylation. Bifunctional association of dp‐ITAM, with a specific separation of the pYXX(I/L) cassettes that must occupy a site on each SH2 domain, would impose conformational restraints on SH2 inter‐domain structure and greater loss of entropy when Y130 is phosphorylated. The conclusion that conformational entropy from disorder in the inter‐domain structure is a major contribution to the difference in binding entropy derives in part from prior knowledge that Y130 phosphorylation changes the hydrodynamic radius, rotational tumbling times or relative orientation of the SH2 domains,21, 24 and that the increase in binding free energy can be attributed to the isomerization step for second‐site binding [Fig. 2(A)].24 Further, the entropy of the bifunctional process for binding dp‐ITAM clearly includes contributions beyond that of the intermolecular association of the two pYXX(I/L) cassettes given that TΔS° is considerably less favorable for ITP (−4.6 to −8.3 kcal/mol, Table 1) than for either of the half‐sized peptides, N‐IHP or C‐IHP (0.5 or − 1.2 kcal/mol, Table 1). Thus, Y130 phosphorylated Syk likely exhibits greater disorder in the relative SH2–SH2 displacement and orientation than unphosphorylated Syk, yet order in the inter‐domain structure is imposed upon bifunctional binding of dp‐ITAMs to a similar degree independent of the linker state. Absent of Y130 phosphorylation, Syk tandem SH2 domains are more tightly coupled with an inter‐domain structure primed for bifunctional dp‐ITAM binding, and, therefore, a smaller loss of entropy occurs than Syk phosphorylated at Y130 in IA.
The mechanism by which Y130 phosphorylation affects Syk association with receptor dp‐ITAM is unlike previously described mechanisms for controlling protein function by phosphorylation. No change in the binding enthalpy when residue 130 is negatively charged suggests that phosphorylation does not affect intermolecular contacts, unlike what is commonly observed upon protein phosphorylation of numerous proteins.46 That phosphorylation does not alter Syk binding interactions is further supported by the negligible differences between the chemical shifts of the observed resonances of tSH2UN/ITP and tSH2PM/ITP shown in Figure 5(C). Protein phosphorylation has been recognized to regulate binding or enzymatic catalysis through a variety of conformational changes that affect intermolecular interactions, and, in some cases, enzyme catalytic efficiency.46, 47 The mechanisms for the function of protein phosphorylation can be summarized as either creating or destroying the recognition site, either with or without a change in structure induced by phosphorylation. By contrast, the nearly identical chemical shifts [Fig. 5(C)] and the negligible binding enthalpy difference (Table 1) for ITP complexes of tSH2UN and tSH2PM suggest the direct contacts of Syk SH2 domains with the two binding cassettes of receptor ITAMs are unchanged by Y130 phosphorylation.
Insightful and subtle variations in the response of Syk to binding ITAM depending on the state of the IA linker were observed from the chemical shift analysis of the tSH2 resonances. Covariance and differences in the 1HN and 15N components of the HSQC spectra were compared for unligated and ligated tSH2UN relative to tSH2PM, or relative to tSH2FX. Most interesting is the comparison of tSH2UN and tSH2PM to consider the effect of Y130 phosphorylation. We found that even though there are large differences in chemical shifts in the unligated state from residues that occur at the SH2‐SH2 interface [Fig. 5(A,B)], as mentioned above, binding a dp‐ITAM peptide diminishes the chemical shift differences of the observed SH2 resonances between unphosphorylated tSH2UN and tSH2PM with a negatively charged IA linker [Figs. 5(C) and S3]. Moreover, the fully flexible linker of tSH2FX does not have this capability to fully recapture the dp‐ITAM bound conformation of unphosphorylated tSH2 to the extent reflected in SH2 domain resonances [Figs. 5(D) and S3). An additional observation is that the conformational differences in the unbound states reported by chemical shifts carry into the IHP‐bound states with essentially no further differences detected due to binding a single pYXX(I/L) cassette to an SH2 domain [Fig. 7(C,D)].
Methods
Plasmid construction
The details for constructing Syk tSH2UN, tSH2PM, tSH2FX, and N‐SH2 plasmids are described in previous publications.21, 24 Briefly, cDNA encoding murine Syk tandem SH2 domains (Ser 8 to Gln 264) was cloned into pET‐30a(+) vector (Novagen). tSH2UN is the wild‐type sequence. tSH2PM was constructed using QuikChange™ Site‐Directed Mutagenesis Kit (Stratagene) to mutate Y130 to glutamate. The construct tSH2FX has interdomain A (Phe 119 to His 162) replaced with a flexible 20‐amino‐acid linker, (GGS)3GS(GGS)3, as described.24 cDNAs encoding N‐SH2 (Ser 8 to Gly 117) plus an N‐terminal (His)6 tag and TEV cleavage site, or C‐SH2 (His 162 to Gln 264) were cloned into pET‐30a(+) vectors (Novagen). All plasmids are deposited in the non‐profit repository Addgene (Cambridge, MA) with the following plasmid#: 111269 (tSH2UN), 111271 (tSH2PM), 111272 (tSH2FX), 111274 (N‐SH2), and 111419 (C‐SH2).
Protein expression and purification
The expression and purification procedures are described in previous publications.21, 24 Briefly, all constructs were expressed in Escherichia coli strain Rosetta 2 (DE3) (Novagen). Cells were grown to an OD600 reading of 1.0–1.3 at 37°C in M9 minimal medium containing 15N‐labeled NH4Cl. Protein expression was initiated with 1 mM IPTG and cells were transferred to 18°C. After 18–20 h, cells were harvested by centrifugation and stored at −20°C. The total soluble protein in cells was collected by French press lysis (three passes) and ultracentrifugation (40,000 rpm, 40 min, and 4°C) to remove the insoluble fraction. The proteins expressed from the three tSH2 constructs and C‐SH2 were purified with a phosphotyrosine–agarose affinity column where elution was by using a linear gradient of buffer B (buffer A: 50 mM Tris, pH 8.0, 0.02% NaN3, 5 mM DTT; buffer B: buffer A plus 1 M NaCl). N‐SH2 protein was purified with a HisTrap HP affinity column (GE Healthcare), followed by His‐tag cleavage with His‐tagged AcTEV protease (Invitrogen), and further purified with the HisTrap HP affinity column.
Sample preparation
After purification, the proteins were concentrated to 0.8–1.0 mM with an Amicon Ultra‐15 Centrifugal Filter Unit (Millipore), and then dialyzed extensively against NMR buffer (50 mM sodium phosphate, pH 7.5, 5 mM dithiothreitol (DTT), and 0.02% NaN3) or ITC buffer (10 mM HEPES, pH 7.0, 100 mM NaCl, 1 mM TCEP, and 0.02% NaN3) at 4°C. The protein concentration of N‐SH2 was determined by a Bradford assay kit (Thermo Scientific) due to the lack of tryptophan residues; the concentration of the other constructs was estimated from UV absorbance at 280 nm with extinction coefficients calculated by ExPASy ProtParam48 (tSH2UN: 34380, tSH2PM: 32890, tSH2FX: 27390, C‐SH2: 16960 M−1 cm−1). The purity of samples was >95% based on SDS/PAGE analysis. The protein samples were ∼0.3 mM for NMR titration experiments and 0.02–0.1 mM for ITC experiments.
The three peptides, ITP (Ac‐PD(pY)EPIRKGQRDL(pY)SGLNQR‐NH2), N‐IHP (Ac‐PD(pY)EPIRKG‐NH2), and C‐IHP (Ac‐QRDL(pY)SGLNQR‐NH2), were purchased from EZBiolab. The purity of all peptides was >95% based on HPLC. The peptides were dissolved in pure water and the pH was adjusted to 7. For NMR experiments, the dissolved peptides were dialyzed extensively against pure water, measured for concentration, aliquoted, lyophilized, and stored at −20°C before use; For ITC experiments, the peptides were extensively dialyzed against ITC buffer, measured for concentration, and stored at 4°C before use. The concentrations of peptides were estimated based on UV absorbance at 267 nm with extinction coefficients from the literature (ITP: 1304, IHPs: 652 M−1 cm−1).16
NMR data collection and analysis
NMR data were collected on a Bruker Avance‐III‐800 equipped with a 5 mm TXI Z‐gradient probe at 298 K. A protein sample (∼0.3 mM) was sequentially mixed with aliquots of lyophilized peptide until saturation, and the chemical shifts were monitored by 2D 15N1H TROSY HSQC experiments with 2048 points in the 1H dimension and 256 points in the 15N dimension. All NMR experiments were performed at least two times.
The raw NMR spectra were processed by NMRPipe49 and visualized by SPARKY 3.113 (T. D. Goddard and D. G. Kneller, University of California, San Francisco, CA). Peaks were assigned according to our previously published data.21, 24 The peak information was exported to data files; the data were processed and visualized with R.50 The views of structures were generated with PyMOL.51 The CSP value for each residue between the ligand‐free and ITP‐bound states was calculated as
CSP =
where the coefficients are based on the ratio of the average variances of the amide proton and nitrogen chemical shifts observed for the 20 common amino acid residues from the deposited information of proteins in the BioMagResBank.52, 53
ITC data collection and analysis
ITC experiments were performed using a MicroCal iTC200 (Malvern Instruments). A protein sample was loaded into the cell (200 μL) while a peptide sample was loaded into the syringe (40 μL). The tested binding systems have estimated K d values in a diverse range24 (sub‐micromolar or micromolar for the tSH2 constructs, and tens or hundreds of micromolar for the isolated SH2 domains). The concentrations of protein samples (0.02 mM for tSH2UN; 0.05 mM for tSH2PM; 0.1 mM for tSH2FX, N‐SH2, and C‐SH2) were selected such that the c values ([P]total/K d) were approximately between 1 and 1000 (preferentially around 40 when possible) to have optimal curve fittings.54, 55, 56 The peptide solutions were 0.2–5 mM. The final molar ratio of peptide:protein was between 2 and 12 depending on the estimated binding affinity such that the titration curve can reach close to the saturation state. The number of injections was between 18 and 36 such that there are sufficient points in the intermediate region of the titration curve for reliable curve fitting. All ITC experiments were independently performed at least two times.
The raw ITC data were processed with the MATLAB‐based program NITPIC for peak‐shape analysis and then fitted with SEDPHAT to an apparent two‐state binding model to obtain the equilibrium dissociation constant, the enthalpy, and the stoichiometry of binding.57, 58 Parameters of the isomerization step for the tSH2 constructs were calculated with home‐written scripts in R.50 See Figure S5 for the simulated changes of concentrations of each species during ITC tests for tSH2 constructs binding with ITP using the 3‐state binding model.
Supporting information
Figure S1. Residue conservation assessment for Syk tandem SH2 domains. (A) Distributions of #Types and Max Occurrence for residue positions in Syk tSH2UN (murine residue number 8–264). Bin size is 2% for the Max Occurrence dimension. (B) The residue positions with #Types ≤3 and Max Occurrence ≥90% (the boxed region in Fig. S1A) are considered as conserved and are mapped on the crystal structure (PDB ID 1A81 Chain A) in purple.
Figure S2. Chemical shift perturbation (CSP) profile of three Syk tSH2 forms (tSH2 UN , tSH2 PM , and tSH2 FX ) binding with three ITAM peptides (ITP, N‐IHP, and C‐IHP). Each CSP profile is plotted similarly as Figure 3A. “L/P” denotes the final total concentration ratio of ligand vs. protein. Raw chemical shifts are listed in Appendix B.
Figure S3. Chemical shift differences (Δδ) using only common residues. Differences are between tSH2UN and either tSH2PM (A, C, and E) or tSH2FX (B, D, and F) in the ligand‐free state (A and B), ITP‐bound state (C and D), or IHP‐bound state (E and F). For each pair, the Δδ values are plotted in the same way as Figure 5 except that the residues are the COMMON set (n = 84) among all three proteins in all four states. These plots are to further confirm that the difference between tSH2PM and tSH2UN is smaller in the ITP‐bound state than in the ligand‐free state or IHP‐bound state, as shown by the higher population in the near‐zero region and narrower width of distribution of Δδ values for the ITP‐bound state.
Figure S4. Isothermal titration calorimetry data for titration of tSH2PM (0.05 mM) with ITP injected from a 0.5 mM solution. (A) Raw data. (B) The integrated heat, fitted curve, and residuals determined with NITPIC and SEDPHAT. See Methods for details.
Figure S5. The simulated concentration changes of each species during ITC tests for different tSH2 constructs binding ITP using the 3‐state binding model. The total protein concentration is 20, 50, and 100 μM for tSH2UN, tSH2PM, and tSH2FX, respectively. The equilibrium dissociation constant, K CN, is assumed to be similar as that for the isolated C‐SH2 binding N‐IHP (24 μM; see Table 1). The isomerization constant, K′ N, is from the calculated values in Table 2.
Appendix A. Types of Variations for Each Residue of Syk tSH2UN in Different Species
Appendix B. Amide Chemical Shifts of the Three tSH2 Constructs
Acknowledgment
We thank Ms. Nina Gorenstein for constructing tSH2FX, N‐SH2, and C‐SH2. Part of this work was supported by NIH R01GM039478 (awarded to CBP), and a research grant from Purdue Research Foundation and McKeehan fellowship from Purdue College of Pharmacy (both awarded to CF).
References
- 1. Geahlen R (2009) Syk and pTyr'd: signaling through the B cell antigen receptor. Biochim Biophys Acta Mol Cell Res 1793:1115–1127. [DOI] [PMC free article] [PubMed] [Google Scholar]
- 2. Geahlen RL (2014) Getting Syk: spleen tyrosine kinase as a therapeutic target. Trends Pharmacol Sci 35:414–422. [DOI] [PMC free article] [PubMed] [Google Scholar]
- 3. Mócsai A, Ruland J, Tybulewicz VLJ (2010) The SYK tyrosine kinase: a crucial player in diverse biological functions. Nat Rev Immunol 10:387–402. [DOI] [PMC free article] [PubMed] [Google Scholar]
- 4. Lowell CA (2011) Src‐family and Syk kinases in activating and inhibitory pathways in innate immune cells: signaling cross talk. Cold Spring Harb Perspect Biol 3:a002352–a002352. [DOI] [PMC free article] [PubMed] [Google Scholar]
- 5. Efremov DG, Laurenti L (2011) The Syk kinase as a therapeutic target in leukemia and lymphoma. Expert Opin Investig Drugs 20:623–636. [DOI] [PubMed] [Google Scholar]
- 6. Krisenko MO, Geahlen RL (2015) Calling in SYK: SYK's dual role as a tumor promoter and tumor suppressor in cancer. Biochim Biophys Acta Mol Cell Res 1853:254–263. [DOI] [PMC free article] [PubMed] [Google Scholar]
- 7. Wang W‐H, Childress MO, Geahlen RL (2014) Syk interacts with and phosphorylates nucleolin to stabilize Bcl‐x(L) mRNA and promote cell survival. Mol Cell Biol 34:3788–3799. [DOI] [PMC free article] [PubMed] [Google Scholar]
- 8. Krisenko MO, Higgins RL, Ghosh S, Zhou Q, Trybula JS, Wang W‐H, Geahlen RL (2015) Syk is recruited to stress granules and promotes their clearance through autophagy. J Biol Chem 290:27803–27815. [DOI] [PMC free article] [PubMed] [Google Scholar]
- 9. Ghosh S, Geahlen RL (2015) Stress granules modulate SYK to cause microglial cell dysfunction in Alzheimer's disease. EBioMedicine 2:1785–1798. [DOI] [PMC free article] [PubMed] [Google Scholar]
- 10. Fütterer K, Wong J, Grucza RA, Chan AC, Waksman G (1998) Structural basis for Syk tyrosine kinase ubiquity in signal transduction pathways revealed by the crystal structure of its regulatory SH2 domains bound to a dually phosphorylated ITAM peptide. J Mol Biol 281:523–537. [DOI] [PubMed] [Google Scholar]
- 11. Cambier JC (1995) New nomenclature for the Reth motif (or ARH1/TAM/ARAM/YXXL). Immunol Today 16:110. [DOI] [PubMed] [Google Scholar]
- 12. Reth M (1989) Antigen receptor tail clue. Nature 338:383–384. [PubMed] [Google Scholar]
- 13. Gold MR, Matsuuchi L, Kelly RB, DeFranco AL (1991) Tyrosine phosphorylation of components of the B‐cell antigen receptors following receptor crosslinking. Proc Natl Acad Sci USA 88:3436–3440. [DOI] [PMC free article] [PubMed] [Google Scholar]
- 14. Kumaran S, Grucza RA, Waksman G (2003) The tandem Src homology 2 domain of the Syk kinase: a molecular device that adapts to interphosphotyrosine distances. Proc Natl Acad Sci USA 100:14828–14833. [DOI] [PMC free article] [PubMed] [Google Scholar]
- 15. Bu JY, Shaw AS, Chan AC (1995) Analysis of the interaction of ZAP‐70 and syk protein‐tyrosine kinases with the T‐cell antigen receptor by plasmon resonance. Proc Natl Acad Sci USA 92:5106–5110. [DOI] [PMC free article] [PubMed] [Google Scholar]
- 16. Grucza RA, Bradshaw JM, Mitaxov V, Waksman G (2000) Role of electrostatic interactions in SH2 domain recognition: salt‐dependence of tyrosyl‐phosphorylated peptide binding to the tandem SH2 domain of the Syk kinase and the single SH2 domain of the Src kinase. Biochemistry 39:10072–10081. [DOI] [PubMed] [Google Scholar]
- 17. Chen T, Repetto B, Chizzonite R, Pullar C, Burghardt C, Dharm E, Zhao Z, Carroll R, Nunes P, Basu M, Danho W, Visnick M, Kochan J, Waugh D, Gilfillan AM (1996) Interaction of phosphorylated FcεRIγ immunoglobulin receptor tyrosine activation motif‐based peptides with dual and single SH2 domains of p72syk. Assessment of binding parameters and real time binding kinetics. J Biol Chem 271:25308–25315. [DOI] [PubMed] [Google Scholar]
- 18. Ottinger EA, Botfield MC, Shoelson SE (1998) Tandem SH2 domains confer high specificity in tyrosine kinase signaling. J Biol Chem 273:729–735. [DOI] [PubMed] [Google Scholar]
- 19. de Mol NJ, Catalina MI, Dekker FJ, Fischer MJE, Heck AJR, Liskamp RMJ (2005) Protein flexibility and ligand rigidity: a thermodynamic and kinetic study of ITAM‐based ligand binding to Syk tandem SH2. ChemBioChem 6:2261–2270. [DOI] [PubMed] [Google Scholar]
- 20. Keshvara LM, Isaacson C, Harrison ML, Geahlen RL (1997) Syk activation and dissociation from the B‐cell antigen receptor is mediated by phosphorylation of tyrosine 130. J Biol Chem 272:10377–10381. [DOI] [PubMed] [Google Scholar]
- 21. Zhang Y, Oh H, Burton R, Burgner J, Geahlen R, Post C (2008) Tyr130 phosphorylation triggers Syk release from antigen receptor by long‐distance conformational uncoupling. Proc Natl Acad Sci USA 105:11760–11765. [DOI] [PMC free article] [PubMed] [Google Scholar]
- 22. Grädler U, Schwarz D, Dresing V, Musil D, Bomke J, Frech M, Greiner H, Jäkel S, Rysiok T, Müller‐Pompalla D, Wegener A (2013) Structural and biophysical characterization of the Syk activation switch. J Mol Biol 425:309–333. [DOI] [PubMed] [Google Scholar]
- 23. Arias‐Palomo E, Recuero‐Checa MA, Bustelo XR, Llorca O (2007) 3D structure of Syk kinase determined by single‐particle electron microscopy. Biochim Biophys Acta 1774:1493–1499. [DOI] [PMC free article] [PubMed] [Google Scholar]
- 24. Feng C, Post CB (2016) Insights into the allosteric regulation of Syk association with receptor ITAM, a multi‐state equilibrium. Phys Chem Chem Phys 18:5807–5818. [DOI] [PMC free article] [PubMed] [Google Scholar]
- 25. Petit CM, Zhang J, Sapienza PJ, Fuentes EJ, Lee AL (2009) Hidden dynamic allostery in a PDZ domain. Proc Natl Acad Sci USA 106:18249–18254. [DOI] [PMC free article] [PubMed] [Google Scholar]
- 26. Motlagh HN, Wrabl JO, Li J, Hilser VJ (2014) The ensemble nature of allostery. Nature 508:331–339. [DOI] [PMC free article] [PubMed] [Google Scholar]
- 27. Louet M, Seifert C, Hensen U, Gräter F (2015) Dynamic allostery of the catabolite activator protein revealed by interatomic forces. PLOS Comput Biol 11:e1004358. [DOI] [PMC free article] [PubMed] [Google Scholar]
- 28. Rolli V, Gallwitz M, Wossning T, Flemming A, Schamel WWA, Zürn C, Reth M (2002) Amplification of B cell antigen receptor signaling by a Syk/ITAM positive feedback loop. Mol Cell 10:1057–1069. [DOI] [PubMed] [Google Scholar]
- 29. Neumeister EN, Zhu Y, Richard S, Terhorst C, Chan AC, Shaw AS (1995) Binding of ZAP‐70 to phosphorylated T‐cell receptor zeta and eta enhances its autophosphorylation and generates specific binding sites for SH2 domain‐containing proteins. Mol Cell Biol 15:3171–3178. [DOI] [PMC free article] [PubMed] [Google Scholar]
- 30. Williamson MP (2013) Using chemical shift perturbation to characterise ligand binding. Prog Nucl Magn Reson Spectrosc 73:1–16. [DOI] [PubMed] [Google Scholar]
- 31. Schumann FH, Riepl H, Maurer T, Gronwald W, Neidig K‐P, Kalbitzer HR (2007) Combined chemical shift changes and amino acid specific chemical shift mapping of protein–protein interactions. J Biomol NMR 39:275–289. [DOI] [PubMed] [Google Scholar]
- 32. Stark J, Powers R (2008) Rapid protein−ligand costructures using chemical shift perturbations. J Am Chem Soc 130:535–545. [DOI] [PubMed] [Google Scholar]
- 33. Ward JM, Gorenstein NM, Tian J, Martin SF, Post CB (2010) Constraining binding hot spots: NMR and molecular dynamics simulations provide a structural explanation for enthalpy‐entropy compensation in SH2‐ligand binding. J Am Chem Soc 132:11058–11070. [DOI] [PMC free article] [PubMed] [Google Scholar]
- 34. Chen C‐H, Martin VA, Gorenstein NM, Geahlen RL, Post CB (2011) Two closely spaced tyrosines regulate NFAT signaling in B cells via Syk association with Vav. Mol Cell Biol 31:2984–2996. [DOI] [PMC free article] [PubMed] [Google Scholar]
- 35. Chen C‐H, Piraner D, Gorenstein NM, Geahlen RL, Beth Post C (2013) Differential recognition of syk‐binding sites by each of the two phosphotyrosine‐binding pockets of the Vav SH2 domain. Biopolymers 99:897–907. [DOI] [PMC free article] [PubMed] [Google Scholar]
- 36. Liu J, Zhang J, Gong Q, Xiong P, Huang H, Wu B, Lu G, Wu J, Shi Y (2011) Solution structure of tandem SH2 domains from Spt6 protein and their binding to the phosphorylated RNA polymerase II C‐terminal domain. J Biol Chem 286:29218–29226. [DOI] [PMC free article] [PubMed] [Google Scholar]
- 37. Günther UL, Liu Y, Sanford D, Bachovchin WW, Schaffhausen B (1996) NMR analysis of interactions of a phosphatidylinositol 3′‐kinase SH2 domain with phosphotyrosine peptides reveals interdependence of major binding sites. Biochemistry 35:15570–15581. [DOI] [PubMed] [Google Scholar]
- 38. Yoakim M, Hou W, Songyang Z, Liu Y, Cantley L, Schaffhausen B (1994) Genetic analysis of a phosphatidylinositol 3‐kinase SH2 domain reveals determinants of specificity. Mol Cell Biol 14:5929–5938. [DOI] [PMC free article] [PubMed] [Google Scholar]
- 39. Günther UL, Weyrauch B, Zhang X, Schaffhausen B (2003) Nuclear magnetic resonance structure of the P395S mutant of the N‐SH2 domain of the p85 subunit of PI3 kinase: An SH2 domain with altered specificity. Biochemistry 42:11120–11127. [DOI] [PubMed] [Google Scholar]
- 40. Selvaratnam R, Chowdhury S, VanSchouwen B, Melacini G (2011) Mapping allostery through the covariance analysis of NMR chemical shifts. Proc Natl Acad Sci USA 108:6133–6138. [DOI] [PMC free article] [PubMed] [Google Scholar]
- 41. Roy A, Post CB (2012) Detection of long‐range concerted motions in protein by a distance covariance. J Chem Theory Comput 8:3009–3014. [DOI] [PMC free article] [PubMed] [Google Scholar]
- 42. Roy A, Post CB (2012) Long‐distance correlations of rhinovirus capsid dynamics contribute to uncoating and antiviral activity. Proc Natl Acad Sci USA 109:5271–5276. [DOI] [PMC free article] [PubMed] [Google Scholar]
- 43. Li H, Yamada H, Akasaka K (1998) Effect of pressure on individual hydrogen bonds in proteins. Basic pancreatic trypsin inhibitor. Biochemistry 37:1167–1173. [DOI] [PubMed] [Google Scholar]
- 44. DeRose EF, Darden T, Harvey S, Gabel S, Perrino FW, Schaaper RM, London RE (2003) Elucidation of the ε−θ subunit interface of Escherichia coli DNA polymerase III by NMR spectroscopy. Biochemistry 42:3635–3644. [DOI] [PubMed] [Google Scholar]
- 45. Jencks WP (1981) On the attribution and additivity of binding energies. Proc Natl Acad Sci USA 78:4046–4050. [DOI] [PMC free article] [PubMed] [Google Scholar]
- 46. Nishi H, Shaytan A, Panchenko AR (2014) Physicochemical mechanisms of protein regulation by phosphorylation. Front Genet 5:270. [DOI] [PMC free article] [PubMed] [Google Scholar]
- 47. Johnson LN, Lewis RJ (2001) Structural basis for control by phosphorylation. Chem Rev 101:2209–2242. [DOI] [PubMed] [Google Scholar]
- 48. Wilkins MR, Gasteiger E, Bairoch A, Sanchez JC, Williams KL, Appel RD, Hochstrasser DF (1999) Protein identification and analysis tools in the ExPASy server. Methods Mol Biol 112:531–552. [DOI] [PubMed] [Google Scholar]
- 49. Delaglio F, Grzesiek S, Vuister GW, Zhu G, Pfeifer J, Bax A (1995) NMRPipe: a multidimensional spectral processing system based on UNIX pipes. J Biomol NMR 6:277–293. [DOI] [PubMed] [Google Scholar]
- 50. Core R Team R: a language and environment for statistical computing. Vienna, Austria: R Foundation for Statistical Computing; 2014. Available from: http://www.r-project.org/
- 51.Schrödinger, LLC (2015) The PyMOL Molecular Graphics System, Version 1.8.
- 52. Mulder FA, Schipper D, Bott R, Boelens R (1999) Altered flexibility in the substrate‐binding site of related native and engineered high‐alkaline Bacillus subtilisins. J Mol Biol 292:111–123. [DOI] [PubMed] [Google Scholar]
- 53. Seavey BR, Farr EA, Westler WM, Markley JL (1991) A relational database for sequence‐specific protein NMR data. J Biomol NMR 1:217–236. [DOI] [PubMed] [Google Scholar]
- 54. Wiseman T, Williston S, Brandts JF, Lin LN (1989) Rapid measurement of binding constants and heats of binding using a new titration calorimeter. Anal Biochem 179:131–137. [DOI] [PubMed] [Google Scholar]
- 55. Turnbull WB, Daranas AH (2003) On the value of c: can low affinity systems be studied by isothermal titration calorimetry? J Am Chem Soc 125:14859–14866. [DOI] [PubMed] [Google Scholar]
- 56. Broecker J, Vargas C, Keller S (2011) Revisiting the optimal c value for isothermal titration calorimetry. Anal Biochem 418:307–309. [DOI] [PubMed] [Google Scholar]
- 57. Keller S, Vargas C, Zhao H, Piszczek G, Brautigam CA, Schuck P (2012) High‐precision isothermal titration calorimetry with automated peak‐shape analysis. Anal Chem 84:5066–5073. [DOI] [PMC free article] [PubMed] [Google Scholar]
- 58. Houtman JCD, Brown PH, Bowden B, Yamaguchi H, Appella E, Samelson LE, Schuck P (2007) Studying multisite binary and ternary protein interactions by global analysis of isothermal titration calorimetry data in SEDPHAT: application to adaptor protein complexes in cell signaling. Protein Sci 16:30–42. [DOI] [PMC free article] [PubMed] [Google Scholar]
Associated Data
This section collects any data citations, data availability statements, or supplementary materials included in this article.
Supplementary Materials
Figure S1. Residue conservation assessment for Syk tandem SH2 domains. (A) Distributions of #Types and Max Occurrence for residue positions in Syk tSH2UN (murine residue number 8–264). Bin size is 2% for the Max Occurrence dimension. (B) The residue positions with #Types ≤3 and Max Occurrence ≥90% (the boxed region in Fig. S1A) are considered as conserved and are mapped on the crystal structure (PDB ID 1A81 Chain A) in purple.
Figure S2. Chemical shift perturbation (CSP) profile of three Syk tSH2 forms (tSH2 UN , tSH2 PM , and tSH2 FX ) binding with three ITAM peptides (ITP, N‐IHP, and C‐IHP). Each CSP profile is plotted similarly as Figure 3A. “L/P” denotes the final total concentration ratio of ligand vs. protein. Raw chemical shifts are listed in Appendix B.
Figure S3. Chemical shift differences (Δδ) using only common residues. Differences are between tSH2UN and either tSH2PM (A, C, and E) or tSH2FX (B, D, and F) in the ligand‐free state (A and B), ITP‐bound state (C and D), or IHP‐bound state (E and F). For each pair, the Δδ values are plotted in the same way as Figure 5 except that the residues are the COMMON set (n = 84) among all three proteins in all four states. These plots are to further confirm that the difference between tSH2PM and tSH2UN is smaller in the ITP‐bound state than in the ligand‐free state or IHP‐bound state, as shown by the higher population in the near‐zero region and narrower width of distribution of Δδ values for the ITP‐bound state.
Figure S4. Isothermal titration calorimetry data for titration of tSH2PM (0.05 mM) with ITP injected from a 0.5 mM solution. (A) Raw data. (B) The integrated heat, fitted curve, and residuals determined with NITPIC and SEDPHAT. See Methods for details.
Figure S5. The simulated concentration changes of each species during ITC tests for different tSH2 constructs binding ITP using the 3‐state binding model. The total protein concentration is 20, 50, and 100 μM for tSH2UN, tSH2PM, and tSH2FX, respectively. The equilibrium dissociation constant, K CN, is assumed to be similar as that for the isolated C‐SH2 binding N‐IHP (24 μM; see Table 1). The isomerization constant, K′ N, is from the calculated values in Table 2.
Appendix A. Types of Variations for Each Residue of Syk tSH2UN in Different Species
Appendix B. Amide Chemical Shifts of the Three tSH2 Constructs