Abstract
Six of the ten leading causes of death in the United States, including cancer, diabetes, and heart disease, can be directly linked to diet. Dietary intake, the process of determining what someone eats during the course of a day, provides valuable insights for mounting intervention programs for prevention of many of the above chronic diseases. Measuring accurate dietary intake is considered to be an open research problem in the nutrition and health fields. In this paper we compare two techniques to estimating food portion size from images of food. The techniques are based on 3D geometric models and depth images. An expectation-maximization based technique is developed to detect the reference plane in depth images, which is essential for portion size estimation using depth images. Our experimental results indicate that volume estimation based on geometric model is more accurate for objects with well-defined 3D shapes compared to estimation using depth images.
Keywords: 3D Reconstruction, Geometric Model, Structured Light, Depth Image, Food Portion Estimation
1. INTRODUCTION
Due to the growing concern of chronic diseases and other health problems related to diet, there is a need to develop accurate methods to estimate individual’s food and energy intake. Measuring accurate dietary intake is considered to be an open research problem in the nutrition and health fields. Our previous study [1] has shown the use of image based dietary assessment can improve the accuracy and reliability of estimating food and energy consumption. We have developed a mobile dietary assessment system, the Technology Assisted Dietary Assessment (TADA) system [2, 3] to automatically determine the food types and energy consumed by a user using image analysis techniques [4, 5]. To date our work has focused on the use of a single image for food portion size estimation [6] to reduce user burden from having to take multiple images of their food [1]. Portion size estimation is the process of determining how much food (in cm3 or grams) is present in the food image.
Food volume estimation (also known as portion size estimation or portion estimation) is a challenging problem as food preparation and consumption process can pose large variations in food shape and appearance. Several image analysis based techniques have been developed for food portion estimation. 3D features are not fully exploited in some of the existing works. In [7] food portion estimation is done via pre-determined serving size classification. In [8] the food image area and the user’s thumb are used as reference for estimation the portion size and in [9] the pixels in each corresponding food segment are counted to determine the portion. To better analyze the food eating scene, other methods attempt to recover 3D parameters of the scene including the use of mobile 3D range finding [10] and stereo vision techniques using multiple images [11, 12, 13]. We feel that either modifying the mobile device or acquiring multiple images of the eating scene is not desirable for users trying to collect information about their diets. Furthermore, a point cloud obtained from a few images using feature based stereo matching is sparse that cannot represent fine details on surfaces that are necessary with food images. Thus, we have focused in our work on techniques that use single images for food portion size estimation [6].
Estimating the volume of an object from a single view is an ill posed inverse problem that requires the use of a priori information. The existing work using single images include the use of pre-defined 3D template matching [14, 15], using prior knowledge of the geometric model [6] and depth map prediction based using a Convolutional Neural Network (CNN) [16, 17]. Template matching using pre-defined 3D models involves manual tuning of model parameters which can cause scaling problems [14, 15]. The points search technique in 3D coordinates does not require manual tuning of parameters [6] hence scaling with many foods will not be an issue. Depth map prediction using CNN requires sufficient images as training data and depth sensors that provide sufficient details.
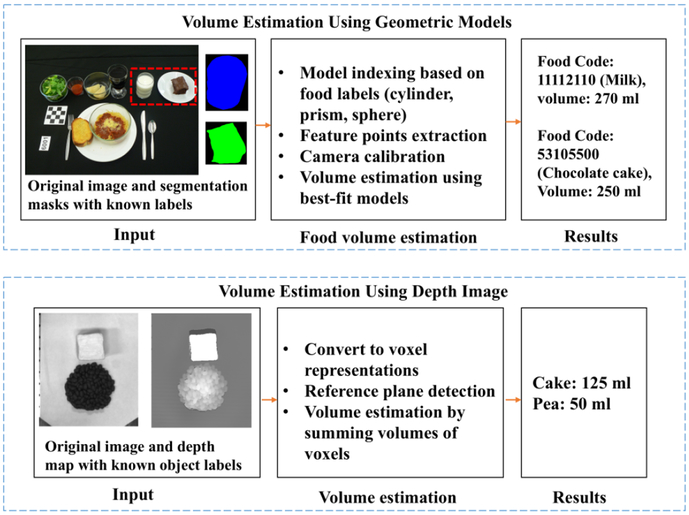
In this paper we examine food portion size estimation accuracy using geometric models and depth images as shown in Figure 1. The use of geometric models allow for volume estimation where we can use the food label to index into a class of pre-defined geometric models for single view portion size estimation. To acquire high quality depth maps, we use a structured light technique known as digital fringe projection [18]. The digital fringe projection technique is a special type of triangulation-based structured light method where variations in pattern intensity are sinusoidal. We adopt the binary defocusing method and phase-shifting-based fringe analysis technique for 3D shape measurement because of their high speed, high resolution, and high accuracy. In a phase-shifting technique, the sinusoidal fringe patterns are shifted spatially from frame to frame with a known phase shift. Analyzing a set of phase-shifted fringe images yields the wrapped phase, a distortion measurement, usually containing 2π discontinuities that are removed by employing a temporal phase-unwrapping algorithm [19]. The (x, y, z) coordinates are recovered from the unwrapped phase using the system parameters estimated from system calibration [20]. We were able to obtain the depth map based on the (x, y, z) coordinates recovered.
Fig. 1:
Food Portion Size Estimation Using Geometric Models and Depth Images.
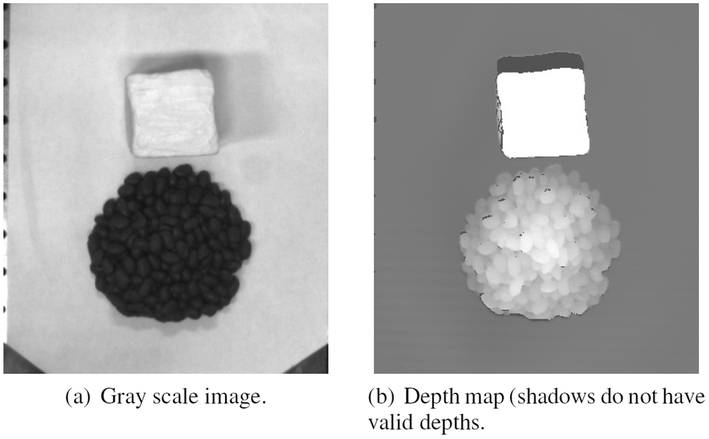
To best represent the 3D scene, we used an over-head view when acquiring the depth images. To estimate the volume for each food object from a depth image a reference plane is required such as the table surface. To detect the table surface, we developed an expectation-maximization (EM) [21, 22] based technique so that intra-class variations (such as different textures shown in Figure 2(a)) on the reference plane can be incorporated. To validate the two approaches we compared the estimated volume of the same objects using the two methods to the ground-truth information.
Fig. 2:
Gray scale image and the corresponding depth map.
2. FOOD PORTION SIZE ESTIMATION
Volume estimation based on a single-view image is an ill-posed problem since most 3D information has been lost during the projection process from the 3D world coordinates to the 2D pixel coordinates. The use of prior knowledge such as “container shapes” allows for volume estimation since we only need to estimate some parameters instead of reconstructing the 3D scene. Another approach is to utilize the depth information, where depth value is determined with respect to the camera sensor plane. The depth image is first converted to a voxel representation, then the volume for each object can be obtained by summing the voxels that belong to the same object [16].
The reference plane is critical for estimating volume using voxel representation since the height of each voxel cannot be determined without a reference plane. RANSAC [23] is used for reference plane detection in [16]. To use RANSAC, three parameters need to be specified for each task namely the error tolerance rate, the number of subsets to try and a threshold value. Furthermore, the intra-class variations on reference plane cannot be properly incorporated as RANSAC is designed to eliminate the outliers for estimation task. Instead of using RANSAC, our reference plane detection is based on the expectation-maximization (EM) [21, 22] with Gaussian mixture models (GMM) [24].
2.1. Portion Estimation Using Geometric Models
Since no single geometric model is suitable for all types of food, the use of geometric models with correct food classification label and segmentation mask in the image is important so that the food label can be used to index into a suitable class of pre-defined geometric models. The task then becomes finding the correct parameters for the selected geometric model.
For example, the most commonly used containers that have significant 3D structure either can be modeled as cylinders or can be approximated to be cylinders. For a cylinder, only radius and height are required to estimate the volume. Instead of reconstructing the cylinders, we designed an iterative point search technique to estimate the essential parameters which carry sufficient information for volume estimation. This is described in more detail in one of our previous papers [6]. The iterative point search technique is based on projecting points from world coordinates to pixel coordinates, where the projection process is made possible using camera intrinsic and extrinsic parameters [25]. The point search process minimize the projection errors of points of interest in 3D world coordinates onto estimated 2D image coordinates [6]. Similar to the cylinder model, a sphere model can be used for object such as apple.
For foods served in non-rigid shapes or do not have significant 3D structures, we use the prism model. The prism model is an area-based model assuming the height is the same for the entire horizontal cross-section [26]. An accurate food area can be obtained by removing the projective distortion in the image. The projective transformation matrix can be estimated using the Direct Linear Transform (DLT) technique based on the estimated corners and known correspondence pattern [27].
2.2. Portion Size Estimation Using Depth Images
The depth maps, along with the grayscale images, are captured using a 3D sensor system designed by [19]. The depth map contains the distances of points on object’s surfaces to the camera sensor. The depth map is converted to voxel representation. We denote the set of all voxels where for each voxel: . For a known food image segmentation mask from the grayscale image, each voxel vp can be associated with an object label: lq for , where is the set of all object labels in the depth image. We use the mapping process: to determine which label lq is the voxel vp associated with. Assume widthp and lengthp are the size of the base area of voxel vp, if the heightp is known, then the voxel volume can be determined. The volume Vlq associated with each label lq can than be obtained:
| (1) |
The above estimation is based on the assumption we can align the voxel grid on the reference plane (e.g., table surface). If the reference surface cannot be correctly detected, we would not be able to obtain the volume for each voxel (the height for each voxel will be unknown).
2.3. Reference Plane Detection
Detecting the reference plane can be viewed as a clustering task. The goal is to cluster all pixels into two subsets: which is associated with the reference plane, and which contains the rest. A Gaussian distribution is assumed for modeling the distribution of samples in and . Such an assumption is made upon the characteristics of distribution of pixel and depths values. If the parameters for the Gaussian mixtures are known, we can cluster the pixels into different subsets.
Expectation-maximization (EM) can be used to estimate the above GMM parameters [21, 22]. EM has been used for image segmentation using multiple image features [28]. Our image features are the depth map and the grayscale pixels. An example of grayscale image of the scene is shown in Figure 2(a). The corresponding depth map associated with the grayscale image is shown in Figure 2(b). We have noticed that for a small portion of regions, valid depth values cannot be obtained due to the shadows generated by the structured light pattern projector.
We combine pixel and depth feature for surface detection. We denote the depth at image coordinates (i, j) where is the set contains all valid depths. The size of the set is N. Denote the as the vectorized representation of . We construct a vector consists of pixel values: , The set of all observations could then be obtained as: where each observation is denoted as: yn ∈ Y, n = {1, ⋯, N}.
We assume the observations are sampled from multivariate Gaussian mixtures which consist of K components where the parameters θk for each component is unknown, k ∈ {1, ⋯, K}. The task would then be to estimate the parameters Θ = {θ1, ⋯, θK} based on observations yn ∈ Y. Θ can be estimated recursively using the EM [22].
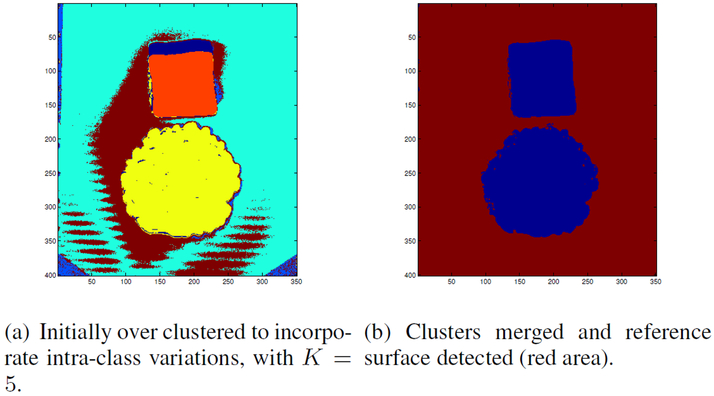
To better incorporate the intra-class variations we use K > 2 for table surface detection. We set K = 5 to over cluster the pixels initially, as shown in Figure 3(a). We then merge the clusters based on the Euclidean distance of θk using k-means. The reference plane can be detected based on the mean and variance of depth in a segment, as shown in Figure 3(b). Given the reference plane we can now estimate the height for each voxel, and the object’s volume.
Fig. 3:
Reference plane detection with combined features using EM.
3. EXPERIMENTAL RESULTS
We compare the estimated volumes of the same objects using the two methods to the ground-truth information. The ground truth volume for each object is obtained using water displacement [29]. We use 10 objects for testing, as listed in Table 1. Except for the paper cup, these objects are selected from NASCO food replicas made with plastic/rubber. The 9 plastic food replicas are selected to represent different shapes and features.
Table 1:
Comparison of volume estimation using geometric models and depth maps.
| Food | Va(ml) | Ndb |
μ ± SD |
Ngc |
μ ± SD |
|---|---|---|---|---|---|
| 1 – Apple | 275 | 11 | 332±29 | 36 | 252±57 |
| 2 – Banana | 200 | 11 | 183±29 | 19 | 197±26 |
| 3 – Cake | 125 | 11 | 160±28 | 17 | 127±20 |
| 4 – Bean | 100 | 11 | 124±16 | 19 | 98±10 |
| 5 – Pea | 50 | 10 | 64±29 | 17 | 50±6 |
| 6 – Sausage | 75 | 10 | 108±14 | 17 | 77±8 |
| 7 – Pear | 180 | 11 | 241±20 | 17 | 186±51 |
| 8 – Chicken | 80 | 9 | 95±13 | 17 | 83±13 |
| 9 – Bread | 100 | 10 | 111±40 | 19 | 101±11 |
| 10 – Cup | 450 | 23 | 1056±80 | 36 | 553±115 |
Water displacement
Nd is the number of images used for depth-based estimation
Ng is the number of images used for geometric model-based estimation
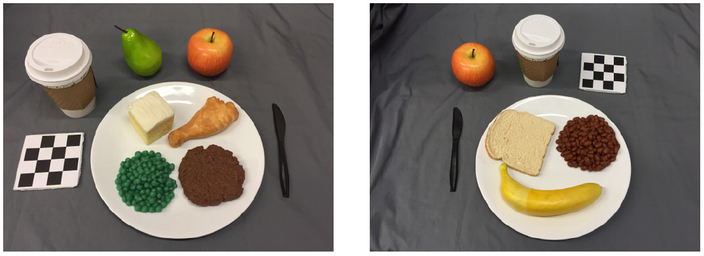
For the geometric models, we acquire test images using the TADA system [3] on an mobile device (an iPhone 6) as shown in Figure 4. Each test images contains 5 – 7 objects from the objects listed in Table 1. We vary the layouts of the objects in the scene and the angles used to capture the images. A total of 36 test images with different combinations are captured. To avoid the errors propagated from automatic segmentation and classification, we use ground-truth segmentation masks and food labels, then compute the volume for each object as shown in Table 1 using the appropriate geometric model.
Fig. 4:
Sample test images captured using mobile device for geometric models-based portion estimation.
For food portion size estimation using depth maps, we were able to acquire the depth images using a structured light system at Purdue University, more specifically using the digital fringe projection technique. Digital fringe projection (DFP) techniques have been extensively used for high-quality 3D shape measurement due to their speed, accuracy, and flexibility [30, 18]. The system we used is able to obtain a root-mean-square error of about 73 μm with a calibration volume of 150 mm (height) × 250 mm (width) × 200 mm (depth) [20]. Since a grayscale image associated with depth map is available, we can obtain the pixel-wise alignment of the image with the depth map. For our system, we were able to obtain grayscale images and depth map at the resolution of 640 × 480 pixels. It is challenging to use structured light to reconstruct the 3D shape of an object with a large range of reflectivity. For our dataset we avoid using NASCO food replicas whose surfaces cannot be properly reconstructed due to issue cause by reflectivity. We converted the depth map into voxel representations based on the detection of the table surface. Similar to the test images acquired using mobile device, we use different layouts and combinations of objects. Each image contains 1–3 objects. We use ground truth label for each segment. The volume estimated using the depth map: can than be obtained as shown in Table 1.
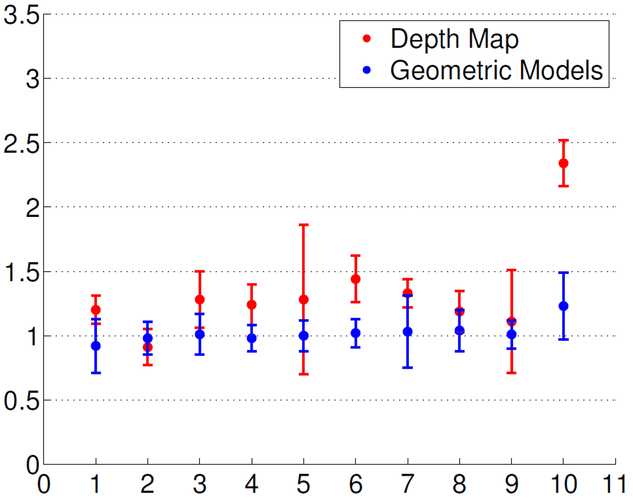
Based on our experimental results, we observed that the volume estimation using a depth map has a tendency to overestimate the food portion size. We observed that 9 out of 10 test objects are overestimated, the coffee cup has a ratio of estimate to ground truth of 2.34 on average. The single image approach cannot fully represent the 3D shape since parameters on the surfaces that are not visible cannot be recovered. Hence there exists shape ambiguity in 3D coordinates. However, if we use the prior knowledge of the 3D shape, such as the cylinder model, we can obtain significantly better estimation for objects such as “cup”. Similarly, for “apple”, if we use a sphere model the volume estimates are better than those estimated using depth maps. We used the prism model for the other objects. As shown in Figure 5, we were able to obtain more accurate estimates using geometric models with well-defined 3D shapes compared to estimation using depth images. The number 1 – 10 on the horizontal axis in Figure 5 represents foods listed in Table 1.
Fig. 5:
Comparison of the ratios of the estimate to ground truth. 1 – 10 on the horizontal axis represents foods listed in Table 1. A value ‘> 1’ indicates the volume is overestimated, where a value ‘< 1’ indicates the volume is underestimated.
4. CONCLUSION
In this paper, we presented a comparison of food portion estimation using two techniques: geometric models and depth images. We were able to obtain more accurate volume estimations using geometric models for objects whose 3D shape can be well-defined. We have noticed a tendency of over estimation using depth map. We plan to extend our datasets and more objects will be covered including real food items.
Acknowledgments
This work was partially sponsored by a grant from the US National Institutes of Health under grant NIEH/NIH 2R01ES012459-06. Any opinions, findings, and conclusions or recommendations expressed in this material are those of the author(s) and do not necessarily reflect the views of the US National Institutes of Health.
5. REFERENCES
- [1].Daugherty B, Schap T, Ettienne-Gittens R, Zhu F, Bosch M,Delp E, Ebert D, Kerr D, and Boushey C, “Novel technologies for assessing dietary intake: Evaluating the usability of a mobile telephone food record among adults and adolescents,” Journal of Medical Internet Research, vol. 14, no. 2, p. e58, April 2012. [DOI] [PMC free article] [PubMed] [Google Scholar]
- [2].Six B, Schap T, Zhu F, Mariappan A, Bosch M, Delp E,Ebert D, Kerr D, and Boushey C, “Evidence-based development of a mobile telephone food record,” Journal of American Dietetic Association, vol. 110, pp. 74–79, January 2010. [DOI] [PMC free article] [PubMed] [Google Scholar]
- [3].Zhu F, Bosch M, Woo I, Kim S, Boushey C, Ebert D, and Delp E, “The use of mobile devices in aiding dietary assessment and evaluation,” IEEE Journal of Selected Topics in Signal Processing, vol. 4, no. 4, pp. 756–766, August 2010. [DOI] [PMC free article] [PubMed] [Google Scholar]
- [4].He Y, Xu C, Khanna N, Boushey C, and Delp E, “Analysis of food images: Features and classification,” Proceedings of the IEEE International Conference on Image Processing, pp. 2744–2748, October 2014, Paris, France. [DOI] [PMC free article] [PubMed] [Google Scholar]
- [5].Zhu F, Bosch M, Khanna N, Boushey C, and Delp E, “Multiple hypotheses image segmentation and classification with application to dietary assessment,” IEEE Journal of Biomedical and Health Informatics, vol. 19, no. 1, pp. 377–388, January 2015. [DOI] [PMC free article] [PubMed] [Google Scholar]
- [6].Fang S, Liu C, Zhu F, Delp E, and Boushey C, “Single-view food portion estimation based on geometric models,” Proceedisng of the IEEE International Symposium on Multimedia, December 2015, Miami, FL. [DOI] [PMC free article] [PubMed] [Google Scholar]
- [7].Aizawa K, Maruyama Y, Li H, and Morikawa C, “Food balance estimation by using personal dietary tendencies in a multimedia Food Log,” IEEE Transactions on Multimedia, vol. 15, no. 8, pp. 2176–2185, December 2013. [Google Scholar]
- [8].Pouladzadeh P, Shirmohammadi S, and Almaghrabi R, “Measuring calorie and nutrition from food image,” IEEE Transactions on Instrumentation and Measurement, vol. 63, no. 8, pp. 1947–1956, August 2014. [Google Scholar]
- [9].Zhang W, Yu Q, Siddiquie B, Divakaran A, and Sawhney H, ““Snap-n-Eat”: food recognition and nutrition estimation on a smartphone,” Journal of Diabetes Science and Technology, vol. 9, no. 3, pp. 525–533, April 2015. [DOI] [PMC free article] [PubMed] [Google Scholar]
- [10].Shang J, Duong M, Pepin E, Zhang X, Sandara-Rajan K, Mamishev A, and Kristal A, “A mobile structured light system for food volume estimation,” Proceedings of the IEEE International Conference on Computer Vision Workshops, pp. 100–101, November 2011, Barcelona, Spain. [Google Scholar]
- [11].Puri M, Zhu Z, Yu Q, Divakaran A, and Sawhney H, “Recognition and volume estimation of food intake using a mobile device,” Proceedings of the IEEE Workshop on Applications of Computer Vision, pp. 1–8, December 2009, Snowbird, UT. [Google Scholar]
- [12].Kong F and Tan J, “Dietcam: Automatic dietary assessment with mobile camera phones,” Pervasive and Mobile Computing, vol. 8, pp. 147–163, February 2012. [Google Scholar]
- [13].Dehais J, Shevchik S, Diem P, and Mougiakakou S, “Food volume computation for self dietary assessment applications,” Proceedisng of the IEEE International Conference on Bioinformatics and Bioengineering, pp. 1–4, November 2013, Chania, Greece. [Google Scholar]
- [14].Chen H, Jia W, Li Z, Sun Y, and Sun M, “3D/2D model-to-image registration for quantitative dietary assessment,” Proceedings of the IEEE Annual Northeast Bioengineering Conference, pp. 95–96, March 2012, Philadelphia, PA. [DOI] [PMC free article] [PubMed] [Google Scholar]
- [15].Xu C, He Y, Khannan N, Parra A, Boushey C, and Delp E, “Image-based food volume estimation,” Proceedings of the International Workshop on Multimedia for Cooking & Eating Activities, pp. 75–80, 2013, Barcelona, Spain. [DOI] [PMC free article] [PubMed] [Google Scholar]
- [16].Myers A, Johnston N, Rathod V, Korattikara A, Gorban A,Silberman N, Guadarrama S, Papandreou G, Huang J, andMurphy K, “Im2Calories: towards an automated mobile vision food diary,” Proceedings of the IEEE International Conference on Computer Vision, December 2015, Santiago, Chile. [Google Scholar]
- [17].Eigen D and Fergus R, “Predicting depth, surface normals and semantic labels with a common multi-scale convolutional architecture,” Proceedings of the IEEE International Conference on Computer Vision, December 2015, Santiago, Chile. [Google Scholar]
- [18].Gorthi S and Rastogi P, “Fringe projection techniques: Whither we are?” Optics and Lasers in Engineering, vol. 48, no. 2, pp. 133–140, Feburuary 2010. [Google Scholar]
- [19].Zhang S, “Flexible 3d shape measurement using projector defocusing: extended measurement range,” Optical Letter, vol. 35, no. 7, pp. 934–936, April 2010. [DOI] [PubMed] [Google Scholar]
- [20].Li B, Karpinsky N, and Zhang S, “Novel calibration method for structured-light system with an out-of-focus projector,” Applied Optics, vol. 53, no. 16, pp. 3415–3426, 2014. [DOI] [PubMed] [Google Scholar]
- [21].Baum L, Petrie T, Soules G, and Weiss N, “A maximization technique occurring in the statistical analysis of probabilistic functions of Markov chains,” The Annals of Mathematical Statistics, vol. 41, no. 1, pp. 164–171, 1970. [Google Scholar]
- [22].Moon T, “The expectation-maximization algorithm,” IEEE Signal Processing Magazine, vol. 13, no. 6, pp. 47–60, November 1996. [Google Scholar]
- [23].Fischler M and Bolles R, “Random sample consensus: A paradigm for model fitting with applications to image analysis and automated cartography,” Communications of the ACM, vol. 24, no. 6, pp. 381–395, June 1981. [Google Scholar]
- [24].Yu G, Sapiro G, and Mallat S, “Solving inverse problems with piecewise linear estimators: From Gaussian mixture models to structured sparsity,” IEEE Transactions on Image Processing, vol. 21, no. 5, pp. 2481–2499, May 2012. [DOI] [PubMed] [Google Scholar]
- [25].Zhang Z, “A flexible new technique for camera calibration,” IEEE Transactions on Pattern Analysis and Machine Intelligence, vol. 22, no. 11, pp. 1330–1334, November 2000. [Google Scholar]
- [26].Lee C, Chae J, Schap T, Kerr D, Delp E, Ebert D, and Boushey C, “Comparison of known food weights with image-based portion-size automated estimation and adolescents’ self-reported portion size,” Journal of Diabetes Science and Technology, vol. 6, no. 2, pp. 428–434, March 2012. [DOI] [PMC free article] [PubMed] [Google Scholar]
- [27].Hartley R and Zisserman A, Multiple View Geometry in Computer Vision, 2nd ed Cambridge University Press, 2004. [Google Scholar]
- [28].Belongie S, Carson C, Greenspan H, and Malik J, “Color-and texture-based image segmentation using EM and its application to content-based image retrieval,” Proceedisng of the IEEE International Conference on Computer Vision, pp. 675–682, January 1998, Bombay, India. [Google Scholar]
- [29].Heath T, The works of Archimedes. London, UK: Cambridge University Press, 1897. [Google Scholar]
- [30].Geng J, “Structured-light 3d surface imaging: a tutorial,” Advances in Optics and Photonics, vol. 3, no. 2, pp. 128–160, June 2011. [Google Scholar]


