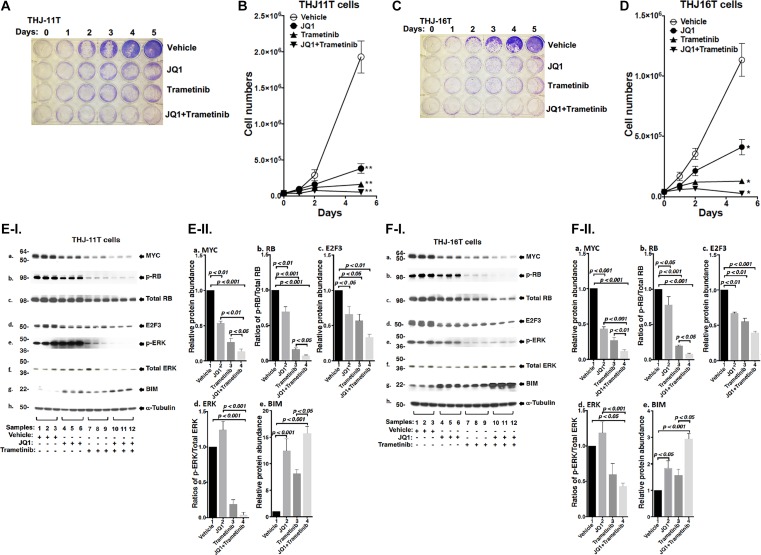
Figure 1. The combined treatment of JQ1 and trametinib completely blocked cell proliferation in the ATC cell lines.
(A and C) Cell proliferation visualized by crystal violet in the THJ-11T cells and THJ-16T cells, respectively. (B and D) Cell proliferation curves for the THJ-11T cells and THJ-16T cells, respectively. *p < 0.05; **p < 0.01. (E and F) Key cell regulators are affected by JQ1, trametinib, and the combined treatment. (E-I) and (F-I) are images of western blot analyses for MYC (a), p-RB (b), total RB (c), E2F3 (d), p-ERK (e), total ERK (f), BIM (g), and α-tubulin (h) as loading controls. Figure (E-II) and (F-II) are the quantification of the band intensities for the comparison among vehicle treatment, JQ1 treatment, trametinib treatment, and combined treatment with JQ1and trametinib in both cell lines (triplicates for each treatment with three independent experiments). The p values are indicated (n = 3).

