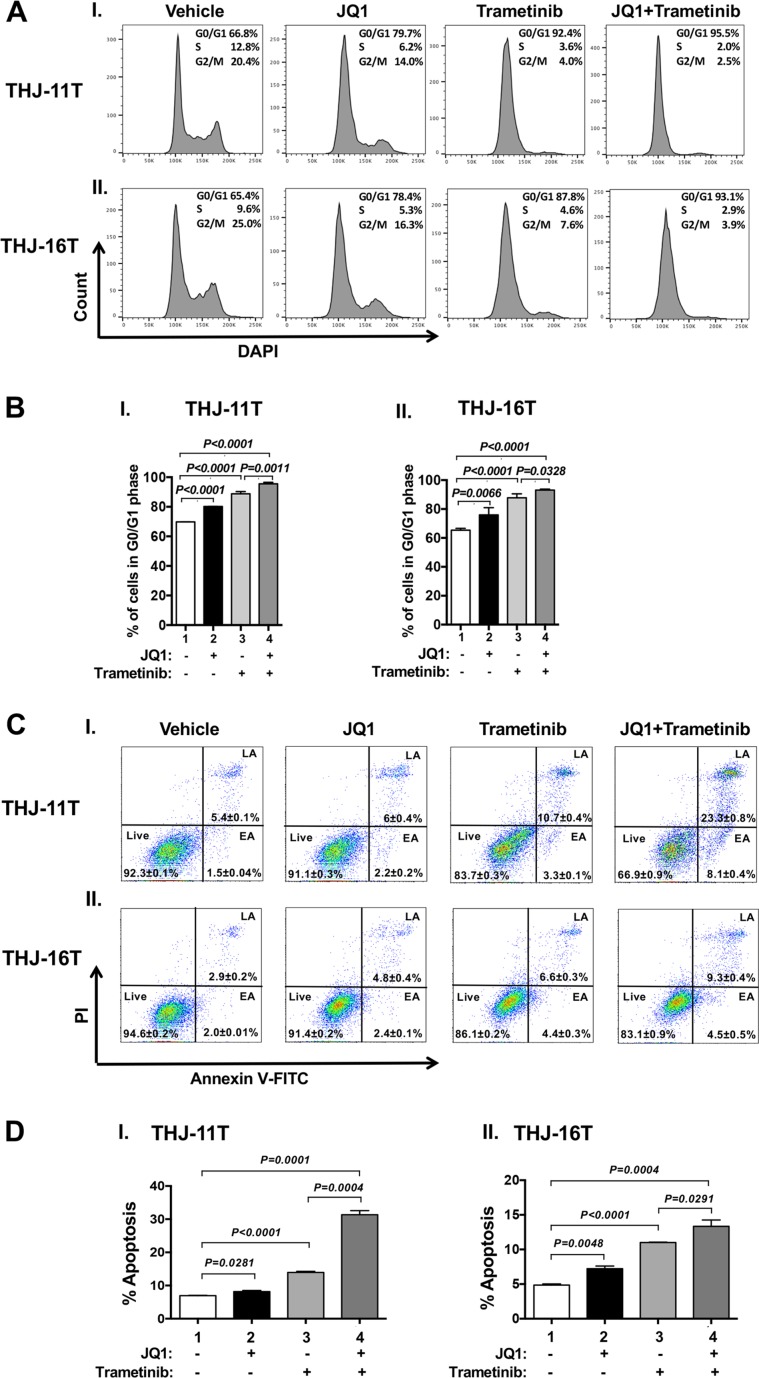
Figure 2.
Effect of JQ1, trametinib, and the combined treatment on cell cycle progression (A and B) or apoptosis (C and D) of ATC cells by cytometric analysis. (A) Cell cycle profiles of THJ-11T (I) and THJ-16T cells (II). The average percentages of cell populations of different cell cycle phases were shown in the upper-right corner. (B) The graphs showed percent of G0/G1 phase for vehicle, JQ1, trametinib and combined treatment JQ1 with trametinib in THJ cell lines. Cell cycle phase was quantified by DAPI staining, followed by FACS analysis in THJ cell lines. Values are shown as means ± SD. (n = 3). (C). THJ-11T (I) and -16T cells (II) were treated with vehicle, JQ, trametinib, and both JQ1 and trametinib for 48 hours. After treatment, cells were collected and subjected to Annexin V and propidium iodide (PI) staining followed by flow cytometric analysis for apoptotic cells. (D) The populations of late and early apoptotic cells were quantified and graphed as shown in (I) and (II) for THJ-11T and -16T cells, respectively. The experiment was done in triplicates. Values are shown as means ± SD. (n = 3).

