

Abstract
Increasingly, three generation studies have investigated intergenerational continuity and discontinuity in substance use and related problem behaviors. However, surprisingly little attention has been paid to the conceptual definition of continuity or to different types of discontinuity (resilience and escalation) or to measurement sensitivity which affects not only the magnitudes of observed continuity but also factors which correlate with this linkage. The present study uses longitudinal data on N=427 parent-child dyads from the Rochester Intergenerational Study to study continuity and discontinuity in substance use over ages 14-18. Results suggest that the degree of intergenerational continuity, resilience and escalation in adolescent substance use, as well as correlates of each, depend heavily on how heterogeneity in the behavior is taken into account.
There is a strong assumption in developmental research of intergenerational continuity in problem behaviors, that is, of similarity in behavioral outcomes within the same family across multiple generations. This assumption has received consistent empirical support with respect to several problem behaviors, including drug and alcohol use (e.g., Pears, Capaldi and Owen 2007; Knight, Menard and Simmons 2014), criminality (e.g., Besemer and Farrington 2012; van de Weijer, Bijleveld and Blokland 2014), externalizing behaviors (Conger, Neppl, Kim, and Scaramella 2003; Thornberry, Freeman-Gallant, Lizotte, Krohn and Smith, 2003; Bailey, Hill, Oesterle and Hawkins, 2009), harsh parenting practices (Neppl, Conger, Scaramella and Ontai 2009; Simons, Whitbeck, Conger and Chiy-In 1991), and child maltreatment (Thornberry and Henry, 2013; Widom, Czaja and DuMont, 2015). The potential yield for identifying and explaining intergenerational linkages is vast. In their review of this literature Serbin and Karp (2004: 357) note that “intergenerational studies of families have a unique potential to inform us about important conceptual, applied, and policy issues. In particular…to understand the processes of risk and resilience that affect our most vulnerable populations.”
Though much of the evidence for intergenerational (IG) transmission of behavior involves cross-sectional samples and/or retrospective data, the study of continuity in behavior has been greatly aided by the advent of studies that collect prospective measures for multiple generations of the same family including parents (typically referred to as Generation 2 or G2), their children (G3), and at times the child’s grandparent (G1). One important advantage of IG studies is their ability to examine continuity in problem behavior that occurs at the same developmental stage for G2 and G3 (Cairns, Cairns, Xie, Leung and Hearne, 1998; Knight et al., 2014; Thornberry 2009). By doing so, IG studies provide a new vantage point for examining both the long-term consequences and distal origins of a given behavior.
IG studies focus on two core research questions. The first is descriptive, that is “how similar (or dissimilar) are parents and children with respect to a particular behavior?” (Thornberry 2016: 572). The second is explanatory, geared towards uncovering processes of mediation and moderation that help explain the degree of similarity in certain behaviors between parent and child. Though there is increasing work devoted to studying the latter question (e.g., Belsky, Conger, Capaldi, 2009; Capaldi, Pears, Patterson and Owen, 2003; Merrick, Leeb and Lee, 2013; Serbin and Stack 1998), there nonetheless remain important unresolved issues with the former, more descriptive question, relating mainly to issues with definition and quantification of what is meant by IG continuity.
One emergent theme is that the very concept of IG continuity is inherently nebulous, as its estimate is often dependent on multiple factors. This issue is particularly important for complex, heterogeneous behaviors where there are different manifestations of involvement in the same underlying behavior. For example, in complex behaviors the age of onset can vary widely across the lifespan, as can the duration of the behavior, patterns of involvement such as persistency versus intermittency, and whether and when individuals desist from the behavior. Also, there can be multiple types of the behavior that are likely to vary in severity and in their clinical and functional consequences to the individual. Complex behaviors with these characteristics include substance use, delinquency and crime, aggression, and certain types of mental illness such as depression and anxiety. For example, substance use compasses brief, experimental use of a single substance as well as chronic abuse or dependence of multiple substances. This heterogeneity is likely to create what we refer to as definitional elasticity. That is, how the complexity of the behavior is modeled has the potential to alter the level of IG continuity observed across studies, hence, what is defined as “continuous” is somewhat elastic. This, in turn, may impact which variables predict continuity and discontinuity.
By way of illustration, consider two studies about IG continuity in adolescent alcohol use. In one study the behavior is very narrowly defined, say binge drinking during middle school. The level of continuity is likely to be relatively low because the base rate is low for both generations and the likelihood of overlap is small. In the second study, the behavior is more broadly defined, say any alcohol use during adolescence. Here, the level of continuity is likely to be higher because the prevalence of the behavior is higher in both generations and chances of overlap between parent and child increases. While both studies provide information on the general question of how much IG continuity there is in alcohol use, they are likely to provide very different estimates of the level of continuity and may also identify different correlates. In general, how researchers account for heterogeneity in substance use leads to different measures which in turn leads to different estimates of continuity. Yet, studies typically use one approach to measurement – selected for the theoretical question under investigation – that leads to one estimate of continuity (and discontinuity). As a result estimates of intergenerational continuity can vary widely across studies, including whether or not there is a significant effect, and that leads to inconsistencies in the IG literature. To this point, scholars have not fully considered the implications of such definitional elasticity in the investigation of IG relationships.
Moreover, there are many dimensions along which definitional elasticity is likely to occur, too many for any single study to investigate all of them. This study, therefore, illustrates the potential impact of such elasticity on conclusions about the level of continuity and discontinuity, and the consistency in the variables that explain it, by focusing on one important dimension– how heterogeneity in the behavior of interest in each generation is taken into account. Using data from the Rochester Intergeneration Study, we show that the degree of IG continuity and discontinuity of adolescent substance use is heavily dependent on how use is measured. We also demonstrate how certain risk and protective factors may or may not be linked to continuity based on how heterogeneity is addressed.
Issues in Measuring Intergenerational Continuity
There are several conceptual gaps in the literature on IG continuity in problem behaviors that limit the formation of a full descriptive picture of the extent of transmission across generations. First, summary measures of IG continuity are typically reported as simple bivariate correlations, usually around ρ=.25, suggesting a moderate degree of continuity in the population. Nagin and Tremblay (2001) argue that using conventional bivariate correlations to summarize developmental continuity in behavior represents a highly inefficient use of longitudinal data and, more importantly, ignores potentially important population heterogeneity which can exist and obfuscate the underlying relationships. For example, Capaldi et al. (2012) studied externalizing and internalizing behaviors in childhood, finding moderate support for IG continuity. However, they found that the degree of continuity varied depending on the specific ages (7, 9 and 11) they studied; in other words, the observed correlation between generations likely depends on the developmental stages that are included because there are important within-person changes in behavior over time. This implies that the degree of continuity can be dependent on how one accounts for underlying population heterogeneity, and such detail will not be revealed, but rather obfuscated, by a single, summary measure in the form of a bivariate correlation.
Furthermore, a bivariate correlation does not identify the source of the IG continuity. Even though we talk about continuity in the behavior of interest, the strength of observed bivariate associations can often be attributed to the high proportion of individuals in both generations who do not engage in the behavior. For behaviors with low base rates of prevalence, such as serious criminality or substance abuse, refraining from engaging in the behavior may be a high-rate state in both generations, explaining a substantial proportion of continuity. In other words, much of the IG correlation in behavior might be driven merely by the stability in lack of engagement in problem behavior. For example, Besemer and Farrington (2012) showed a high level of continuity in criminal behavior, but that continuity tended to be largely driven by the non-offender group.
A second conceptual gap deals with the classification of individuals as exhibiting continuity or discontinuity in behavior. IG continuity and discontinuity are most clearly defined if the behavior of interest is binary, for example, the simple prevalence of drug use. In such instances, the phenomenon can be adequately summarized using a 2×2 contingency table, represented in Figure 1. Cases that fall along the main diagonal (i.e., ‘on diagonal’ cases) exhibit continuity. If the parent uses drugs so too does the child (cell 4); if the parent does not, neither does the child (cell 1). Cases that fall off the main diagonal exhibit discontinuity. Cell 2 represents IG escalation in drug use, i.e., the parent does not use, but the child does (cell 2; ‘above diagonal’ cases). Cell 3 represents IG resilience, where the parent uses drugs but the child does not (cell 3; ‘below diagonal’ cases).
Figure 1.
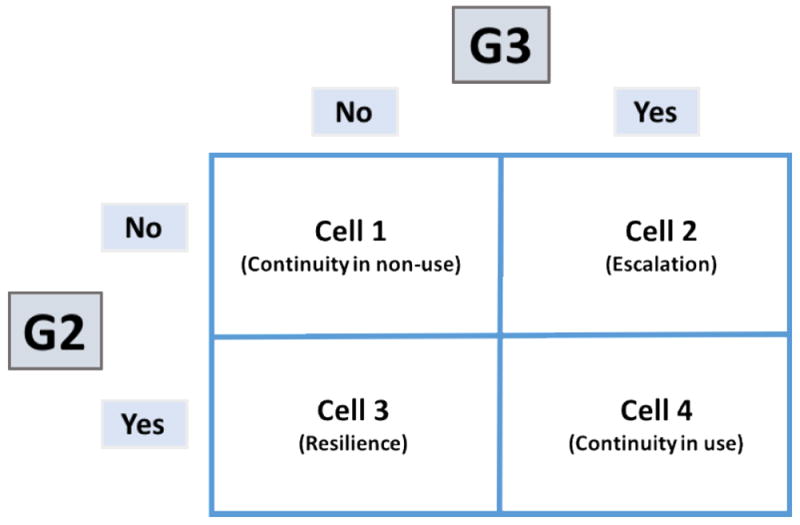
Intergenerational Continuity and Discontinuity Defined Using Prevalence
The quantification of continuity and discontinuity becomes more complicated once heterogeneity in the behavior is considered. There are different patterns of substance use over the life course “and identifying and distinguishing among them offers important insights into the etiology, course, and consequences of substance use” (Schulenberg, Merline, Johnston, O’Malley, Bachman and Laetz, 2005:257). Simple prevalence measures combine very different types of users which may obfuscate differences in patterns of usage between generations. For instance, a G2 persistent drug user compared to a G3 child with experimental use only would be classified as ‘continuous’ even though there is a marked downward change between generations. The degree of IG continuity can be defined, conditional on G2 behavior, over a continuum, which can be approximated using multiple discrete categories. An example is presented in Figure 2, which extends the logic of the previous example where users are now classified into three (or potentially more) ordered categories: non-users, limited users, and chronic users. In this 3×3 contingency classification, the cases which fall along the main diagonal would once again represent IG continuity in behavior (e.g., G2 chronic use and G3 chronic user), whereas the off-diagonal cases would again represent discontinuity. Furthermore, the below diagonal distinctions would still represent IG resilience while above-diagonal cases would still indicate escalation in G3 usage. However, in this scheme, the off-diagonal cases could now be further disentangled to indicate, conditional on level of G2 behavior, the degree of discontinuity. For example, given that a G2 exhibited chronic use, there will be separate estimates of the conditional probability that the G3 will display limited use versus non-use. Such transitions could be used to create a fuller, more complete picture of IG continuity and discontinuity. To be clear, when we refer to definitional elasticity, we refer to the differences in classification of cases as being either on-diagonal (i.e., continuous) or off-diagonal (discontinuous) which can vary within cases depending on the measurement of the underlying construct.
Figure 2.
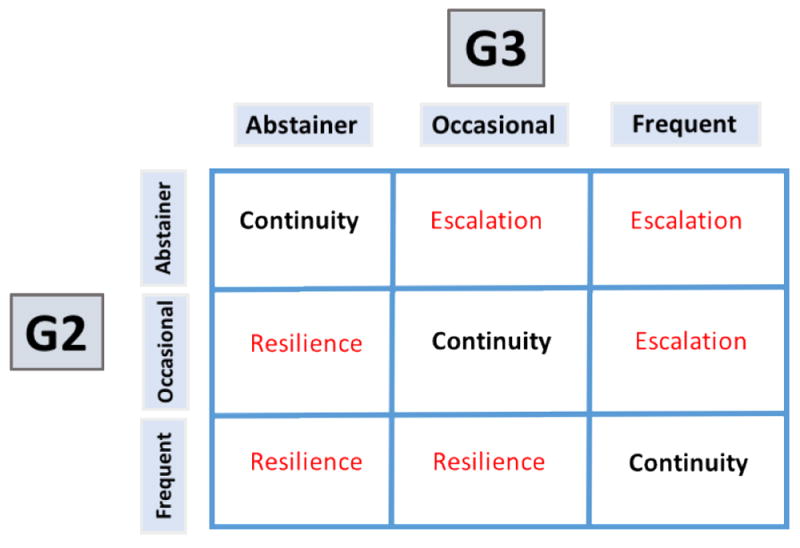
Intergenerational Continuity and Discontinuity Considering Heterogeneity
This conceptual framework highlights a third key gap in the study of IG transmission of behavior. That is, while the concept of continuity is often discussed, the distinct but equally important concept of discontinuity has typically been understudied or neglected altogether (Rutter, 1998). Several recent studies have focused on moderators of continuity, identifying protective factors against IG transmission. Edwards, Eiden and Leonard (2006) found maternal attachment moderated parental alcoholism and behavioral problems in toddlers. Results from the Rochester Intergenerational Study indicate that good parenting practices (Dong and Krohn 2014) and delayed childbearing (Lizotte, Phillips, Krohn, Thornberry, Bushway and Schmidt, 2015) serve as protective factors against the transmission of delinquent behavior. Conger, Schofield and Neppl (2012) observe that the parenting style of a co-parent acted as a moderator which could disrupt the IG transmission of parenting styles (see also Conger et al. 2013; Jaffee et al. 2013). While these studies highlight factors which explain differences in the degree of continuity between generations, they tend to ignore the type of IG discontinuity, i.e., escalation versus resilience. Finding that children are different from their parents is much less informative than finding that the child’s drug use is less than that of the parent versus the child’s drug use is greater than that of the parent. Identifying the developmental processes associated with these two very different outcomes is an important research task in IG study. Indeed, it is likely that these two processes have distinct sets of antecedents which should be separately studied as the processes are necessarily unique. A regression model predicting continuity verses discontinuity without accounting for different types of discontinuity would likely either misestimate the degree of association or find null associations between covariates and outcomes since certain covariates may even have opposite effects with respect to escalating and resilient behavior (see Conger et al. 2009).
The Present Study
The definition of IG continuity and discontinuity for a complex behavior is inherently fluid and depends upon multiple factors. They include, a more sophisticated descriptive summary of the behavioral linkages beyond a simple bivariate correlation, a descriptive summary that takes into account, at a minimum, heterogeneity in the behavior of interest within both generations, and attention to differences between types of discontinuity. The present study is designed to illustrate how estimates of IG continuity and discontinuity in a complex behavior can potentially change when these issues are explicitly identified and investigated. To illustrate the potential consequences of definitional elasticity we focus on involvement in adolescent substance use between the ages of 14 and 18, and address two research questions:
RQ1: How elastic is the degree of IG continuity based on different measurement approaches to addressing the heterogeneity of substance use?
RQ2: Do the correlates for IG resilience and escalation vary depending upon these different approaches?
It is not our intention to provide a full, substantive investigation of these questions. That is beyond the scope of the present methodological investigation which is focused on determining whether estimates of continuity and discontinuity, in fact, vary as a function of what we have called definitional elasticity. If the estimates do vary substantially, then future substantive investigations of IG linkages will need to be more sensitive to this issue.
We address these questions within the conceptual framework outlined above by using transition analysis (McCutcheon, 1987), in which we describe continuity and discontinuity using a series of conditional and joint probabilities. Specifically, we construct a series of models using different measures of substance use within each generation to explore their impact on the observed degree of continuity. First, we restrict definitions to simple prevalence measures. Next, we construct a transition model using developmental trajectories (Nagin 2005) over the same developmental periods in both generations as inputs. Instead of summarizing IG continuity using bivariate correlation coefficients, this analytic approach provides a more comprehensive summary of continuity in behavior through reporting a matrix of transition probabilities, representing the conditional probability of G3 behavior given G2 behavior. Our approach is similar to that offered by Nagin and Tremblay (2001) to study heterotypic continuity and comorbidity within individuals. The joint probabilities in this framework represent the unconditional probabilities of continuity and discontinuity, which can be disaggregated by type of continuity or discontinuity. Finally, this method allows for easy linkage of potentially relevant antecedents predicting transition states using multinomial logistic regression, where resilience and escalation can be disaggregated. This allows us to clearly tap into the consistency of the correlates across definitions, and determine whether those correlates differ by the type of discontinuity.
Methods
To examine these issues we use data from the Rochester Intergenerational Study (RIGS), and the Rochester Youth Development Study (RYDS). These companion longitudinal studies are based on a community sample designed to investigate the origins and consequences of drug use and related problem behaviors.
Sampling
RYDS began in 1988 with a probability sample of 1,000 G2 adolescents from Rochester, New York, a city with high rates of crime, poverty, and distressed neighborhoods. The sample is based on the public school population of all 7th and 8th graders as of 1988, selected so that a) youth at risk for problem behaviors are overrepresented and b) the findings can be weighted to represent the full cohort. Overrepresentation of high risk youth was accomplished by disproportionately stratifying on gender (75% males) and proportionately stratifying on residence in high-crime areas (Krohn and Thornberry, 1999). The G2 sample was interviewed 14 times from age 14 to 31. A G1 parent was also interviewed 11 times (until G2 was 23). The sample is 68% African American, 17% Hispanic, and 15% white.
To study IG continuity in substance use – i.e., similarity in behavior between parent-child dyads at the same developmental stages—we use data from the adolescent phase of the RYDS when the G2 participants were between 14 and 18 years of age, the age period that overlaps with the availability of substance use data for G3 participants. Up to age 18 (Wave 9 of data collection) the G2 retention rate was 88%. Comparisons of retained and non-retained G2 participants show that there are no significant differences between these groups on a host of variables, including indicators of substance use, and that those retained still represent the original sample (Krohn and Thornberry, 1999). During this phase of the study, interview data were collected at six-month intervals.
RIGS began in 1999 to examine IG continuity and discontinuity in problem behaviors. The G3 focal subjects are the oldest biological children of the original G2 RYDS participants. In Year 1 we enrolled children age 2 or older (average age = 6) and in each subsequent year we enrolled first-born children as they turned 2. Overall, the average age of first assessment is 4.8 years. By project Year 17 (2015; the last year of data used in this analysis) there were 632 eligible G3 children: 192 of RYDS mothers and 440 of RYDS fathers. Ninety-seven percent of the families of RYDS mothers (186 of 192) are participating. Although less than half of G2 fathers lived with the G3 child, 78% (345 of 440) of these families are participating in the study. Participating and non-participating fathers do not differ significantly by such variables as G2 adolescent drug use and delinquency, race or ethnicity, age at the birth of G3, high school dropout status, or history of maltreatment. Retention has been high; 80% (n = 410) were retained at Year 17.
In the RIGS we conducted annual interviews with all G2 fathers and G2 mothers (these are not couples, just the original male and female RYDS participants), G3 children age 8 and older, plus G3’s other major caregiver (OCG) who is the person, in addition to G2, primarily responsible for raising G3. The analytic sample in the present study consists of 427 G3 children (213 males, 214 females) and their respective G2 parent (264 males, 163 females) and includes every G3 adolescents for whom we have at least one self-report on substance use between the ages of 14 and 18. To create this sample we included all participants interviewed at these ages regardless of the calendar year in which the interviewed occurred.
To test for potential cohort clustering, we estimated the interclass correlation (ICC) among specific cohorts within G3 by fitting a three-level multilevel model to examine the extent to which the outcome of interest (drug use) varies as a function of birth cohort for G3. Level 1 represented the repeated measures of drug use, Level 2 represented the individual, and Level 3 the observed birth cohorts. Initially, we treated each year as a birth cohort, though given the small prevalence of drug use in some years, we aggregated them in five cohorts by mixing three consecutive years (e.g., those G3 cases born between 1990 and 1992). Using this approach, the variance in the construct at each level is estimated in the model and then used to calculate the ICC, which quantifies the proportion of variance that exists at each of the upper levels (Raudenbush and Bryk, 2002). A small ICC at level 3 indicates little variance in the outcome as a function of birth cohort. We calculated both unconditional models (i.e., no predictors) and models conditional on G3 age. The unconditional model produced ICC of 57% at Level 2 and 7.7% at Level 3, while the results conditional on G3 age are 68% and .2% respectively. This decrease in the variance explained by the cohort once age is introduced is expected given what we know about the relation between age and drug use. While both of these models show very little variance at the cohort level, it is important to note that our trajectory analysis directly accounts for age, meaning we can be highly confident that any observed differences are not due to differences across cohorts.
Measurement
At each interview we asked the respondents to self-report alcohol use (beer, wine, wine coolers, or liquor) and marijuana use during the last 6 months (G2) or 12 months (G3). For marijuana use, for example, we first asked “Since we interviewed you last time did you use marijuana, reefer, or pot?”, and, if they did, we then asked them “how many times did you do this?” For each generation we created a measure of the incidence of substance use by summing the frequency of alcohol use and marijuana use at each age between the ages of 14 and 18. Because these variables are highly skewed we top-coded each frequency measure at 100 for estimating trajectory models, though we report actual frequencies in descriptive statistics. We use a combined measure of adolescent alcohol and marijuana use for three reasons. First, these are the two most frequently used substances in adolescence, both in our sample and in national samples, and our sample reports very low prevalence of hard drug use. Second, if we examine them separately the “non-use” category would include some people who use the other substance at very high frequency, thereby muting differences between substance users and nonusers. Third, when alcohol and marijuana are considered separately, the key cell sizes of interest, especially in the high use group, are too small for any meaningful analysis.
The second research question is whether or not predictors of IG continuity and discontinuity are sensitive to different methods for defining and categorizing continuity and discontinuity. If these various approaches to measuring continuity (and discontinuity) provide similar estimates we would expect that the relation between antecedent variables and continuity would be quite similar across the different approaches. If, however, definitional elasticity is substantively important, these relations could vary considerably. If so, substantive conclusions about the predictors of continuity would depend on measurement decisions concerning how heterogeneity in substance use is considered, a topic that has received scant attention in the IG literature. Our intent is not to offer a complete explanation of continuity (or discontinuity) but merely to illustrate whether or not definitional elasticity is likely to matter. To examine this issue we have selected several illustrative attributes of the G2 parent that previous studies have suggested may correlate with IG continuity (e.g., McMahon and Peters, 2002; Serbin, Peters and Schwartzman, 1996). The time-varying indicators were measured when G3 was age 10 to preserve the correct temporal order, and all the measures are standardized at their means. Descriptive statistics are presented in Table 1.
Table 1.
Descriptive Statistics
| N | Mean | SD | Min | Max | |
|---|---|---|---|---|---|
| G2 Incidents of substance use, ages 12-18 | 427 | 71.7 | 182.8 | 0 | 2017 |
| G3 Incidents of substance use, ages 12-18 | 427 | 48.2 | 170.9 | 0 | 2014 |
| G2 Educational Attainment | 396 | 11.4 | 1.18 | 8 | 13 |
| G2 Age at G3 birth | 427 | 20.1 | 2.98 | 13.2 | 27.5 |
| G2 Consistency of discipline | 339 | 3.46 | 0.53 | 1.5 | 4 |
| G2 Attachment to child | 363 | 4.53 | 0.4 | 3 | 5 |
| G2 Monitoring | 370 | 3.12 | 1.59 | 1 | 5 |
| G2 Partner satisfaction | 267 | 4.38 | 0.7 | 1.6 | 5 |
| G2 Partner stability | 266 | 4.35 | 0.87 | 1.7 | 5 |
| G2 Adult crime | 381 | 24.8 | 100.3 | 0 | 1035 |
| G2 Adult drug use | 381 | 31.1 | 93.6 | 0 | 365 |
G2 Educational attainment is a measure of the years of schooling completed by the G2 parent. It ranges from 8 to 13 plus years. G2 age at G3 birth is based on the parent’s report of how old he or she was at the birth of his or her first child, that is, the G3 child.
G2 Attachment to G3 child is a 10-item adaptation of the Child’s Attitude Toward Parent scale (Hudson, 1996) in which the parents report their perception of the degree of warmth and lack of hostility in the parent-child relationship (α=.79). Consistency of discipline is a 4-item index indicating how often the parent feels punishment is effective or that the child can get away with things (α=.62). Monitoring, a 3-item measure, is the parent’s report of how often they impose and check rules about homework, time to go to bed, and use of technology (α=.88). If the G2 is currently living with a partner, two variables of the quality of the relationship are included. A 6-item scale indicates the level of partner satisfaction (α=.90). Partner stability is a 3-item measure in which the parent reports on his or her thoughts regarding breaking up or staying with the partner (α=.87).
Finally, we include two measures of involvement in problem behaviors, self-reported by the G2 parent when the G3 child was 10 years of age. G2 adult crime is based on the RYDS self-report inventory that includes 19 items covering a broad array of criminal behaviors ranging from minor offenses to serious violent crimes. G2 adult drug use is a 10-item measure of whether the parent reports having used illegal drugs, ranging from marijuana to heroin. We employ the total frequency of involvement in these behaviors during the past year.
We expect these variables to be correlated, though in different directions, with IG resilience as compared to escalation. We expect that higher values on parental education, an older age at first birth, higher values on the three parenting scales, and higher-quality partner relationships will be positively related with IG resilience, while lower levels of involvement in crime and drug use will be negatively related to resilience. In contrast, we expect the same variables to have the opposite relation to IG escalation in substance use. G2 adult involvement in problem behaviors will be associated with escalation and higher values on the other seven covariates will be associated with lower levels of escalation.
Analytic Plan
We consider the degree of IG continuity and discontinuity across three unique cases, using different definitions to account for heterogeneity of substance use. In Case 1 we define substance use in either generation using a simple prevalence measure, resulting in a 2×2 contingency table (see Figure 1), effectively ignoring heterogeneity in use. In the other two cases, we account for population heterogeneity in substance use to create three categories in each generation. In Case 2, we allow for heterogeneity by estimating trajectories of substance use only for those individuals who report some use, leaving non-users (i.e., abstainers) as a separate category. In Case 3, we allow for the possibility of a more flexible definition of “non-users” by estimating trajectories of use for the entire sample. To summarize, Case 1 only considers simple prevalence, Case 2 allows for heterogeneity among users but retains pure abstainers, and Case 3 allows for very low or experimental users to be combined with the abstainers to more fully isolate occasional users.
To define the heterogeneity in substance use over ages 14 to 18, we use a group-based modeling method (Nagin, 1999; 2005) to identify clusters of similar individual-level trajectories of incidence of substance use. Two points regarding estimation warrant further explanation. First, our goal is to examine whether different ways of accounting for population heterogeneity influence the degree of continuity across generations, as opposed to expressly describing population heterogeneity in the underlying behavior in either generation. As such we do not report traditional posterior fit metrics such as BIC compared solutions with different numbers of groups. Indeed, we concede that a solution with more groups would likely produce a more optimal model. That said, given the relatively small sample and the desire for parsimony (Loughran and Nagin, 2006), we limit the number of groups to three for this exercise, a number that is adequate to illustrate the sensitivity of IG linkages to different definitions of continuity and discontinuity. Second, we accounted for classification uncertainty in group membership, by considering each individual’s posterior probability of membership in each trajectory group, given the individual’s longitudinal string of observations. If the mean group-conditional posterior probabilities for each of the trajectory groups exceeds .70, then analysis based on direct classification into the latent class ignoring classification uncertainty will yield qualitatively similar conclusions to those reached when directly accounting for uncertainty (Roeder, Lynch and Nagin, 1999). In each of our trajectory groups, the mean conditional posterior probability exceeds .98, and thus we can confidently proceed with hard classification for further analysis.
Next, we consider how these different definitions affect the observed degree of IG continuity and discontinuity. Rather than summarize continuity using a single correlation coefficient, we report a series of transition probabilities which describe the proportion of G3 individuals who fall into a particular category given the category in which G2 resides. These transition probabilities can be grouped into four key sets of quantities in the 2×2 case. The first two, P(G3=0 ∣ G2=0) and P(G3>0 ∣ G2>0) represent ‘on diagonal’ transitions, reflecting continuity in behavior. We draw a distinction between these two to highlight that continuity in behavior can depend on either continued engagement in the behavior across generations, or the sustained lack of engagement across generation, a key difference which has usually been masked by the common use of a single summary measure. A third transition, P(G3=0 ∣ G2>0), represents an ‘off diagonal’ transition, in this case resilience. A fourth quantity, P(G3>0 ∣ G2=0), is the conditional probability of escalation. These on-diagonal and off-diagonal definitions can be easily extended in the 3×3 definition, as done below. We also report a series of unconditional probabilities: P(G3=0 ∩ G2=0) and P(G3>0 ∩ G2>0) denote the unconditional probability of continuity (i.e., the base rate), disaggregated by engagement in the behavior or not, P(G3=0 ∩ G2>0) is the base rate of resilience, and P(G3>0 ∩ G2=0) is the base rate of escalation. Taken together, this set of probabilities provides a more comprehensive picture of the degree of IG continuity and discontinuity, for which we can gauge sensitivity using different definitions.
Finally, we fit a series of multinomial logistic regression models using 9 G2 characteristics measured when the G3 child was 10 years old to differentiate between resilience and escalation in behavior. We anticipate that discontinuity in the form of resilience and discontinuity in the form of escalation are likely to have different developmental paths and, therefore, a different set of significant covariates. But if definitional ambiguity is unimportant, the covariates for resilience should be similar across the three measurement cases, as would the covariates for escalation.
Results
A traditional summary measure of IG continuity, Spearman’s rho, indicates a significant, though moderate to low degree of continuity in incidence of substance use across G2 and G3: ρ=.12 (p < .05). Prevalence of use is 76.6% in G2 and 50.6% in G3, meaning that 23.4% and 49.4% of G2 and G3, respectively, abstain from any use. These coarse definitions based on simple prevalence constitute categorizations for Case 1.
Figure 3 displays the trajectory solutions for Case 2. In each generation, an individual was included in estimation if she or he reported any substance use between ages 14-18. Those who reported no use were classified as a unique, third group (i.e., ‘pure abstainers’); they comprise 23.4% in G2 and 49.4% in G3 and are identical to the abstainer groups in Case 1. Among the users, both generations display very similar trajectories. First there is a group who may be thought of as ‘occasionals’, who constitute slightly more than three quarters of all users (76.2% of users in G2; 75.5% of users in G3). Overall, these groups represent 58.3% of the total sample in G2 and 38.2% in G3. This group is characterized by a low though slightly rising pattern of use through age 18, and self-report an average cumulative incidence of use over of 21.9 and 10.7 times in G2 and G3, respectively. Next, each generation also produces a high-frequency group who might be thought of as ‘frequents’ (23.9% of users in G2 and 24.5% of users in G3). These groups, who overall represent 18.3% of G2 and 12.4% of G3, feature high rate use early on with a steep rising slope through age 18. This group reports an average cumulative incidence of use over ages 14-18 of 323 and 355 for G2 and G3, respectively.
Figure 3.
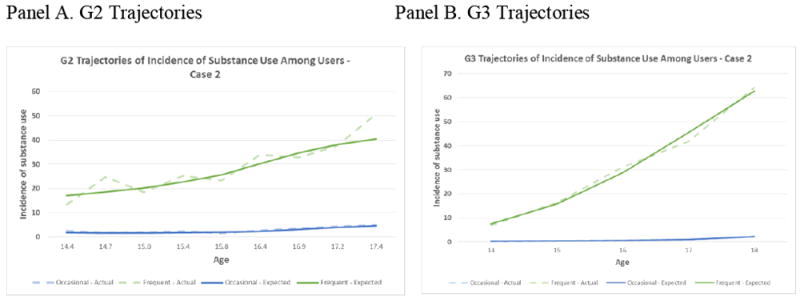
Substance Use Trajectories (Omitting Pure Abstainers)
Figure 4 displays the 3-group trajectory solutions for both generations for Case 3; all individuals, including those with zero reported use over the age range, were included in estimation. There is great similarity in the shape and distribution of use across the two generations. First, in both generations there is a large group of low-rate users (labeled ‘low’) who display very little substance use over the age range (64.6% in G2; 63.5% in G3). This group is essentially an amalgam of pure abstainers and those who report very low incidence of use over the age range. This group reports an average cumulative incidence of use over ages 14-18 of 5.3 and .5 times in G2 and G3, respectively. Second, there is a smaller group of moderate users (‘moderate’) who tend to use at a relatively continuous and slightly increasing rate through age 18 (25.3% in G2; 25.3% in G3). This group reports an average cumulative incidence of use of 79 and 17.6 times in G2 and G3, respectively. Finally, there is a group of high-rate, chronic users (‘chronics’) who report very high and increasing use though age 18. These groups contain 10.1% and 11.2% of the G2 and G3 samples, respectively, and report an average cumulative incidence of use over ages 14-18 of 480 and 386 times in G2 and G3, respectively.
Figure 4.
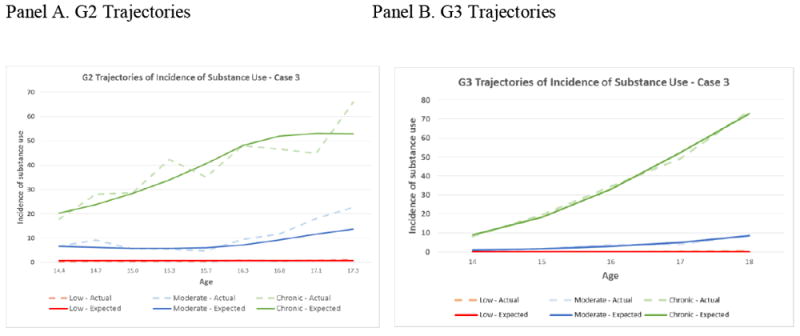
Substance Use Trajectories (Including Zeros)
The differences between these two sets of solutions for Case 2 and Case 3 highlight important differences in how we might choose to characterize population heterogeneity. Specifically, in Case 2, we classify very low-rate users who may have only experimented once or twice differently from pure abstainers. Conversely, Case 3 separates these very low-rate experimenters from moderate level, yet still constant, users. This is reflected in the disparity of the relative sizes of the lowest rate group in the two solution sets. Moreover, the chronic groups in the Case 3 solutions tend to have an even higher frequency of use than the frequent group in the Case 2 solutions. Finally, in Case 1 we ignore heterogeneity of use altogether and focus just on the prevalence of substance use. In specifying these different definitions of use, we potentially are making important assumptions about how we are also defining continuity in behavior.
Estimates of Continuity and Discontinuity
Table 2 reports probability estimates for continuity and discontinuity for each of our three cases. Unconditional probabilities of continuity and discontinuity are reported in Panel A. These quantities can be interpreted as the base rate of each. There is important variability in estimates across the three cases. In Cases 1 and 2, where we utilize a strict definition of abstainers, the base rate of continuity for no use is quite low, 13.1%. Conversely, when this category of low users is expanded using the more liberal definition specified in Case 3, the estimate of this base rate balloons to 43.8%. Furthermore, the probability of continuity for users monotonically decreases as we consider more fine-grained heterogeneity. In Case 1, the coarsest definition of use, this probability is 40.3%, whereas in Case 3, this percentage diminishes to only 8.4%. The total proportion of individuals classified as on-diagonal, or continuous, is similar for Cases 1 and 3, 53.4% versus 52.2%. Yet in the latter case, this percentage is driven almost entirely by the low-low transition, with very little continuity among users. Conversely, the proportion of continuity explained by users in Case 1 is more than double than that explained by abstainers.
Table 2.
Probabilities of Continuity and Discontinuity
|
Panel A. Unconditional Probabilities or Base Rate
| |||
| P(continuity for non/low users) | 13.1 | 13.1 | 43.8 |
| P(continuity for users) | 40.3 | 24.8 | 8.4 |
| P(continuity) | 53.4 | 37.9 | 52.2 |
| P(resilience) | 36.3 | 44.5 | 23.2 |
| P(escalation) | 10.3 | 17.6 | 24.6 |
|
| |||
|
Panel B. Transition Probabilities, P(G3∣G2)
| |||
| Case 1 | Case 2 | Case 3 | |
| 2×2 | 3×3 | 3×3 | |
|
| |||
| Continuity | |||
|
|
|||
| No/Low Use: | |||
| P(G3=abstainer ∣ G2=abstainer) | 56 | 56 | |
| P(G3=low ∣ G2=low) | 67.8 | ||
| Use: | |||
| P(G3=user ∣ G2=user) | 52.6 | ||
| P(G3=occasional ∣ G2=occasional) | 38.6 | ||
| P(G3=frequent ∣ G2=frequent) | 12.8 | ||
| P(G3=moderate∣G2=moderate) | 27.8 | ||
| P(G3=chronic ∣ G3=chronic) | 14 | ||
| Resilience | |||
|
|
|||
| P(G3=abstainer ∣ G2=user) | 47.4 | ||
| P(G3=abstainer ∣ G2=occasional) | 49 | ||
| P(G3=abstainer ∣ G2=frequent) | 42.3 | ||
| P(G3=occasional ∣ G2=frequent) | 44.9 | ||
| P(G3=low ∣ G2=moderate) | 57.4 | ||
| P(G3=low ∣ G2=chronic) | 51.2 | ||
| P(G3=moderate ∣ G2=chronic) | 34.9 | ||
| Escalation | |||
|
|
|||
| P(G3=user ∣ G2=abstainer) | 44.0 | ||
| P(G3=occasional ∣ G2=abstainer) | 32 | ||
| P(G3=frequent ∣ G2=abstainer) | 12 | ||
| P(G3=frequent ∣ G2=occasional) | 12.5 | ||
| P(G3=moderate ∣ G2=low) | 22.8 | ||
| P(G3=chronic ∣ G2=low) | 9.4 | ||
| P(G3=chronic ∣ G2=moderate) | 14.8 | ||
The probability of resilience is also very dependent on our definition. Resilience in Case 1 includes all G3 abstainers with G2 parents who were users, or 36.3% of the sample. In Case 2 this group expands to include all of these same individuals plus any occasional G3 users with a frequent user G3 parent, and resilience increases to 44.5% of the sample. In Case 3, the definition of resilience becomes more restricted, as any G3 with a very low level G2 user is excluded from being classified as resilient. In this case, the probability of resilience drops to 23.2% of the sample.
Finally, the probability of escalation also changes based on how heterogeneity is assessed. In Case 1, where escalation can only be defined by G3 users with G2 abstainers, the base rate is quite low, only 10.3%. In Case 2, this definition expands to also include occasional G2 users with frequent user G3 children, which increases the probability to 17.6%. In Case 3, where escalation is defined over a very inclusive G2 low group as well as a G2 moderate group, the probability of escalation increases to 24.6%, or more than twice as large as it is in Case 1.
Transition probabilities linking G3 outcomes conditional on G2 behavior are reported in Panel B. First we consider the conditional probabilities of continuity. These transition probabilities are grouped according to continuity in use and continuity in non (or low) use. In Case 1, or the 2×2 matrix constructed using simple prevalence measures, the probability of a G3 being an abstainer conditional on G2 abstaining is 56.0%. This quantity is identical in Case 2, where abstainers are defined in the exact same way. However, in Case 3, where the abstainer group is broadened to include very low level users this estimate of continuity in none or low use increases to 67.8%.
Next consider continuity conditional on G2 users. In Case 1, the probability of G3 use given G2 use is 52.6%, suggesting a large degree of continuity in use. Yet when heterogeneity is taken into account, this picture of strict continuity – that is, both generations are in the same rank-ordered trajectory group – becomes more tenuous. In Case 2, the probability of G3 being an occasional user given G2 was an occasional user is only 38.6%. In Case 3, where the very low level users are removed from the user group to create a more active moderate group, the probability of a G3 child being a moderate user conditional on having a G2 parent who is a moderate user falls to 27.8%. The probability of continuity decreases even further when conditional on high level G2 users. In Case 2, the probability of a G3 being a frequent user given G2 frequent use is only 12.8%. Similarly, in Case 3, the probability of a G3 being a chronic user given G2 chronic use is also quite low, 14.0%. In other words, it is quite rare that both parent and child will exhibit very high levels of adolescent substance use.
Another way in which to think of this lack of continuity is by measuring the probability of discontinuity. First, consider IG resilience. In Case 1, the probability of G3 being an abstainer given G2 use is 47.4%. Yet as our definitions become more nuanced, the conditional probability of resilience becomes larger. In Case 2, there is a 49.0% probability that a G3 will abstain given their G2 parent is an occasional user, and an 87.2% chance that the G3 will be either an abstainer (42.3%) or occasional user (44.9%) given their G2 parent is a frequent user. Similarly, in Case 3, 57.4% of G3s with a G2 parent who is a moderate user will reduce their use to low or none, and 86.0% of G3s with a parent who is a chronic user will display either low (51.2%) or moderate (34.9%) use.
Next consider discontinuity in the form of IG escalation. Case 1 indicates the conditional probability of a G3 being a user given G2 is an abstainer is 44.0%, suggesting a relatively large amount of escalation. As our definitions become finer, the conditional probability of escalation in substance use also changes. In Case 2, conditional on having a G2 parent who is an abstainer, there is a 32.0% probability that a G3 will be an occasional user and a 12.0% probability that the G3 will be a frequent user. Only 12.5% of G3s with a G2 parent who is an occasional user report frequent use. Similarly, in Case 3, conditional on having a G2 parent who is a low user, there is a 22.8% probability a G3 will become a moderate user and 9.4% probability of becoming a chronic user. The probability that a G3 will be a chronic user given their parent is a moderate user is only 14.8%.
Correlates of Continuity
As noted above, we wish to estimate whether the correlates for continuity vary depending upon our definition. Our results thus far have illustrated that the continuity group can be separated by either continuity in use or continuity in non-use, which represent qualitatively different types of transitions. Similarly, discontinuity can be further disaggregated into resilience or escalation. Therefore, we must be clear about both the type of transition as well as the appropriate comparison group. Merely predicting differences between continuity versus discontinuity has the potential to aggregate very dissimilar types of G3 individuals (i.e., resilience and escalator) and to also combine different types of G2 individuals. Given our interest in IG discontinuity we will compare G3 behavior conditional on G2 behavior.
First consider correlates for resilience. In the 2×2 case, we attempt to distinguish between G3s who abstain versus G3s who use, conditional on having a G2 parent user. In other words, we are interested in what differentiates G3s with G2 user parents. In Case 2, this comparison is easily extended to include as resilient any G3 abstainers or occasional users with G2 frequent use parents, plus G3 abstainers with a G2 occasional user parent. The comparison (i.e., continuity) group would be defined similarly conditional on these two G2 categories of use. In Case 3, those classified as resilient would include any G3 low or moderate users with a G2 chronic user parent, plus any G3 low level user with a G2 moderate user parent.
Table 3 reports the relative risk ratios from a series of multinomial logistic regression models using each of our predictors as explanatory terms to differentiate between resilience and continuity in use in each of our three cases. Each of 9 covariates is entered separately to show the bivariate relation in order to answer two questions: 1) which factors are correlated in the correct direction to IG resilience, and 2) do these factors vary across the definitional cases. First, 7 of the 9 covariates failed to significantly predict resilience in any case (G2 education level at G3 age 10; G2 consistency of discipline, G2 attachment; G2 monitoring; G2 partner stability, G2 adult crime and G2 adult drug use).
Table 3.
Multinomial Logit Predicting Resilience vs. Continuity in Drug Use (95% CIs)
| N | Resilience | |||
|---|---|---|---|---|
| Case 1 | Case 2 | Case 3 | ||
| G2 Educational Attainment | 396 | 1.1 (.91-1.4) | .83 (.65-1.1) | .96 (.66-1.4) |
| G2 Age at G3 birth | 427 | 1.6** (1.3-2.0) | 1.5** (1.2-1.9) | 1.4 (.92-2.1) |
| G2 Consistency of discipline | 339 | 1.2 (.92-1.5) | 1.1 (.86-1.4) | 1.3 (.87-1.9) |
| G2 Attachment to child | 363 | 1.1 (.86-1.4) | .90 (.69-1.2) | 1.3 (.88-1.9) |
| G2 Monitoring | 370 | 1.1 (.90-1.4) | 1.1 (.86-1.4) | 1.2 (.78-1.7) |
| G2 Partner satisfaction | 267 | 1.2 (.88-1.5) | .92 (.68-1.2) | 1.7* (1.1-2.5) |
| G2 Partner stability | 266 | 1.3 (.98-1.7) | 1.2 (.87-1.6) | 1.5 (.95-2.3) |
| G2 Adult Crime | 381 | .78 (.59-1.0) | 1.0 (.80-1.3) | .88 (.69-1.1) |
| G2 Adult Drug Use | 381 | .84 (.67-1.1) | 1.0 (.80-1.3) | .89 (.67-1.2) |
p > .01;
p > .05, two tail
In each case, only one factor was a significant predictor of resilience. In Case 1 and Case 2, an older age at first birth is associated with greater IG resilience. However, in Case 3, only G2 partner satisfaction is significant, with greater satisfaction associated with higher rates resilience. Taken together, these data provide somewhat mixed results. On the one hand, they suggest that no matter how resilience is defined, these G2 characteristics and behaviors are not major influences in accounting for it. On the other hand, there are differences in significant predictors between Cases 1 and 2 versus Case 3.
Next consider correlates for escalation. Again, all comparisons are conditional on G2 behavior. In Case 1, we compare G3 users versus G3 abstainers, conditional on G2 abstainers. In Case 2, escalation can be thought of as a G3 being either an occasional or frequent user with a G2 abstainer, or a G3 frequent user with a G2 occasional user. Similarly in Case 3, escalation can be thought of as a G3 being either a moderate or chronic user with a G2 low user, or a G3 chronic user with a G2 moderate user. Given the comparison group (i.e., continuity in non- or low-use), we expect that higher values of all factors, but G2 adult crime and G2 adult drug use, will be associated with lower probabilities of escalation.
Table 4 reports the relative risk ratio for each of these bivariate relations. In this case, five of the nine predictors failed to significantly predict escalation in any of the three cases (G2 education level at G3 age 10; G2 attachment; G2 partner satisfaction, G2 partner stability, and G2 adult crime). In Case 1, with the narrowest definition of non-use, only G2 age at G3 birth was a significant predictor of IG escalation. In Case 2, which expands the continuity of non-use to include lower level users, G2 age at G3 birth and G2 consistency of discipline significantly predict escalation. Finally, in Case 3, with the coarsest definition of continuity, three factors became significant predictors of escalation: G2 age at G3 birth—as in the previous cases—and G2 monitoring, and G2 drug use.
Table 4.
Multinomial Logit Predicting Escalation vs. Continuity (95% CIs)1
| N | Escalation | |||
|---|---|---|---|---|
| Case 1 | Case 2 | Case 3 | ||
| G2 Educ at g3 age 10 | 396 | .98 (.63-1.5) | .78 (.53-1.1) | .76 (.58-.99) |
| G2 Age at G3 birth | 427 | .62* (.41-.93) | .58** (.41-83) | .62** (.48-79) |
| G2 Consistency of discipline | 339 | .81 (.46-1.4) | .61* (.37-1.0) | .91 (.69-1.2) |
| G2 Attachment to child | 363 | 1.0 (.62-1.6) | .82 (.54-1.2) | .90 (.69-1.2) |
| G2 Monitoring | 370 | 1.2 (.73-1.8) | .92 (.62-1.4) | 76* (.58-.99) |
| G2 Partner Satisfaction | 267 | .96 (.55-1.7) | .81 (.50-1.3) | .89 (.66-1.2) |
| G2 Partner Stability | 266 | .72 (.40-1.3) | .63 (.37-1.1) | .80 (.59-1.1) |
| G2 Adult Crime | 381 | 1.2 (.63-2.5) | 1.2 (.66-2.3) | 1.2 (.80-1.7) |
| G2 Adult Drug Use | 381 | 10 (.27-386) | 10 (.27-385) | 1.7** (1.4-3.3) |
p < .01;
p < .05, two tail
Compared only with those who exhibit continuity in non use (Case 1), non or occasional use (Case 2), and low or moderate use (Case 3).
Discussion
More fully identifying the level of IG continuity between parent and child substance use is an intriguing question that has the potential to greatly enhance our understanding of the developmental processes associated with substance use. For example, if there is a substantial degree of IG similarity between parent and child, unpacking this relation enhances our understanding of the long-term consequences of a G2 parent’s involvement in adolescent substance use, in this case consequences that cut across to the next generation. Simultaneously, unpacking that relation also enhances our understanding of the origins of the G3 child’s substance use by identifying earlier parental use as a distal risk factor. Either way, we gain additional information about the causes and consequences of adolescent substance use.
These and other benefits depend entirely on an accurate assessment of the level of continuity or discontinuity in substance use (or any other behavior of interest). But, estimates of the level of continuity, including whether or not there is a significant relation, vary across IG studies of substance use (and other problem behaviors). Surprisingly, relatively little attention has been paid to a careful definition of what is meant by IG continuity or to appropriate ways for defining and measuring the twin concepts of continuity and discontinuity. Indeed, the central contention of this paper is that the very notion of IG continuity is somewhat nebulous and is likely influenced by what we have called definitional elasticity. Continuity is a malleable concept and the observed level of continuity, and therefore discontinuity, is likely to depend on how we measure substance use in each generation and how we categorize G3 children as exhibiting behavior that is either continuous or discontinuous relative to the behavior of their parents. If this is true, definitional elasticity could help account for the mixed results observed in the IG literature. Moreover, for complex behaviors like substance use, there are several dimensions that can influence definitional elasticity. They include the type or types of substances under consideration, the developmental stages that are examined, whether categorical or continuous measures are employed, how population heterogeneity is modeled, and so forth. How these issues are handled are likely to affect the observed level of continuity observed in any given study. Although potentially problematic, there are no previous investigations of whether or not definitional elasticity exists and, if it does, its impact on the observed level of continuity (and discontinuity) as well as correlates of IG escalation and resilience. The purpose of this paper is to begin an investigation of this topic.
In particular, our aim was to illustrate the potential consequences of the broader issue of definitional elasticity by focusing on one important source of elasticity– how the inherent population heterogeneity that exists in substance use (Schulenberg et al., 2005) is taken into account. We examined two research questions. One concerned the degree of elasticity in the observed levels of IG continuity and discontinuity under different assessments of population heterogeneity. The other focused on whether predictors for IG resilience and escalation vary depending upon these different approaches. Several key conclusions can be drawn from the results presented above.
First, if definitional elasticity were not an important issue, the level of continuity would be relatively invariant to how population heterogeneity is taken into account. Moreover, covariates that significantly predict IG escalation or resilience would also be relatively invariant to the different approaches that are used to measure continuity and discontinuity. It is exceedingly clear based on the results of the preceding analysis that this is not the case. The importance of considering heterogeneity in substance use when estimating the level of continuity and discontinuity is apparent. When population heterogeneity is taken into account, the estimates presented above imply that even with a G2 parent who is a frequent or chronic user, the chances of the G3 child displaying a similar level of behavior is quite low. In contrast, when a coarser definition of substance use is employed, such as the one represented in Figure 1, the level of continuity is relatively high, perhaps misleadingly so in that it appears to overstate the degree of continuity in substance use. Similarly, who we define as resilient also depends on how we account for heterogeneity. By accounting for a reduction in the level of use among substance users in Case 2, we are able to expand the definition of resilience, thereby increasing the proportion of cases classified as resilient. On the other hand, in Case 3, where we include low level users in the lowest category, we restrict resilience to include only those G3 individuals who exhibit a substantial reduction from their parents, and hence, the probability of resilience decreases. Similarly, as more heterogeneity was considered, there appeared to be an increase in escalation.
With respect to predictors of continuity and discontinuity, there are two main conclusions that emerge from our analysis. The first is that, based on how we define continuity, factors which traditional statistical tests reveal to be significant varied across the measurement cases, especially in the prediction of escalation. Importantly, these differences went beyond simply finding more factors as being statistically significant predictors when we used an expanded definition of continuity, and having only a subset of these same factors being significant in a more restricted case. Instead, we found that different definitions of continuity, such as in Case 3, tended to produce unique predictors. Our results also illustrate the importance of carefully defining comparison groups for establishing whether certain variables are predictive of discontinuity. For example, correlates for resilience need to be established by comparing individual who we classified as being resilient only to those individuals who displayed IG continuity in use. Comparatively, correlates for escalation were established by comparing escalators to all individuals classified as continuous in abstaining from drug use. These differences also illustrate the potentially fatal problem in combining resilient individuals with escalators in a global moderation analysis, as different processes would likely cancel each other out, and suggest that certain factors are not significant when in fact they are. This contention is supported by the observation that the coefficients in table 3 predicting resilience and those in table 4 predicting escalation, by and large, have the opposite sign.
Second, it is straightforward to see why a singular summary measure of continuity may be misleading. Continuity in non-use or low levels of use across the generations is considerably greater than continuity in moderate or high level usage. A simple correlation or regression coefficient can easily mask that important aspect of the relation. Indeed, it is likely to provide a misleading picture of the level of IG continuity in the behavior of interest. That is, because the correlation is typically referred to as reflecting the relationship between parent and child substance use (rather than nonuse) it subtly masks the fact that the correlation is largely driven by similarity between parent and child with respect to abstinence and falsely implies that it is driven by similarity in use.
Third, the results presented here suggest that definitional elasticity matters. As heterogeneity of substance use is taken into account, estimates of the level of continuity and discontinuity as well as significant predictors of discontinuity change. Nevertheless, the results also imply that there is no ‘right’ answer in addressing definitional elasticity. For example, consider the differences between Case 2 and Case 3. Both are defensible ways of dealing with heterogeneity, but they produce different results. A key point here is that, as more population heterogeneity is accounted for, the probability of continuity in behavior strictly declines, particularly among those who exhibit problem behavior (as opposed to abstaining from it).
Relatedly, what we define as resilience and escalation will necessarily increase. In the extreme, where behavior is defined over a continuum, it is easy to conceptualize a situation where the probability of continuity tends toward zero, as most children are not exactly the same as their parent in terms of behavior. This means that observed differences can be used to classify a child as either resilient or escalating. However, the magnitude of this difference between parent and child may or may not be practically important. For instance, consider the mean incidence for chronic groups in Case 3. G2 mean incidence for this group is 480, or nearly a 25% increase over mean incidence for the chronic group in G3. Yet, as the levels suggest, both groups are comprised of extremely heavy users, and therefore this difference in magnitude is likely rendered irrelevant for any practical intervention or policy considerations. At the other extreme, Case 1, we have what is perhaps an overly broad definition of continuity, where very low use or experimentation in both generations would classify individuals as being continuous. Targeting such individuals with program resources would be extremely inefficient. As such, the ‘optimal’ amount of heterogeneity considered likely lies in the middle of these two extremes, and likely varies across problem behaviors. The approach one selects is likely to depend on the theoretical issue under investigation. But the key point that we wish to emphasize is that researchers should give a more careful consideration and discussion to this issue by being explicit in how heterogeneity is accounted for and how we measure the behavior of interest in each generation. Researchers should also be transparent and discuss the implications of chosen measurement decisions for estimates of continuity and discontinuity.
We note several limitations of the present study which we hope serve to incubate continued research on this topic. First, we present here one way—group-based trajectory models—to account for population heterogeneity, but we stress that this is in no way the only, or even universally preferable, way to do this. An alternative approach might be to partition the sample using Latent Class Analysis, and present the transition matrices using a more proper Latent Transition Analysis (McCutcheon, 1987). In such a strategy, which may require larger samples, the latent classes in either generation might include a group of individuals who only use alcohol, another who uses both alcohol and marijuana, and a third who engages in polysubstance use. Summarizing transitions in this case would create an exceptionally rich picture of differences in IG substance use.
Furthermore, the current study only considers continuity and discontinuity in one specific behavior, that is, adolescent substance use. However, the conceptual issues we addressed likely apply to IG studies of other complex, problem behaviors. Though we recognize definitional ambiguity is not a central issue for certain types of outcomes that are naturally categorical, for instance IG continuity in teen parenthood, high school dropout status, or certain diseases, for many outcomes accounting for heterogeneity would appear to be a central issue. Moreover, given the limited power in our sample, we were unable to consider separate full analyses conditional on G2 or G3 gender. That said, the observed patterns found in cross-tabulations of G2 and G3 by G2 and G3 gender were highly similar overall (at least in those cells with more cases) to those observed for the full sample. Finally, for reasons we discuss above, we found it optimal in the present analysis to combine alcohol and marijuana into a single measure. However, we advocate for future analyses which are capable of considering these behaviors separately as well.
A key conclusion in IG research is that there is a large amount of discontinuity between parents and children (Rutter 1998; Conger et al, 2009). However, despite the abundant intentional statements, most research has focused on accounting for continuity. Future IG research should provide a more balanced view and pay more attention to discontinuity. In doing so, as we have stated above, it is crucial to distinguish between escalation and resilience, two very different forms of discontinuity. It is also imperative that future research look to a fuller range of theoretically relevant predictors of resilience and escalation. In the present study, where our intention was more methodological than theoretical, we only considered a handful of predictors, all of them related with G2 characteristics, to illustrate the measurement issue. However, the different processes of escalation and resilience may be better explained by G3 characteristics, including genetic endowments, the characteristics of the child’s other parent, especially if that parent is the primary caregiver, or the broader context in which the family and child have developed. Such a broader investigation is likely to enhance our understanding of the origins of adolescent substance use and the role that IG influences play in it.
In closing, our purpose in this study has been to introduce the concept of definitional elasticity and show how estimates of both IG continuity and discontinuity may vary as a result of accounting for heterogeneity in behavior. Our results also have important implications for other topics in the general area of IG study. For example, another important theme concerns the investigation of heterotypic continuity – continuity between parental substance use and the child’s involvement in other types of problem behaviors, and vice versa. Results concerning estimates of heterotypic continuity also vary across studies (see, for example, Bailey et al. 2009; Kerr et al. 2012; Pears et al. 2007). It is important to take heterogeneity in other problem behaviors, as well as substance use, into account in these investigations and how that is done is likely to impact the level of heterotypic continuity that is observed. Definitional elasticity is also likely to impact investigations of the mediating and moderating processes that help explain why parents and children are similar or dissimilar with respect to a various behaviors, as well as inconsistencies across studies on this important topic. Thus, we hope that our findings prompt IG researchers to continue investigating this issue and incorporate these considerations of definitional clarity into future research.
Acknowledgments
We thank Marvin D. Krohn, Kimberly L. Henry, Mauri Matsuda and our anonymous reviewers for their helpful comments.
Support for the Rochester Youth Development Study has been provided by the National Institute on Drug Abuse (R01DA020195, R01DA005512), the Office of Juvenile Justice and Delinquency Prevention (86-JN-CX-0007, 96-MU-FX-0014, 2004-MU-FX-0062), the National Science Foundation (SBR-9123299), and the National Institute of Mental Health (R01MH56486, R01MH63386). Technical assistance for this project was also provided by an NICHD grant (R24HD044943) to The Center for Social and Demographic Analysis at the University at Albany.
Footnotes
Points of view or opinions in this document are those of the authors and do not necessarily represent the official position or policies of the funding agencies.
References
- Bailey JA, Hill KG, Oesterle S, Hawkins JD. Parenting practices and problem behavior across three generations: Monitoring, harsh discipline, and drug use in the intergenerational transmission of externalizing behavior. Developmental Psychology. 2009;45:1214–1226. doi: 10.1037/a0016129. [DOI] [PMC free article] [PubMed] [Google Scholar]
- Belsky J, Conger R, Capaldi DM. The Intergenerational Transmission of Parenting: Introduction to the Special Section. Developmental Psychology. 2009;45:1201–1204. doi: 10.1037/a0016245. [DOI] [PubMed] [Google Scholar]
- Besemer S, Farrington DP. Intergenerational transmission of criminal behaviour: Conviction trajectories of fathers and their children. European Journal of Criminology. 2012;9:120–141. doi: 10.1177/1477370811422801. [DOI] [Google Scholar]
- Cairns RB, Cairns BD, Xie H, Leung M, Hearne S. Paths across Generations: Academic Competence and Aggressive Behaviors in Young Mothers and Their Children. Developmental Psychology. 1998;34:1162–1174. doi: 10.1037/0012-1649.34.6.1162. [DOI] [PubMed] [Google Scholar]
- Capaldi DM, Pears KC, Patterson GR, Owen LD. Continuity of parenting practices across generations in an at-risk sample: A prospective comparison of direct and mediated associations. Journal of Abnormal Child Psychology (special issue) 2003;31:127–142. doi: 10.1023/A:1022518123387. [DOI] [PubMed] [Google Scholar]
- Capaldi DM, Pears KC, Kerr DCR, Owen LD, Kim HK. Growth in externalizing and internalizing problems in childhood: A prospective study of psychopathology across three generations. Child Development. 2012;83:1945–1959. doi: 10.1111/j.1467-8624.2012.01821.x. [DOI] [PMC free article] [PubMed] [Google Scholar]
- Conger RD, Neppl T, Kim KJ, Scaramella LV. Angry and aggressive behavior across three generations: A prospective, longitudinal study of parents and children. Journal of Abnormal Child Psychology (special issue) 2003;31:161–169. doi: 10.1023/A:1022570107457. [DOI] [PubMed] [Google Scholar]
- Conger RD, Belsky J, Capaldi DM. The intergenerational transmission of parenting: Closing comments for the special section. Developmental Psychology. 2009;45:1276–1283. doi: 10.1037/a0016911. [DOI] [PubMed] [Google Scholar]
- Conger RD, Schofield TJ, Neppl TK. Intergenerational continuity and discontinuity in harsh parenting. Parenting. 2012;12:222–231. doi: 10.1080/15295192.2012.683360. [DOI] [PMC free article] [PubMed] [Google Scholar]
- Conger RD, Schofield TJ, Neppl TK, Merrick MT. Disrupting intergenerational continuity in harsh and abusive parenting: The importance of a nurturing relationship with a romantic partner. Journal of Adolescent Health. 2013;53:S11–S17. doi: 10.1016/j.jadohealth.2013.03.014. [DOI] [PMC free article] [PubMed] [Google Scholar]
- Dong B, Krohn MD. Exploring Intergenerational Discontinuity in Problem Behavior: Bad Parents with Good Children. Youth Violence and Juvenile Justice. 2014;13:99–122. doi: 10.1177/1541204014527119. [DOI] [PMC free article] [PubMed] [Google Scholar]
- Edwards EP, Eiden R, Leonard KE. Behavioral problems in 18- to 36- month-old children of alcoholic fathers: Secure mother-infant attachment as protective factor. Development and Psychopathology. 2006;18:395–407. doi: 10.1017/S0954579406060214. [DOI] [PMC free article] [PubMed] [Google Scholar]
- Hudson WH. WALMYR Assessment Scales Scoring Manual. Tempe, AZ: WALMYR Publishing Company; 1996. [Google Scholar]
- Jaffee SR, Bowes L, Ouellet-Morin I, Fisher HL, Moffitt TE, Merrick MT, Arseneault L. Safe, stable, nurturing relationships break the intergenerational cycle of abuse: A prospective nationally representative cohort of children in the United Kingdom. Journal of Adolescent Health. 2013;53:S4–S10. doi: 10.1016/j.jadohealth.2013.04.007. [DOI] [PMC free article] [PubMed] [Google Scholar]
- Kerr DC, Capaldi DM, Pears KC, Owen LD. Intergenerational influences on early alcohol use: Independence from the problem behavior pathway. Development and psychopathology. 2012;24:889–906. doi: 10.1017/S0954579412000430. [DOI] [PMC free article] [PubMed] [Google Scholar]
- Knight KE, Menard S, Simmons SB. Intergenerational Continuity of Substance Use. Substance use & misuse. 2014;49:221–233. doi: 10.3109/10826084.2013.824478. [DOI] [PubMed] [Google Scholar]
- Krohn MD, Thornberry TP. Retention of minority populations in panel studies of drug use. Drugs & Society. 1999;14:185–207. doi: 10.1300/J023v14n01_14. [DOI] [Google Scholar]
- Lizotte AJ, Phillips MD, Krohn MD, Thornberry TP, Bushway SD, Schmidt NM. Like Parent Like Child? The Role of Delayed Childrearing in Breaking the Link between Parent’s Offending and Their Children’s Antisocial Behavior. Justice Quarterly. 2015;32:410–444. doi: 10.1080/07418825.2013.771206. [DOI] [PMC free article] [PubMed] [Google Scholar]
- Loughran TA, Nagin DS. Finite sample effects in group-based trajectory models. Sociological Methods & Research. 2006;35:250–278. doi: 10.1177/0049124106292292. [DOI] [Google Scholar]
- McCutcheon AL. Quantitative Applications in the Social Sciences Series No 64. Thousand Oaks, California: Sage; 1987. Latent class analysis. [Google Scholar]
- McMahon RJ, Peters RD, editors. The effects of parental dysfunction on children. New York: Kluwer Academic/Plenum Publications; 2002. [Google Scholar]
- Merrick MT, Leeb RT, Lee RD. Examining the role of safe, stable, and nurturing relationships in the intergenerational continuity of maltreatment - Introduction to the special issue. Journal of Adolescent Health. 2013;53:S1–3. doi: 10.1016/j.jadohealth.2013.05.002. [DOI] [PubMed] [Google Scholar]
- Nagin DS. Analyzing developmental trajectories: A semiparametric, group-based approach. Psychological Methods. 1999;4:139–157. doi: 10.1037/1082-989X.4.2.139. [DOI] [PubMed] [Google Scholar]
- Nagin DS. Group-based Modeling of Development. Cambridge, MA: Harvard University Press; 2005. [Google Scholar]
- Nagin DS, Tremblay RE. Analyzing Developmental Trajectories of Distinct but Related Behaviors: A Group-Based Method. Psychological Methods. 2001;6:18–34. doi: 10.1037/1082-989X.6.1.18. [DOI] [PubMed] [Google Scholar]
- Neppl TK, Conger RD, Scaramella LV, Ontai LL. Intergenerational Continuity in Parenting Behavior: Mediating Pathways and Child Effects. Developmental Psychology. 2009;45:1241–1256. doi: 10.1037/a0014850. [DOI] [PMC free article] [PubMed] [Google Scholar]
- Pears K, Capaldi DM, Owen LD. Substance use risk across three generations: the roles of parent discipline practices and inhibitory control. Psychology of Addictive behaviors. 2007;21:373–386. doi: 10.1037/0893-164X.21.3.373. [DOI] [PMC free article] [PubMed] [Google Scholar]
- Raudenbush SW, Bryk AS. Hierarchical Linear Models: Applications and Data Analysis Methods. Second Edition. Newbury Park, CA: Sage; 2002. [Google Scholar]
- Roeder K, Lynch KG, Nagin DS. Modeling Uncertainty in Latent Class Membership: A Case Study in Criminology. Journal of the American Statistical Association. 1999;94:766–776. doi: 10.2307/2669989. [DOI] [Google Scholar]
- Rutter M. Some research considerations on intergenerational continuities and discontinuities: Comment on the special section. Developmental Psychology. 1998;34:1269–1273. doi: 10.1037/0012-1649.34.6.1269. [DOI] [PubMed] [Google Scholar]
- Schulenberg JE, Merline AC, Johnston LD, O’Malley PM, Bachman JG, Laetz VB. Trajectories of marijuana use during the transition to adulthood: The big picture based on national panel data. Journal of Drug Issues. 2005;35:255–279. doi: 10.1177/002204260503500203. [DOI] [PMC free article] [PubMed] [Google Scholar]
- Serbin L, Karp J. The intergenerational transfer of psychosocial risk: Mediators of vulnerability and resilience. Annual Review of Psychology. 2004;55:333–363. doi: 10.1146/annurev.psych.54.101601.145228. [DOI] [PubMed] [Google Scholar]
- Serbin L, Peters P, Schwartzman A. Longitudinal study of early childhood injuries and acute illnesses in the offspring of adolescent mothers who were aggressive, withdrawn, or aggressive/withdrawn in childhood. Journal of Abnormal Psychology. 1996;105:500–507. doi: 10.1037/0021-843X.105.4.500. [DOI] [PubMed] [Google Scholar]
- Serbin LA, Stack DM. Introduction to the special section: Studying intergenerational continuity and the transfer of risk. Developmental Psychology. 1998;34:1159–1161. doi: 10.1037/0012-1649.34.6.1159. [DOI] [PubMed] [Google Scholar]
- Simons RL, Whitbeck LB, Conger RD, Chiy-In W. Intergenerational transmission of harsh parenting. Developmental Psychology. 1991;27:159–171. doi: 10.1037/0012-1649.27.1.159. [DOI] [Google Scholar]
- Thornberry TP. The apple doesn’t fall far from the tree (Or does it?): Intergenerational patterns of antisocial behavior. Criminology. 2009;47:297–325. doi: 10.1111/j.1745-9125.2009.00153.x. [DOI] [PMC free article] [PubMed] [Google Scholar]
- Thornberry TP. Three generation studies: Methodological challenges and promise. In: Shanahan MJ, Mortimer JT, Kirkpatrick Johnson M, editors. Handbook of the Life Course. Vol. 2. New York: Springer; 2016. [Google Scholar]
- Thornberry TP, Freeman-Gallant A, Lizotte AJ, Krohn MD, Smith CA. Linked lives: The intergenerational transmission of antisocial behavior. Journal of Abnormal Child Psychology. 2003;31:171–184. doi: 10.1023/A:1022574208366. [DOI] [PubMed] [Google Scholar]
- Thornberry TP, Henry KL. Intergenerational continuity in maltreatment. Journal of Abnormal Child Psychology. 2013;41:555–569. doi: 10.1007/s10802-012-9697-5. [DOI] [PMC free article] [PubMed] [Google Scholar]
- van de Weijer SG, Bijleveld CC, Blokland AA. The intergenerational transmission of violent offending. Journal of Family Violence. 2014;29:109–118. doi: 10.1007/s10896-013-9565-2. [DOI] [Google Scholar]
- Widom CS, Czaja SJ, DuMont KA. Intergenerational transmission of child abuse and neglect: Real or detection bias? Science. 2015;347:1480–1485. doi: 10.1126/science.1259917. [DOI] [PMC free article] [PubMed] [Google Scholar]