

Summary
N6-methyladenosine (m6A), the most prevalent internal RNA modification on mammalian messenger RNAs (mRNAs), regulates fates and functions of modified transcripts through m6A-specific binding proteins1–5. m6A is abundant in the nervous system and modulates various neural functions6–11. While m6A marks groups of mRNAs for coordinated degradation in various physiological processes12–15, the relevance of m6A in mRNA translation remains largely unknown in vivo. Here we show that, through its binding protein Ythdf1, m6A promotes protein synthesis of target transcripts in response to neuronal stimuli in the adult mouse hippocampus, thereby facilitating learning and memory. Mice with genetic deletion of Ythdf1 (Ythdf1-KO) exhibit learning and memory defects as well as impaired hippocampal synaptic transmission and long-term potentiation. Ythdf1 re-expression in the hippocampus of adult Ythdf1-KO mice rescues behavioral and synaptic defects, while hippocampus-specific acute knockdown of Ythdf1 or Mettl3, the catalytic component of m6A methyltransferase complex, recapitulates the hippocampal deficiency. Transcriptome-wide mapping of Ythdf1 binding sites and m6A sites on hippocampal mRNAs uncovered key neuronal genes. Nascent protein labeling and tether reporter assays in hippocampal neurons revealed that Ythdf1 enhances protein synthesis in a neuronal-stimulus-dependent manner. Collectively, our results uncover a pathway of mRNA m6A methylation in learning and memory, which is mediated through Ythdf1 in response to stimuli.
Main text:
The discovery of reversible RNA methylation and transcriptome-wide mapping of m6A has sparked extensive research on functions of m6A methylation in diverse biological processes recently16–19, and several studies have demonstrated that m6A governs mRNA stability during cell fate transition and animal development1,12–15. m6A also affects mRNA translation. In HeLa cells, an m6A binding protein YTHDF1 facilitates translation initiation of m6A-modified mRNAs3; while in MCF7 cells, the function of YTHDF1 on translation is more complex, with negative effects observed using reporters20. Therefore, how m6A modulates mRNA translation and to what extent this function impacts physiological events in intact biological systems, remain to be elucidated.
Previous studies have suggested that m6A modulates neuronal functions, including dopaminergic signaling in the mouse midbrain6, flight behavior in flies7, mouse adult neurogenesis8, and mouse axon regeneration9. Upregulation of m6A has been observed with brain maturation19, behavioral experience10, and memory formation11, suggesting a correlation between m6A accumulation and brain activity. Learning and memory are fundamental functions of brains, and long-term memory formation is believed to require activity-induced protein synthesis21. We speculated whether learning and memory processes could be affected by translational effects of m6A and its binding protein Ythdf1.
In the mouse brain, Ythdf1 mRNA is preferentially expressed in the hippocampus22, a key region participating in spatial learning and memory. We constructed Ythdf1 CRISPR/Cas9 knockout mice (Ythdf1-KO) (Extended Data Fig. 1a-d)23, of which complete elimination of Ythdf1 protein was verified in the hippocampus and other brain regions (Fig. 1a; Extended Data Fig. 1e-f). Compared to wild-type (WT) control littermates, Ythdf1-KO mice develop normally before sacrifice (up to four months) of age and appear normal in gross hippocampal histology (Fig. 1b), adult hippocampal neurogenesis (Extended Data Fig. 2a-b), and cortical morphology (Extended Data Fig. 2c-d). Moreover, loss of Ythdf1 does not alter mouse motor abilities and general emotional states (Extended Data Fig. 2e-m).
Figure 1 |. Impaired spatial learning and memory in Ythdf1-KO mice.

a, b, Representative images of Ythdf1 immunostaining (a) and Hoechst (b) in the control and Ythdf1-KO hippocampus. DG, dentate gyrus; P30/P120, postnatal day 30/120. c, d, Learning curves of control (blue) and Ythdf1-KO (red) mice in Morris water maze (MWM) tests in visible (c) and hidden (d) platform training. e, Quadrant time (%) (left) and representative swimming paths (right) of control and Ythdf1-KO mice in the MWM probe test. The red dash line represents the chance level (25%). f, Learning curves of control (blue) and Ythdf1-KO mice (red) for contextual fear conditioning (FC) in moderate (left) or strong (right) training sessions. Base, baseline; ITI, inter-trial interval. g, h, Contextual fear memory assessed 24 hours (g) or 2 hours (h) after the indicated FC. P values, two-way ANOVA with two tailed t-test (relative to “Target” or between genotypes) (e), two-way repeated measures ANOVA with post hoc test (c, d, f), and two-tailed t-test (g, h). Numbers in bars, numbers of mice. Error bars, mean ± s.e.m.
We first examined hippocampus-dependent spatial learning and memory of the mice by Morris water maze (MWM) tests (Extended Data Fig. 3a; also see Methods)24. In visible platform training, Ythdf1-KO mice performed as proficiently as WT control mice (Fig. 1c), indicating normal visual functions and competent acquisition of procedural learning. However, in hidden platform training, Ythdf1-KO mice spent longer time navigating to the platform than control mice (Fig. 1d), suggesting impaired spatial learning. In the probe test, Ythdf1-KO mice failed to remember previous platform location, spending similar time in each quadrant despite being normal in swimming activity (Fig. 1e; Extended Data Fig. 3b-c), suggesting defects in spatial memory.
To further confirm the importance of Ythdf1 in hippocampus-dependent learning and memory, we performed classical fear conditioning tests (Extended Data Fig. 3d; also see Methods). Contextual fear memory is sensitive to hippocampal defects, while auditory fear memory depends on the amygdala25. Electric shock intensity was titrated to establish fear conditioning protocols that did not saturate fear response (Extended Data Fig. 3e). Under a moderate training protocol (0.5 mA, 2 s, 1 pair), Ythdf1-KO mice showed less freezing response during inter-trial intervals (ITI) but not when the tone sounded (Fig. 1f; Extended Data Fig. 3f), suggesting that contextual but not auditory learning was impaired. 24 hours after conditioning, Ythdf1-KO mice showed deficits in contextual but not auditory fear memory (Fig. 1g; Extended Data Fig. 3g). Consistently, under a weaker training protocol (0.5 mA, 1s, 1 pair), 2-hour contextual but not auditory fear memory of the mice was impaired (Fig. 1h; Extended Data Fig. 3h). Together, these data support that genetic deletion of Ythdf1 disrupts learning and memory formation in the mouse hippocampus.
We next used electrophysiological characterization to study how Ythdf1 depletion affects hippocampal synaptic functions. Basal synaptic properties of hippocampal CA1 neurons were examined by whole-cell patch-clamp (see Methods). In Ythdf1-KO CA1 neurons, spontaneous miniature excitatory postsynaptic currents (mEPSCs) were significantly decreased in amplitude and frequency, compared to control (Fig. 2a-b). Paired-pulse ratios (PPRs) analyses also indicate reduced presynaptic release probability in Ythdf1-KO CA1 neurons (Extended Data Fig. 4a-b), confirming the defects in basal synaptic transmission. Morphologically, Ythdf1-KO CA1 neurons have reduced dendritic spine density yet unaltered spine size (Extended Data Fig. 4c-d).
Figure 2 |. Deficient basal transmission and plasticity in Ythdf1-KO hippocampal synapses.

a, b, Representative traces (a) and quantification of amplitude (b, left) and frequency (b, right) of spontaneous miniature excitatory postsynaptic currents (mEPSCs) in control and Ythdf1-KO hippocampal CA1 neurons. c, d, Summary plots (c) and average amplitude (d) of long-term potentiation (LTP) induced by 2 × high frequency stimulation (HFS) in the CA1 region of control and Ythdf1-KO acute slices. fEPSP, field excitatory postsynaptic potential. e, f, Summary plots (e) and average amplitude (f) of late phase LTP induced by 4 × HFS. Top panels, sample traces taken at time points 1 and 2 indicated above the summary plots; scale bars, 10 ms (horizontal) and 0.2 mV (vertical) (c, e). g, h, Representative western blots (g) and quantification (h) of a number of LTP-related proteins in the control and Ythdf1-KO hippocampal postsynaptic density (PSD) fraction. P values, Kolmogorov-Smirnov test for cumulative distributions followed by comparisons with Mann–Whitney U test (b) and two-tailed t-test (d, f, h). Numbers in bars, numbers of neurons/mice (b), slices/mice (d, f), and mice (h). Error bars, mean ± s.e.m.
Long-term potentiation (LTP) is a major cellular model for explaining learning and memory. To test whether Ythdf1 modulates long-term synaptic plasticity, we recorded LTP induced by high frequency stimulation (HFS) in the CA1 region of hippocampal slices. Compared to WT controls, Ythdf1-KO slices failed to generate normal levels of field excitatory postsynaptic potential (fEPSP) after 2 × HFS induction (Fig. 2c-d). Initial potentiation following HFS was similar between control and Ythdf1-KO slices (Fig. 2c); therefore, it is less likely that the decreased LTP was due only to impairments in basal synaptic transmission. Ythdf1-KO slices were also defective in late phase LTP (induced by 4 × HFS) (Fig. 2e-f), a process requiring activity-induced synaptic protein synthesis. Indeed, depletion of Ythdf1 noticeably reduced the abundance of key proteins involved in LTP in the postsynaptic density (PSD) fraction of hippocampal neurons (Fig. 2g-h; Extended Data Fig. 4e), although such decreases were not observed for those proteins in the whole hippocampal tissue (Extended Data Fig. 4f). Together, these results suggest that Ythdf1 depletion in mice impairs basal synaptic transmission and LTP in hippocampal neurons, contributing to the observed defects in learning and memory.
To confirm that the observed defects were derived from the loss of Ythdf1 specifically in the hippocampus, we investigated whether re-expressing Ythdf1 in the hippocampus of adult KO mice would be sufficient to rescue the phenotypes. We delivered the adeno-associated virus (AAV) expressing either Ythdf1 (AAV-Ythdf1) or a control fluorescent protein mCherry (AAV-control) specifically to the hippocampus by bilateral stereotactic injection (Fig. 3a-b), resulting in selective re-expression in injected regions (Fig. 3c; Extended Data Fig. 5a-c). Hippocampal Ythdf1 re-expression in the KO mice substantially enhanced their learning and memory performances in MWM tests (Fig. 3d-e; Extended Data Fig. 5d) and rescued contextual fear memory to normal levels (Fig. 3f), with no obvious effect on auditory fear memory, anxiety-like behavior, nor motor activity (Fig. 3g; Extended Data Fig. 5e-h); it also reversed hippocampal LTP deficiency in Ythdf1-KO mouse (Fig. 3h-j).
Figure 3 |. Selective Ythdf1 re-expression in the hippocampus rescues defects in memory and synaptic plasticity.

a, Schematics of AAV constructs overexpressing Ythdf1 (AAV-Ythdf1) or control (AAV-control). ITR, inverted terminal repeats; CMV, cytomegalovirus promoter; WPRE, Woodchuck Hepatitis Virus Posttranscriptional Regulatory Element. b, Illustration of bilateral viral injections into the mouse hippocampus. The mouse brain in this figure has been reproduced with permission from the atlas of Paxinos and Franklin 2004.e29. c, Representative fluorescence images of the mouse hippocampus after AAV infection, Hoechst, blue; Ythdf1 co-expressed with mCherry, red. d-g, Learning curves in MWM hidden-platform trainings (d), quadrant time (%) in MWM probe tests (e), and contextual (f) and auditory (g) fear memories assessed 24 hours after fear conditioning, of Ythdf1-KO mice injected with AAV-control (red) or AAV-Ythdf1 (blue), compared to uninjected wild-type (WT, green). h-j, Representative traces (h), summary plots (i), and average amplitude (j) of LTP induced by 2 × HFS in acute slices from Ythdf1-KO mice injected with AAV-Ythdf1 or AAV-control. Sample traces (h) were taken at the time points 1 and 2 indicated the summary plots (i). P values, two-way repeated measures ANOVA with post hoc two-tailed t-test (horizontal P values, AAV-Ythdf1 relative to AAV-control; vertical P values, comparisons between curves) (d), two-way ANOVA with post hoc two-tailed t-test (comparison within group or with “Target”) (e), one-way ANOVA with post hoc Fisher test (f, g), and two-tailed t-test (j). Numbers in bars, numbers of mice (e-g) and slices/mice (j). Error bars, mean ± s.e.m.
To test whether acute loss of Ythdf1 in the hippocampus was sufficient to induce the phenotypes of Ythdf1-KO mice, we injected AAV expressing a short hairpin RNA specifically targeting Ythdf1 transcripts (AAV-RNAi) to the hippocampus of adult WT mice (Extended Data Fig. 6a-b). In mice injected with AAV-RNAi, learning and memory performances in MWM tests were dramatically impaired (Extended Data Fig. 6c-f), as was contextual fear memory but not emotional states nor auditory fear memory (Extended Data Fig. 6g-i). Moreover, hippocampal-specific knockdown of Mettl3 (Extended Data Fig. 7a) also phenocopied the effects of Ythdf1 depletion, leading to defects in spatial memory and contextual fear memory without affecting auditory fear memory nor locomotor activities (Extended Data Fig. 7b-f). These knockdown results further support that the observed phenotypes in Ythdf1-KO mice come from direct depletion of Ythdf1 instead of potential developmental defects caused by lack of Ythdf1 and are m6A-dependent.
We next proceeded to investigate underlying molecular mechanisms. We mapped Ythdf1 binding sites and m6A sites on hippocampal mRNAs using crosslinking-and-immunoprecipitation-based sequencing methods (CLIP-seq) (Supplementary Table 1). Biological triplicates of Ythdf1-CLIP-seq identified 3,552 common peaks as high-confidence peaks (Extended Data Fig. 8a) on 1,042 transcripts (defined as “Ythdf1-CLIP targets”; Supplementary Table 2), with validated pull-down efficiency of Ythdf1(Extended Data Fig. 8b). About two-thirds of the high-confidence Ythdf1-CLIP peaks are mapped to mature mRNAs (Fig. 4a) and enriched near the stop codon and 3’UTR (Fig. 4b). Functional annotation of Ythdf1-CLIP targets reveals substantial enrichment for synaptic transmission and LTP (Fig. 4c; Supplementary Table 2), consistent with the neuronal phenotypes observed in Ythdf1-KO mice.
Figure 4 |. Ythdf1 facilitates translation of m6A-modified targets in response to neuronal stimuli.

a, b, Distributions of high-confidence Ythdf1-CLIP peaks in different regions of genome (a) and transcripts (b). c, Functional annotation of Ythdf1-CLIP targets (n = 1,032) in the adult mouse hippocampus. d, Box-plots of the number of m6A-CLIP peaks (left) and the log2 number of m6A-CLIP-seq mutations (right) on m6A-modified transcripts, non-Ythdf1-CLIP transcripts, and Ythdf1-CLIP targets. e, f, Representative images (e) and quantification (f) of nascent protein (Nascent-P) synthesis in cultured control and Ythdf1-KO hippocampal neurons before (sham) and 2 hours after KCl depolarization. Nascent-P signals were normalized to that of control neurons under sham condition. g, Schematics of a tether reporter system that mimics the binding between Ythdf1 and 3’UTR m6A sites of target transcripts. Ythdf1-N, truncated N-terminal mouse Ythdf1 (1–389 aa); F-Luc/R-Luc, firefly/Renilla luciferase. h, Normalized F-Luc reporter expression in cultured hippocampal neurons tethered with Ythdf1-N or control, before (sham) and after KCl depolarization. i, Box-plots of transcript abundance log2 fold change between electroconvulsive treated (ECT) and untreated (Mock) dentate gyrus, for m6A-modified transcripts, m6A-modified non-Ythdf1-CLIP transcripts, and transcripts with overlapped Ythdf1-CLIP and m6A-CLIP peaks, in “Input” (left) and m6A-enriched “RIP” (right) RNA-seq libraries. Dash lines, median log2 fold change of all reliably detected transcripts (rpkm > 1). Box-plot elements: center line, median; box limits, upper and lower quartiles; whiskers, 1–99%; error bars, 95% CI of mean; number in parentheses, number of genes (d, i). P values, two-sided unpaired Kolmogorov-Smirnov test (d, i) and two-tailed t-test (f, h). Numbers in bars, numbers of images/mice (f) and biologically independent samples (h). Error bars, mean ± s.e.m (f, h).
Biological triplicates of m6A-CLIP-seq, using purified hippocampal poly(A)+ RNA, yielded ~11,000 common peaks with the GGACU consensus sequence and enrichment at CDS and 3’UTR (Extended Data Fig. 8c-e) on 3,460 transcripts (defined as “m6A-modified transcripts”; Supplementary Table 1, 3). Similarly, genes mediating neuronal biological processes are overrepresented in m6A-modified transcripts (Extended Data Fig. 8f; Supplementary Table 3). At the transcript level, Ythdf1-CLIP targets on average bear higher numbers of m6A-CLIP peaks and crosslinking-induced mutations detected in the m6A-CLIP-seq, either compared to transcripts without Ythdf1-CLIP peaks (defined as “non-Ythdf1-CLIP transcripts”), or compared to m6A-modified transcripts (Fig. 4d); at the peak level, 30% of Ythdf1-CLIP peaks overlap (> 1 nt) with m6A-CLIP peaks (Extended Data Fig. 8g; in comparison, 0.65–0.72% of background peaks overlap with m6A-CLIP peaks; also see Supplementary Table 3 and Methods). These results indicate that Ythdf1 preferentially recognizes m6A sites in the adult mouse hippocampus. Key synaptic plasticity transcripts, including Gria1, Grin1, and Camk2a, contain one or multiple overlapped Ythdf1-CLIP peaks and m6A-CLIP peaks (Extended Data Fig. 8h). We then profiled mRNA and protein abundance in the hippocampus of Ythdf1-KO and WT control mice. Note that Ythdf1-CLIP targets and m6A-modified transcripts exhibit a slight decrease in mRNA abundance (Extended Data Fig. 8i; Supplementary Table 1, 4) and no global protein level changes (Extended Data Fig. 8j; Supplementary Table 5) in Ythdf1-KO hippocampus compared to control.
These mild changes prompted us to investigate whether Ythdf1 functions in a neuronal-stimulus-dependent manner. To test this, we monitored nascent protein synthesis26 in cultured WT control and Ythdf1-KO hippocampal neurons before and after potassium chloride depolarization (KCl, 50 mM). KCl stimulation induced noticeable protein synthesis in control neurons but much less in Ythdf1-KO ones (Fig. 4e-f; Extended Data Fig. 9a-c). The same observation occurred between AAV-mediated control and Ythdf1-knockdown neurons (Extended Data Fig. 9d-e). We also constructed a reporter system in which the N-terminus of Ythdf1 (Ythdf1-N) was tethered to the 3’UTR of the firefly luciferase (F-Luc) coding sequence, mimicking direct binding of Ythdf1 on m6A-modified transcripts; Renilla luciferase was co-transfected for normalization (Fig. 4g)3. Ythdf1-N tethering did not affect F-Luc protein level before KCl stimulation (Fig. 4h, left), consistent with proteomics results (Extended Data Fig. 8j). However, increased F-Luc production was observed at 2 and 4 hours post KCl stimulus for Ythdf1-N tethering compared to the control (Fig. 4h), supporting that Ythdf1 promotes protein synthesis upon neuronal stimulation. Indeed, Bsn, one of the top Ythdf1-CLIP targets, showed attenuated protein expression after fear conditioning (FC) in the Ythdf1-KO hippocampus, as did Camk2a in the Ythdf1-KO PSD fraction (Extended Data Fig. 10a). After FC, Ythdf1 protein increased by 30% in the PSD fraction, although no change occurred at the tissue level (Extended Data Fig. 10b-c). This suggests that Ythdf1 may undergo translocation to PSD in response to stimulus, which could contribute to localized translation in synapses and thus synaptic plasticity.
We also examined potential m6A landscape changes in the dentate gyrus (DG) in an electroconvulsive treatment (ECT) model, in which dentate granule cells are synchronously activated27,28. The m6A-RIP-seq of DG mRNAs (Extended Data Fig. 10d; also see Methods) showed that while the level of Ythdf1-CLIP targets was not differentially regulated in response to ECT compared to other transcripts, the m6A-methylated copies of Ythdf1-CLIP targets were up-regulated in abundance after ECT (Fig. 4i; Supplementary Table 1, 6), suggesting that more binding of Ythdf1 to its m6A-methylated targets may occur upon stimulation to facilitate translation as well as to help stabilize them (Supplementary Discussion).
In summary, we show that mRNA m6A methylation facilitates learning and memory formation in the mouse hippocampus mainly by promoting translation from target transcripts upon neuronal stimuli, mediated through its binding protein Ythdf1. Depletion of Ythdf1 impairs basal transmission and LTP of hippocampal synapses. The presence of Ythdf1 could expedite new protein synthesis required for long-lasting changes of synapse plasticity and thus memory formation, whereas, in Ythdf1-KO mouse hippocampus, stimulus-dependent protein synthesis is attenuated, resulting in less efficient synaptic strengthening and a lower probability of reaching “thresholds” for memory formation (Extended Data Fig. 10e). The m6A-dependent translation promotion could be stimulation-induced as shown here for Ythdf1, potentially a general theme for RNA methylation-dependent translational regulation1.
METHODS
Data reporting.
No statistical methods were used to predetermine sample size. The sample sizes in this manuscript were similar to previous papers3,30. Experimenters were blind to the genotype and treatment for all behavioral tests.
Animals.
All animals were maintained under a 12/12-hour light/dark cycle with lights on at 7:00 AM, and temperature and humidity were kept at 22 ± 1 °C, 55% ± 5%, with ad libitum access to food and water. Male adult (8–16 weeks of age) mice were used for behavioral tests. Animal experiments, except for electroconvulsive treatment (ECT), were carried out in accordance with protocols approved by the Institutional Animal Care and Use Committee of the School of Life Science and Technology of Shanghaitech University and with the Guidance Suggestions for the Care and Use of Laboratory Animals, formulated by Ministry of Science & Technology of the People’s Republic of China. Animal procedures used in ECT were performed in accordance with protocols approved by the Institutional Animal Care and Use Committee of Johns Hopkins University School of Medicine and University of Pennsylvania School of Medicine.
Cell lines.
The N2A cell line used in in vitro transfection experiments was purchased from Cell Bank of Chinese Academy of Sciences and authenticated by the supplier. It is not in the list of commonly misidentified cell lines maintained by the International Cell Line Authentication Committee (ICLAC). Cells were tested negative for mycoplasma contamination before use.
Generation of Ythdf1-KO mice.
The YTH domain family protein-1 knockout mice (Ythdf1-KO) were generated based on CRISPR/Cas9. sgRNA expression plasmids were generated by annealing and cloning oligos that were designed to target Exon 4 of Ythdf1 into the BsaI sites of pUC57-sgRNA (Addgene 51132).
mYthdf1-E4–1 T7 gRNA up: TAGGATAGTAACTGGACAGGTA
mYthdf1-E4–1 gRNA down: AAACTACCTGTCCAGTTACTAT
mYthdf1-E4–2 T7 gRNA up: TAGGCACCATGGTCCACTGCAG
mYthdf1-E4–2 gRNA down: AAACCTGCAGTGGACCATGGTG.
In vitro transcription and microinjection of CRISPR/Cas9 were performed as previously described23. Briefly, Cas9 expression construct pST1374-Cas9-N-NLS-Flag-linker-D10A (Addgene 51130) was linearized with Age I and transcribed using the mMACHINE™ T7 Ultra Kit (Ambion, AM1345). Cas9 mRNA was purified by RNeasy Mini Kit (Qiagen, 74104). pUC57-sgRNA expression vectors were linearized by Dra I and transcribed using the MEGAshortscript Kit (Ambion, AM1354). sgRNAs were purified by MEGAclear Kit (Ambion, AM1908). A mixture of Cas9 mRNA (20 ng/μl) and two sgRNAs (5 ng/μl each) was injected into cytoplasm and male pronucleus of zygotes obtained by mating of CBF1. Injected zygotes were transferred into pseudo-pregnant CD1 female mice. Founder mice used for experiments were backcrossed to C57BL/6 for at least five generations. Ythdf1-KO mice used for the experiments were sacrificed at age of 8–16 weeks and did not show obvious development defects before sacrifice.
mYthdf1-E4 C9 For: CACCTGAGTTCAGATCATTAC
mYthdf1-E4 C9 Rev: GCTCCAGACTGTTCATCC.
Amplicon length: 650 bp. Applicable to genotyping founders and targeted ESC.
Genotyping.
Mice were weaned at third postnatal week and genotyped by PCR. Ythdf1-KO and wild-type alleles were detected by PCR assays in which primer F1 (5’-GTGTATGAGGTGGTCAGCAT-3’) and primer R1 (5’-CTTGTTGAGGGAGTCACTGT-3’) amplified a 465-bp fragment (wild-type) and a 286-bp fragment (Ythdf1-KO) (Extended Data Fig. 1d).
Open-field test.
Mice were exposed to a square open arena (40 cm × 40 cm) with opaque base and walls (40 cm high). Each mouse was allowed 30 min to explore the area and its activity was recorded and analyzed using the Tru Scan Activity System (Coulbourn Instruments). The surface was cleaned with 70% ethanol after each mouse was tested.
Elevated-plus maze.
Elevated-plus maze apparatus consists of two open arms (50 cm × 9 cm), two enclosed arms (50 cm × 9 cm × 39 cm) and a central area (9 cm × 9 cm). The maze is elevated 70 cm above ground in a room with normal light. Mice were placed in the central area individually and allowed 5 min to explore the maze. The time each mouse spent in the open arms during the 5-min exploration was counted by Anymaze software.
Light-dark box transition test.
The light and the dark compartments of the light-dark transition box (35 cm × 35 cm × 40 cm) were separated by an opaque plexiglass board with a hole. The light compartment was illuminated by strong light (400 lux). During the test, mice were individually placed at the center of the light compartment facing away from the hole and allowed 30 min to explore freely in the box. Activity of each mice was monitored. The time mice spent in the light compartment as well as the number of transitions between the two compartments were automatically calculated by Tru Scan Activity System (Coulbourn Instruments).
Tail-suspension test.
Tail-suspension test was used to assess behavioral despair of mice. Each mouse was suspended by its tail with an adhesive tape for 6 min and was video recorded. Total immobility time during the test was scored by independent observers. Mice were considered immobile only when hung passively and motionlessly for at least 2 seconds.
Morris water maze task.
Morris water maze test was specifically designed to evaluate spatial reference memory abilities (Extended Data Fig. 3a)24. The Morris water-tank consists of a circular pool (diameter 120 cm, height 50 cm) filled with water maintained at room temperature (23 ± 1ºC) and is made opaque with nontoxic white paint. The pool is located in an experimental room with many extra-maze visual cues and virtually divided into four equal quadrants. A circular platform, 10 cm in diameter, is placed in the middle of one fixed quadrant (“target”) of the pool, just above water surface (visible platform) or 1 cm underneath the water surface (hidden platform). For visible platform training, mice were given a training of four trials with 30 min inter-trial intervals each day for two consecutive days, and they were released from each starting point in a random order. For hidden platform training, mice were given a training of four trials each day for five consecutive days. 24 hours after last trial of training (day 6), the platform was removed and all mice were given one probe trial for 60 sec searching (probe test). The escape latency to visible or hidden platform and the exploring time in each quadrant of the pool were automatically recorded by water maze system (Coulbourn, Inc.). Mice were trained at the same time of a day during their light phase.
Contextual and auditory fear conditioning.
The fear conditioning test was performed as previously described (Extended Data Fig. 3d)31. Mice were first handled for 5 min each day for three consecutive days and habituated to the conditioning chamber for 5 min the day before training. On the day of training, after 3 min exploration in the conditioning chamber, each mouse received one pairing of a tone (2,800 Hz, 75 dB, 30 s) with a short co-terminating foot shock (0.5 mA, 1 s) for the weak training protocol, a long foot shock (0.5 mA, 2 s) for the moderate protocol, or three pairings of a tone (2,800 Hz, 75 dB, 30 s) with a long co-terminating foot shock (0.5 mA, 2 s) for the strong protocol, after which they were remained in the chamber for additional 30 s and then returned to home cages. 2 hours and 24 hours after the conditioning, mice were tested for freezing (behavioral immobility) in response to the training context (training chamber) and to the tone (in the training chamber with a new environment and odor). The percentage of freezing time was calculated as an index of fear learning and memory. For contextual fear memory tests, mice were returned to the conditioning chamber for 3 min and freezing behavior was counted using StartFear Combined system (Panlab). For auditory fear memory tests, mice were placed in a changed chamber and freezing responses were recorded during the last 3 min when the tone was delivered. Tests of contextual and auditory fear memory were done in a counterbalanced manner.
Electrophysiological recording of hippocampal slices.
Extracellular field recordings and whole-cell miniature excitatory postsynaptic current (mEPSC) recordings in the hippocampal CA1 region were conducted in 380 μm thick acute brain slices from 6–9-week-old wild-type control and Ythdf1-KO mice of either sex. Coronal sections that contain hippocampal formations were prepared according to the previously described method32. Briefly, mice were anaesthetized with sodium pentobarbital and were sacrificed by decapitation. Transverse slices of the hippocampus (380 μm) were cut using the vibratome at 4 °C in a modified artificial cerebrospinal fluid (mACSF) consisting of 110 mM Choline chloride, 2.5 mM KCl, 0.5 mM CaCl2, 7 mM MgSO4, 25 mM NaHCO3, 1.25 mM NaH2PO4, 25 mM D-glucose, and 3.1 mM sodium pyruvate, which was saturated with 95% O2 and 5% CO2. Slices were transferred to an incubating chamber with oxygenated (95% O2 and 5% CO2) normal ACSF containing 120 mM NaCl, 2.5 mM KCl, 2.5 mM CaCl2, 1.3 mM MgSO4, 26 mM NaHCO3, 1 mM NaH2PO4, 10 mM D-glucose (pH 7.3–7.4) and incubated at 30 °C for at least 2 hours before recording. Data were collected with a MultiClamp 700B (Molecular Devices), digitized using Digidata 1440A and pClamp 10.1 data acquisition system (Molecular Devices). Frequency, duration and magnitude of extracellular stimulus were controlled with a Master 8 pulse stimulator (A-M Systems). Evoked synaptic responses were triggered with a bipolar electrode.
LTP and PPF.
To record the extracellular field excitatory postsynaptic potentials (fEPSPs), a glass micro-electrode (4–8 MΩ, filled with 0.5 M sodium acetate) was placed in the stratum radiatum of the CA1 region, and a bipolar tungsten stimulating electrode was placed along the Schaffer collateral fibers and was 100–150 μm away from the recording pipette. Intensity of the stimulation was adjusted to produce an fEPSP with an amplitude of 30–40% of the maximum response. Test stimulation was delivered once per 30 seconds (0.033 Hz) or per minute (0.017 Hz). After recording a stable baseline for at least 30 min, early-phase LTP or later-phase LTP was induced by two (100 Hz for 1 s, 30 s interval) or four trains (100 Hz for 1 s, 5 min interval) high-frequency stimulation (HFS), respectively. Magnitudes of LTP and L-LTP were calculated based on the averaged fEPSP values during the last 10 min and 30 min of summary plots, respectively.
For paired-pulse facilitation (PPF) recording, a second stimulus was delivered following the first one with different time intervals. The two stimuli were separated by 20, 40, 60, 80, 100, 200, 400, 600, 800, and 1,000 ms interval. The amplitude of the population response to the second stimulus was compared with that to the first one to obtain the PPF ratio.
Miniature EPSCs.
Voltage clamp recordings were obtained from neurons in hippocampus slices equilibrated for at least 1 hour in the recording chamber. Micropipettes (tip diameter: 1.5 to 2.0 μm; resistance: 4 to 6 MΩ) were pulled from borosilicate capillaries (P-97; Sutter Instruments) and filled with an internal solution (adjusted to pH 7.2) composed of 145 mM potassium gluconate, 5 mM NaCl, 1 mM MgCl2, 0.2 mM EGTA, 10 mM HEPES, 2 mM magnesium adenosine triphosphate, 0.1 mM sodium-guanosine-5’-triphosphate, and 10 mM phosphocreatine disodium. For mEPSC recordings, 0.5 μM tetrodotoxin was added to the perfusion solution. Picrotoxin (100 μM) was present in all of experiments to block γ-aminobutyric acid (GABA) type A receptor–mediated inhibitory synaptic currents. Neuron signals, which were amplified using an Axoclamp-700B amplifier (bandwidth filter set at 1 kHz for voltage clamp recordings) were digitized (Digidata 1440A, pClamp 10.1; Molecular Devices). The series resistance was 12 to 20 MΩ and was monitored throughout the experiment. Data were discarded when access resistance changed by more than 15% during the experiment.
Plasmid constructs and viruses.
For reporter assay, pPB-CAG-Flag-Ythdf1-N-λ and pPB-CAG-Flag-λ were constructed by inserting the Flag-Ythdf1-N-λ (Ythdf1-N: N-terminus of mouse Ythdf1, 1–389 aa) and Flag-λ fragments into pPB-CAG backbone vector between BglII and XhoI restriction sites, respectively. For AAV vectors, pAAV-CMV-mYthdf1–2a-mCherry-WPRE, pAAV-CMV-mCherry-WPRE, pAAV-CMV-RFP-U6-Ythdf1-shRNA, pAAV-CAG-eGFP-H1-Ythdf1-shRNA, and pAAV-CAG-eGFP-H1-Mettl3-shRNA were all designed and constructed by standard methods. The following oligonucleotide sequences were used for knockdown:
Ythdf1-shRNA: 5’-GATCCTTACCTGTCCAGTTAC-3’
Mettl3-shRNA: 5’-GCACACTGATGAATCTTTAGG-3’
Scramble control: 5’-AACAGTCGCGTTTGCGACTGG-3’.
AAV viruses were prepared by Taitool Biotech (Shanghai).
In vivo stereotactic injections.
For viral injection, male mice (8–10-weeks of age) were anesthetized with 5% chloral hydrate (100 μl/10 g body weight) by intra-peritoneal (i.p.) injection and placed on a stereotaxic apparatus. Small bilateral holes were drilled into the skull at −1.7 mm posterior and −1.5 mm lateral to bregma for injections into the hippocampal CA1 and dentate gyrus (DG) regions. Glass cannula filled with a virus solution was lowered to CA1 (−1.5 mm) and DG (−2.0 mm), and the virus solution (0.6 μl) were injected using a Nanoject II (Drummond) system at a rate of 0.1 μl per min sequentially into each side of hippocampus. Injection cannula was slowly withdrawn 5 min after the virus infusion. The scalp was then sealed and injected mice were monitored as they recovered from anesthesia. Behavioral experiments or electrophysiological recordings were performed at least 10 days after virus injection. Virus infection was examined at the end of all the behavioral tests.
Immunohistochemistry.
Ythdf1-KO and wild-type male mice (from P28 to 16-week old) were perfused with phosphate-buffered saline (PBS) followed by 4% paraformaldehyde in PBS. After post-fixation in 4% PFA for 12 hours at 4 °C and dehydration in 30% sucrose-PBS solution for another 24 hours, the brains were frozen-sectioned into coronal slices (35 μm) for next step use. For anti-Ythdf1 and anti-DCX staining, slices were incubated in diluted antibody solution at 4 °C overnight then detected by Alexa Fluor conjugated second antibodies. All slices were counterstained with Hoechst in the final step incubation. Fluorescent image acquisition was performed using Axioimager Z2 microscope or LSM 510 confocal microscope (Zeiss). Images were analyzed with Image-Pro Plus and ImageJ software. Brain slices from mice injected with AAV-CMV-mYthdf1–2a-mCherry-WPRE (AAV-Ythdf1) and AAV-CMV-mCherry-WPRE (AAV-control) were used for Ythdf1 over-expression quantification assay (Extended Data Fig. 5a-b). For Extended Data Fig. 2d, female mice (P60) were anesthetized and perfused with ice-cold 4% paraformaldehyde (PFA). Brains were collected from perfused animals, post-fixed overnight in 4% PFA in PBS, and cryoprotected in 30% sucrose (wt/vol) for 2–3 days. Samples were sectioned on a microtome at the thickness of 40 μm. Primary antibody was applied at 4°C overnight. Secondary antibody was applied for 2 hours at room temperature.
Western blot.
Samples were homogenized in RIPA buffer (Beyotime) containing 1 mM PMSF, 1×protease inhibitor cocktail and 1×phosphatase inhibitor cocktail (Sigma). Lysates were boiled at 100 °C with 6×loading buffer (Beyotime) for 8 min and then stored at −80 °C for next step use. A total of 30 μg protein per sample was resolved on SDS-PAGE (10%) at 80 V for 20 min and then 110 V for 110 min. Proteins on the gel were transferred onto PVDF membranes (Millipore) and blocked in 5% milk blocking solution for 1 hour at room temperature, incubated in a diluted primary antibody solution at 4 °C overnight, and incubated in a dilution of secondary antibody conjugated to HRP for 2 hours at room temperature (dilution folds indicated in the section of antibodies). Protein bands were detected using ECL western blotting detection reagents (Millipore) and Amersham Imager 600 system (GE).
Dissociated neuron culture and reporter assay.
Hippocampal neurons from E18 C57BL/6 mice embryos of either sex were cultured at a density of 200,000 cells per well on poly-D-lysine pre-coated 6-well plates. Neuron cultures were maintained in complete medium (Neurobasal medium supplemented with 0.5mM GlutaMAX-I and 2% B-27). Plasmid transfection was conducted using 4D-Nucleofector System (Lonza) immediately after neuron dissociation.
The reporter plasmid (pmirGlo-5BoxB) and the effecter plasmid (Flag-λ, or Flag-Ythdf1-N-λ in pPB-CAG vector) were used to transfect neuron cultures at a ratio of 1:9 as previously reported2,3. After transfection, neurons were plated in plating medium (Neurobasal medium supplied with 0.5 mM GlutaMAX-I, 2% B-27 and 5% FBS) for 6 hours, then changed to complete medium for further culturing. 3 days after transfection, neurons were treated with KCl at the final concentration of 50 mM for 2, 4, and 8 hours. Then neurons were collected and assayed by Dual-Glo Luciferase Assay Systems (Promega) to test protein production.
Quantitative mass spectrometry.
Hippocampal samples from WT control and Ythdf1-KO mice (8–12 weeks, male) were freshly isolated and snap frozen in liquid nitrogen. For each mouse, 100 mg tissues were used for further preparation. Tissues were ground into fine powder in liquid nitrogen then lysed with 500 μl freshly prepared lysis buffer (20 mM triethylammonium bicarbonate (TEAB, pH 8.5), 8 M urea, protease inhibitor cocktail (Roche), and 1 mM DTT). The yielded lysate was treated with ultrasonication at 4 °C for 30 s to shear DNA, followed by centrifuge at 16000×g for 10 min at 4 °C. The resultant supernatant was carefully separated and transferred into a new tube. Protein concentrations were measured using BCA Protein Assay Kit (Thermo Scientific). For each condition, a total of 100 μg protein was reduced with 5 mM tris(2-carboxyethyl)phosphine (TCEP) for 3 hours at 30 °C, then alkylated with 10 mM methyl methanethiosulfonate (MMTS) for 45 min at room temperature (protected from light). Samples were then diluted with 20 mM TEAB to obtain a final concentration of 1 M urea prior to digestion with 2.5 μg trypsin overnight at 37 °C. Resultant tryptic peptides were finally labeled with TMT10plex Mass Tag Labeling Kit (Thermo Scientific) according to manufacturer’s protocol and followed with LC−MS/MS analysis.
PSD preparation.
Hippocampal tissues from WT and Ythdf1-KO mice (8–12 weeks, male) were isolated, snap frozen in liquid nitrogen, and stored at −80 °C before use. PSD fraction preparation was prepared as previously described32, hippocampal tissues were homogenized in homogenization buffer (320 mM sucrose, 5 mM sodium pyrophosphate, 1 mM EDTA, 10 mM HEPES (pH 7.4), 1×protease inhibitor cocktail, and 1×phosphatase inhibitor cocktail (Sigma)). Resultant homogenate was centrifuged at 800 × g for 10 min at 4 °C to yield post-nuclear pelleted fraction 1 (P1) and supernatant fraction 1 (S1). S1 was further centrifuged at 15,000×g for 20 min at 4 °C. Then pellet P2 (which contains synaptosome) was resuspended in 4 mM HEPES (pH 7.4) and incubated with agitation at 4 °C for 30 min. Suspended P2 was centrifuged at 25,000 × g for 20 min at 4 °C. Resulting pellet was resuspended in 50 mM HEPES (pH 7.4), mixed with an equal volume of 1% Triton X-100, and incubated with agitation at 4 °C for 15 min. PSD fraction was generated by centrifugation at 32,000 × g for 20 min at 4 °C. Final PSD pellet was resuspended in 50 mM HEPES followed by protein quantification and then boiled with 6×loading buffer for western blot.
Lucifer Yellow labelling by intracellular injection.
WT control and Ythdf1-KO mice (8–12 weeks, male) were perfused with 4% PFA in PBS and their brains were removed to perform the intracellular injection of the fluorescent dye Lucifer Yellow (LY). The brains were post-fixed for 24 h in 4% PFA in PBS, and coronal sections were obtained (200 μm). Intracellular injections were performed as previously described33. In brief, sections were placed under differential interference contract (DIC) microscope to find health CA1 neurons and a continuous current (5–10 nA) was used to inject cells with LY. At least five CA1 pyramidal cells per mouse were injected individually with LY, with the current applied till the distal tips of each dendrite fluoresced brightly (5–10 min). Images (z-stacks) for spine density counting were acquired using LSM 510 confocal microscope with a 63X oil objective. Spine counting and spine morphology analyses were performed using Neurostudio software.
Protein synthesis assay.
WT control and Ythdf1-KO mouse hippocampal neurons were cultured on pre-coated glass cover slides. Twelve days later, protein synthesis assay was conducted using Click-iT Plus OPP Alexa Fluor™ 488 Protein Synthesis Assay Kit (Invitrogen, C10456) following the manufacturer’s protocol. Briefly, the neurons were treated with 50 mM KCl for 10 min before the complete culture medium was changed back. Click-iT OPP (Component A) was diluted 1:1000 in pre-warmed culture medium as a 20 μM working solution. 2 hours or 4 hours after the KCl treatment, the culture medium was replaced with the working solution for another 30-min incubation under culturing conditions. The medium was then removed, and the neurons were washed once with PBS before being fixed and permeabilized with 4% PFA and 0.5% Triton X-100 (in PBS) for 15 min at room temperature, respectively. After two more rounds of wash with PBS, the neurons were incubated with a freshly prepared Click reaction cocktail for 30 min at room temperature in the dark and rinsed once with the reaction rinse buffer. Finally, neurons were counter stained with NuclearMask Blue Staining working solution and washed twice with PBS prior to imaging and analysis. For assays using AAV-mediated knockdown (Extended Data Fig. 9d-e), wild-type mouse hippocampal neurons were cultured on pre-coated glass cover slides, and in three days transfected with AAV-Ythdf1-RNAi-GFP (pAAV-CAG-eGFP-H1-Ythdf1-shRNA) or AAV-control-GFP. Four to five days after virus transfection, protein synthesis assay was conducted as described above using Click-iT Plus OPP Alexa Fluor™ 594 Protein Synthesis Assay Kit (Invitrogen, C10457). All the pictures were acquired using identical settings and analyzed using Image-Pro Plus. The Integrated Optical density (IOD) of fluorescent signals was divided by area value of Hoechst signals for each picture to derive the signal intensity of each neuron. For comparison, fluorescence intensities from experimental groups were normalized to that from control neurons under sham condition.
Ythdf1-CLIP-seq.
15 μg rabbit anti-Ythdf1 antibody (Proteintech, 17479–1-AP), 50 μl Protein A beads (ThermoFisher), 50 μl Protein G beads (ThermoFisher), and four pairs of hippocampi from C57BL/6 mice (9 weeks, male) were used for each biological replicate. Three biological replicates were performed.
For each replicate, Protein A/G beads were washed three times with PBST (PBS with 0.05% Tween-20) and resuspended with anti-Ythdf1 antibody in 250 μl PBST prior to overnight rotating at 4 °C. On the following day, mouse hippocampal tissues were dissected, homogenized in 500 μl HBSS buffer, and crosslinked in 6-well plates on ice for four times with 254 nm UV light, 0.15 J/cm2 per time (UV stratalinker 2400, Stratagene). 1.5 ml lysis buffer (150 mM NaCl, 0.5% NP-40, 50 mM Tris-HCl (pH 7.5), 2 mM EDTA, 1% protease inhibitor cocktail (Roche), 0.5 mM DTT) was added to the crosslinked tissue pellet for a 40-min rotating at 4 °C. After being cleared by maximum-speed centrifuge, the lysate underwent a first round of RNA digestion with 0.2 U/μl RNase T1 (ThermoFisher, EN0541) for 15 min at room temperature followed by a five-min quenching on ice. A 100 μl aliquot of the resultant lysate was saved as “Input”, and the remaining lysate was incubated with the Protein A/G beads conjugated with anti-Ythdf1 antibody. After three hours of rotating at 4°C, the beads were washed three times with 1 ml IP wash buffer (50 mM Tris-HCl (pH 7.5), 300 mM KCl, 0.05% NP-40, 0.5 mM DTT, 1% protease inhibitor cocktail), and resuspend in 200 μl IP wash buffer supplemented with 10 U/μl RNase T1 for a second round of RNA digestion for 8 min at room temperature. The previously saved “Input” was digested in parallel, and immediately supplemented with 4× Laemmli sample buffer (Bio-Rad). After a 5-min quenching on ice, the beads were washed three times with high-salt wash buffer (50 mM Tris-HCl (pH 7.5), 500 mM NaCl, 0.05% NP-40, 0.5 mM DTT, 1% protease inhibitor cocktail, 1% SUPERase• In™) and another three washes with PNK buffer (50 mM Tris-HCl (pH 7.5), 50 mM NaCl, 10 mM MgCl2). The RNA fragments co-immunoprecipitated with Protein A/G beads (“CLIP”) were subject to end-repair by: (1) 1 U/μl T4 PNK (ThermoFisher, EK0031) in 100 μl 1× PNK buffer A (ThermoFisher) at 37°C for 20 min with vigorous shaking; and then (2) 1 mM ATP (final concentration) with another 0.5 U/μl T4 PNK at 37°C for another 20 min. The beads were washed with PNK buffer for another five times and then resuspended in 100 μl 2× Laemmli sample buffer. The Ythdf1-RNA complex was size-selected by SDS-PAGE (size indicated in Extended Data Fig. 8b), and the gel slice at the same molecular weight was cut for “Input” samples in parallel. To extract RNA, the gel slices were mashed and digested with 2 mg/ml protease K (ThermoFisher, RNA-grade, 25530049) at 55°C for 1 hour. Then gel particles were filter out, and the RNA were purified by Acid-Phenol:Chloroform extraction and overnight ethanol precipitation. The “Input” RNA fragments were end-repaired using T4 PNK and further cleaned up using RNA Clean & Concentrator-5 (Zymo Research). RNA libraries were generated using NEBNext multiplex small RNA library preparation kit (NEB, E7300S) for both “Input” and “CLIP” samples.
m6A-CLIP-seq.
RNA extraction:
Total RNA was extracted from hippocampal tissue dissected from C57BL/6 mice (8–16 weeks, male) using Trizol (Invitrogen) and isopropanol precipitation. Poly(A)+ RNA was purified using Dynabeads™ mRNA DIRECT™ Purification Kit (Invitrogen) following the manufacturer’s instructions.
For the m6A-CLIP-seq, we followed the protocol reported12 with a smaller amount of starting material: 300 ng purified poly(A)+ RNA, with 2.5 μg anti-m6A antibody (Synaptic System, 202 003) and 25 μl Protein A/G beads. Three biological replicates were performed, and the pair of hippocampi from one mouse were pooled for each replicate.
RNA-seq.
Total RNA from WT littermate control and Ythdf1-KO mouse (8–16 weeks, male) hippocampus was extracted using Trizol (Invitrogen) and isopropanol precipitation. mRNA extraction was performed by poly(A)+ RNA selection once using Dynabeads™ mRNA DIRECT™ Purification Kit (Invitrogen). The RNA libraries were prepared using Truseq stranded mRNA sample preparation kit (Illumina) according to manufacturer’s protocol. Three biological replicates were performed for each genotype, and two hippocampi from one mouse were pooled for each replicate.
Electroconvulsive treatment (ECT) and m6A-RIP-seq of dentate gyrus (DG).
Adult male, 6~8-week old C57BL/6 mice were used (Charles River) and housed in a standard facility. Electroconvulsive treatment (ECT) was achieved with pulses consisted of 1.0 s, 100 Hz, 16–18 mA stimulus of 0.3 ms delivered using the Ugo Basile ECT unit (Model 57800) as previously described34. Mock mice were handled in parallel without the electrical current delivery.
m6A-RIP-seq.
Total RNA from adult mouse DG was isolated using the TRIzol reagent according to the manufacturer’s instructions (Invitrogen). mRNA purification was performed with poly(A)+ RNA selection twice using Dynabeads Oligo (dT)25 (Thermo Fisher; 61006). A total of 150 ng of mRNA was subjected to m6A-SMART-seq using anti-m6A rabbit polyclonal antibody (Synaptic Systems, 202003) as previously described9. Briefly, 5 μg of anti-m6A polyclonal antibody was conjugated to Dynabeads Protein A (Thermo Fisher; 10001D) and used for each affinity pull-down. The m6A RNA was eluted twice with 6.7 mM N6-Methyladenosine (Sigma-Aldrich; M2780) in 1 × IP buffer (10 mM Tris-HCl (pH 7.5), 150 mM NaCl, and 0.1% (vol/vol) Igepal CA-630) and recovered by RNA Clean and Concentrator-5 (Zymo Research). Libraries were generated using the SMART-seq protocol as described35. Three biological replicates for each condition were sequenced using Illumina NextSeq 550 from a single end for 75 bases.
Data analysis of high-throughput sequencing data.
General processing (for all sequencing samples unless specified).
Sequencing was carried out on NextSeq500 with single end 80-bp read length or NextSeq550 with single end 75-bp according to manufacturer’s instructions. Sequencing data were mapped to mouse genome version mm10 downloaded from UCSC using Tophat v2.0.1436. For RNA-seq analysis, RPKM were calculated by Cuffnorm37. For CLIP-seq experiments, after removing the adapter by Cutadapt38, the reads were aligned to the mouse genome (mm10) by Bowtie 239. More information could be found in Supplementary Table 1.
Peak calling in Ythdf1-CLIP-seq.
All mapped reads were treated as background and mutations were treated as signals for peak calling. PARalyzer40 was use for peak calling in CLIP-seq sample with a few modifications: (1) mutations in both “CLIP” and “Input” were removed from “CLIP”; (2) sites with 100% mutations rate were also removed. The remaining mutations were used for peak calling. At least two mutation sites are need in each peak (MINIMUM_CONVERSION_LOCATIONS_FOR_CLUSTER =2).
Peak calling in m6A-CLIP-seq.
We followed the same peak calling method as reported in ref 12. Consensus motif was determined using HOMER41 for the m6A-CLIP peaks identified in each replicate.
m6A-RIP-seq analysis.
Low-quality bases and adaptor sequences from original reads were removed using Trimmomatic42. The remaining reads were then mapped to the mouse genome (mm10) using STAR aligner43. Mapped reads between samples were normalized using DESeq244. The “Input” and “RIP” libraries were normalized respectively.
Integrative analysis.
(1) Definitions for groups of transcripts: (i) The common peaks (peaks from replicate 1 with > 1 nt overlap in peak location with those from both replicate 2 and 3) of CLIP-seq are defined as high-confidence CLIP peaks. (ii) Transcripts with high-confidence Ythdf1-CLIP peaks are defined as “Ythdf1-CLIP targets” (Fig. 4c, d, i; Extended Data Fig. 8i-j). (iii) Transcripts without Ythdf1-CLIP peaks in any of the three Ythdf1-CLIP-seq replicates are defined as “non-Ythdf1-CLIP targets”, and they were used as a control group for analyzing gene expression change in absence of Ythdf1 (Fig. 4d, i; Extended Data Fig. 8i-j). (iv) Transcripts with high-confidence m6A-CLIP peaks are defined as “m6A-modified transcripts” (Fig. 4d, i; Extended Data Fig. 8f, h, i-j). (v) Transcripts with overlapped high-confidence Ythdf1-CLIP peaks and high-confidence m6A-CLIP peaks (> 1 nt in peak location) are defined as “Ythdf1-CLIP + m6A-CLIP” transcripts (Fig. 4i; Extended Data Fig. 8i-j). (2) Functional annotation of a list of genes were generated by DAVID45,46, for Ythdf1-CLIP targets (Fig. 4c) and m6A-modified transcripts with no less than five mutations in m6A-CLIP-seq (Extended Data Fig. 8f). (3) Only genes with sufficient expression (rpkm > 1 in RNA-seq of WT triplicates; rpkm > 1 in m6A-RIP-seq input or RIP libraries respectively) were kept and subject to further analyses. The median rpkm value of the sequencing triplicates was used for differential analyses.
Antibodies.
The antibodies used in this study are listed below in the format of name (application; catalog; supplier; dilution fold): Rabbit anti-Ythdf1 (western blot, 17479–1-AP, Proteintech, 500–1,000; IF, 200). Rabbit anti-Ythdf2 (western blot, 24744–1-AP, Proteintech, 500). Rabbit anti-Ythdf3 (western blot, 25537–1-AP, Proteintech, 500). Rabbit anti-Ythdc1 (western blot, 14392–1-AP, Proteintech, 500). Rabbit anti-Ythdc2 (western blot, ab176846, Abcam, 1,000). Rabbit anti-Mettl3 (western blot, ab195352, Abcam, 1,000). Mouse anti-GAPDH (western blot, G8795, Sigma, 3,000). Rabbit anti-DCX (IF, ab18723, Abcam, 1,000). Mouse anti-Actin (western blot, A4700, Sigma, 1,000). Rabbit anti-GluR1 (western blot, AB1504, Merck, 1,000). Rabbit anti-CaMKII (western blot, 4436S, Cell Signaling, 1,000). Rabbit anti-Grin1 (western blot, 5704S, Cell Signaling, 1,000). Rabbit anti-Grin2a (western blot, 4205S, Cell Signaling, 1,000). Mouse anti-Bsn (western blot, ab82958, Abcam, 500). Goat anti-Mouse IgG HRP conjugated (western blot, AP308P, Merck, 5,000). Goat anti-Rabbit IgG HRP conjugated (western blot, AP307P, Merck, 5,000). Rat anti-Ctip2 (IF, ab18465, Abcam, 300). Mouse anti-Satb2 (IF, ab51502, Abcam, 300). Alexa Fluor 488 Goat anti-Mouse IgG (IF, A11029, ThermoFisher, 1,000). Cy™3 AffiniPure Donkey Anti-Rat IgG (H+L) (IF, 712–165-153, Jackson ImmunoResearch, 500). Cy™5 AffiniPure Donkey Anti-Mouse IgG (H+L) (IF, 715–175-150, Jackson ImmunoResearch, 500). Biotin-SP-conjugated Goat Anti-Rabbit IgG (IF, 111–065-003, Jackson ImmunoResearch, 500). Cy2-conjugated Streptavidin (IF, 016–220-084, Jackson ImmunoResearch, 1,000).
Supplementary Material
Extended Data
Extended Data Figure 1 |. Generation and evaluation of Ythdf1-KO mice.

a, Schematic diagram of the targeting strategy for generating Ythdf1-KO mice using CRISPR/Cas9. Two sgRNAs (red) were designed to target the 4th exon (E4) of Ythdf1. PAM sequence, underlined, green; F1 and R1, genotyping primers. b, Genotyping PCR products of the seven founders co-injected with 20 ng Cas9 mRNA and the two sgRNAs (5 ng each). c, Genotypes of sequenced mice. PCR products were cloned and sequenced. Founder #4 with a 179-bp deletion was crossed with C57BL/6 wild-type mice for further analysis. d, Representative genotyping PCR products of off-spring mice with different genotypes. e, Validation of Ythdf1 knockout by western blot using mouse hippocampal tissues. For gel source data, see Supplementary Figure 1. f, Representative images of Ythdf1 immunostaining in the mouse basal lateral amygdala (BLA) and the cortex.
Extended Data Figure 2 |. Ythdf1-KO mice are normal in hippocampal neurogenesis, cortical morphology, motor activities, anxiety-like behavior, and depressive-like behavior.

a, b, Representative images of Doublecortin (DCX, a marker of neurogenesis) immunostaining (a) and quantification of the number of DCX+ cells (b) in the dentate gyrus (DG) region of Ythdf1-KO and wild-type control mice at different postnatal development stages. Scale bar, 100 μm. c, Representative images of cortical morphology staining using Hoechst in adult control and Ythdf1-KO mice. Scale bar, 200 μm. d, Representative confocal immunostaining of Ctip2 (a marker for deep layer cortical neurons) and Satb2 (a marker for upper layer cortical neurons) in the cortex of adult control and Ythdf1-KO mice. Scale bar, 200 μm. e-h, Motor activities measured by various parameters as listed in the open-field test. i-l, Anxiety-like behavior measured by the light-dark box transition test (i, j) and the elevated-plus maze test (k, l). m, Depressive-like behavior measured by tail suspension test. P values, two tailed t-test. Numbers in bars, numbers of mice. Error bars, mean ± s.e.m.
Extended Data Figure 3 |. Morris water maze (MWM) tests and fear conditioning tests in Ythdf1-KO mice.

a, Schematics of procedure of MWM trainings and MWM probe tests. b, c, Number of crossings over previous platform location (b) and swimming velocity (c) of control and Ythdf1-KO mice in MWM probe tests. d, Schematics of the fear conditioning procedures (left) and freezing responses measured at different stages (right). e, Titration curves of the freezing level of wild-type mice 24 hours after trainings with different foot shock intensities. The conditioning protocols used in later experiments (moderate protocols) are indicated by arrows. f, Learning curves for auditory fear conditioning under moderate (left) or strong (right) training protocols. The training sessions were separated into two parts: baseline (base) and tone periods (tone). g, h, Auditory fear memory of control and Ythdf1-KO mice assessed 24 hours (g) and 2 hours (h) after the indicated trainings. P values, two-way repeated measures ANOVA (d) and two tailed t-test (b, c, f-h). Numbers in bars, numbers of mice. Error bars, mean ± s.e.m.
Extended Data Figure 4 |. Paired-pulse ratios (PPR), spine morphology, and total protein levels of various LTP-related genes in Ythdf1-KO mouse hippocampus, related to Figure 2.

a, b, PPR with different inter-stimulus intervals in CA1 neurons from wild-type control and Ythdf1-KO mice. c, d, Representative images of Lucifer Yellow staining (c) and statistical analyses of spine density (d, left) and spine size (d, right) in CA1 neurons from adult control and Ythdf1-KO brain. e, Uncropped western blot images for Fig. 2g. f, Total protein levels of a set of LTP-related genes in control and Ythdf1-KO mouse hippocampus. For gel source data, see Supplementary Figure 1. P values, two-way repeated measures ANOVA with post hoc two-tailed t-test (a) and two tailed t-test (b, d, f). Numbers in bars, numbers of slices (b), neurons/mice (d, left), spines (d, right), or mice (f). Error bars, mean ± s.e.m.
Extended Data Figure 5 |. Viral targeting in Ythdf1-KO mouse hippocampus and behavioral analyses of Ythdf1-KO mice injected with AAV virus, related to Figure 3.

a, Representative fluorescence images of brain slices from rostral to caudal positions dissected from a mouse injected with AAV-Ythdf1 virus. Hoechst, blue; Ythdf1 co-expressed with mCherry, red. b, Representative images of virus expression (mCherry, red) and Ythdf1 immunostaining (green) in the mouse hippocampus after AAV-control or AAV-Ythdf1 infection. Hoechst, blue. c, Ythdf1 protein overexpression level indicated by immunofluorescent signal intensity in the CA1 and DG regions. d, Number of crossings over the previous platform location for Ythdf1-KO mice injected with AAV-Ythdf1 or AAV-control in MWM probe tests. e, Anxiety-like behavior of the injected mice measured as open-arm durations in elevated-plus maze. f-h, Motor activities of the injected mice measured as total distance (f), number of moves (g), and average velocity (h) in the open-field test. P values, two tailed t-test (c-h). Numbers in bars, numbers of mice. Error bars, mean ± s.e.m.
Extended Data Figure 6 |. Impaired spatial learning and memory after selective knockdown of Ythdf1 in the hippocampus of WT mice.
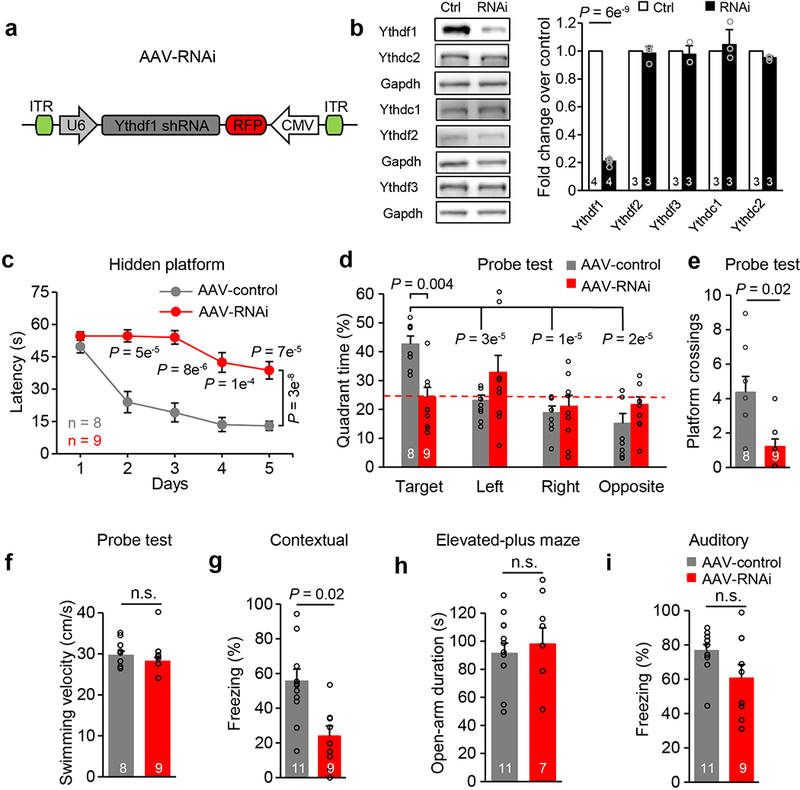
a, Schematics of the AAV construct expressing Ythdf1 shRNA. b, Western blot and quantification of protein expression level of YTH proteins in N2A cells after Ythdf1-shRNA (RNAi) or control vector (Ctrl) transfection. For gel source data, see Supplementary Figure 1. c, Spatial learning curves in the hidden-platform MWM training sessions for RNAi (red) and control (gray) mice. d-f, Spatial memory performances measured by quadrant time (%) (d) and number of platform crossings (e), and motor activities (f) of RNAi (red) and control (gray) mice in MWM probe tests. g, i, Contextual (g) and auditory (i) fear memories assessed 24 hours after fear conditioning in RNAi and control mice. h, Anxiety level of mice assessed by open-arm durations in elevated-plus maze. P values, two-way repeated measures ANOVA with post hoc two-tailed t-test (c), two-way ANOVA with two-tailed t-test (comparison between group or to “Target”) (d), and two tailed t-test (b, e-i). Numbers in bars, numbers of biologically independent samples (b) and mice (d-i). Error bars, mean ± s.e.m.
Extended Data Figure 7 |. Impaired spatial learning and memory after acute knockdown of Mettl3 in the hippocampus of WT mice.

a, Representative western blot (left) and quantification (right) of Mettl3 protein level in N2A cells transfected with Mettl3-shRNA (RNAi) or control vector (Ctrl). For gel source data, see Supplementary Figure 1. b-d, Spatial learning curves in the hidden-platform MWM training sessions (b), and spatial memory performances measured by quadrant time (%) (c) and the number of platform crossings (d) in MWM probe tests, for Mettl3-RNAi and control mice. e, Contextual (left) and auditory (right) fear memories measured by freezing levels 24 hours after fear conditioning in Mettl3-RNAi and control mice. f, Motor activities of mice accessed in the open-field test. P values, two-way repeated measures ANOVA with post hoc two-tailed t-test (b), two-way ANOVA with two-tailed t-test (comparison between groups or to “Target”) (c), and two tailed t-test (a, d-f), Numbers in bars, numbers of biologically independent samples (a) and mice (c-f). Error bars, mean ± s.e.m.
Extended Data Figure 8 |. Ythdf1 binding sites and m6A sites in the hippocampus of adult mice, and Ythdf1-mediated effects of m6A on hippocampal transcriptome and proteome.

a, Peak overlap among three biological replicates of Ythdf1-CLIP-seq. b, Validation of immunoprecipitation efficiency for Ythdf1-CLIP-seq. The position of the gel slice cut during the step of protein-RNA complex size selection was indicated in red (see Methods). c, Consensus motif and its P value generated by HOMER40 of the three sets of hippocampal m6A sites from biological replicates of m6A-CLIP-seq. d, e, Distribution of m6A-CLIP peaks along the different regions of transcripts (d) and genome (e). f, Functional annotation of m6A-modified transcripts in the adult mouse hippocampus (number of mutations in m6A-CLIP-seq >= 5, n = 2,922). g, Peak overlap between high-confidence Ythdf1-CLIP peaks and high-confidence m6A-CLIP peaks. The percentage of Ythdf1-CLIP peaks overlapped is indicated. h, IGV screenshots of the piled mutated reads for the each of the biological triplicates of Ythdf1-CLIP-seq (red) and m6A-CLIP-seq (blue). Three examples of synaptic plasticity transcripts were presented; the overlapped peak regions are highlighted in orange. i, j, Box-plots of mRNA abundance (i) and protein abundance (j) log2 fold changes (Δ) between Ythdf1-KO hippocampus and wild-type control for all expressed genes (black), non-Ythdf1-CLIP transcripts (gray), Ythdf1-CLIP targets (red), transcripts with overlapped Ythdf1-CLIP peaks and m6A-CLIP peaks (pink), and m6A-modified transcripts (blue). Box-plot elements: center line, median; box limits, upper and lower quartiles, whiskers, 1–99%; P values, two-sided unpaired Kolmogorov-Smirnov test; number of genes and 95% CI of mean are indicated for each box (i, j).
Extended Data Figure 9 |. Effects of Ythdf1 on nascent protein synthesis in cultured hippocampal neurons in response to KCl stimulus.

a, Additional representative images of nascent protein (Nascent-P) synthesis in cultured wild-type control and Ythdf1-KO hippocampal neurons before (sham) and 2 hours after KCl depolarization, related to Fig. 4e-f. b, c, Representative images (b) and quantification (c) of Nascent-P in wild-type control and Ythdf1-KO hippocampal neurons before (sham) and 4 hours after KCl depolarization. d, e, Representative images (d) and quantification (e) of Nascent-P in AAV-control and AAV-Ythdf1-RNAi treated hippocampal neurons before (sham), 2 hours, and 4 hours after KCl depolarization. Intensities of Nascent-P were normalized to that of wild-type control (c) or AAV-control (e) neurons under the sham condition. P values, two-tailed t-test (c, e). Numbers in bars, numbers of images/biologically independent samples. Error bars, mean ± s.e.m.
Extended Data Figure 10 |. Neuronal-stimulus-dependent functions of Ythdf1 in the mouse hippocampus and potential underlying mechanisms.

a, Representative western blot (left) and quantification (right) of the protein levels of Bsn (top) and Camk2a (bottom), in the whole hippocampus and the PSD fraction, respectively, before (Mock) and 2 hours after fear conditioning (FC). The protein quantification was normalized to the Mock condition for each genotype separately. For gel source data, see Supplementary Figure 1. b, c, Representative western blot (b) and quantification of Ythdf1 protein level in the hippocampal postsynaptic density (PSD) fraction (c, left) and the whole hippocampus (c, right) before (Mock) and 2 hours after FC. For gel source data, see Supplementary Figure 1. d, Schemes of the experimental design to quantify the change in the extent of m6A methylation for each transcript in the DG region before (Mock) and 1 hour after electroconvulsive treatment (ECT). e, A proposed mechanism for how Ythdf1 contributes to memory formation: Ythdf1 promotes translation of m6A-modified target transcripts, including synaptic transmission and LTP-related ones, in response to learning stimulus, thus facilitating synapse strength adequately for a memory to occur. P values, two-tailed t-test (a, c). Numbers in bars, numbers of biologically independent samples. Error bars, mean ± s.e.m.
Acknowledgements
This study was supported by the National Key R&D Program of China (2016YFA0500903 to X. Huang), the National Institute of Health (GM113194 and HG008935 to C.H.; NS097206 to H. Song, G-l.M. and C.H.; NS047344 to H. Song; NS097370 and MH 105128 to G-l.M.; DA043361 to X. Zhuang), the National Natural Science Foundation of China (31500866 to T.Z. and 31471077 to X.C.), and the Dr. Miriam and Sheldon G. Adelson Medical Research Foundation (AMRF) to G-l.M. C.H. is an investigator of the Howard Hughes Medical Institute. T.Z. is sponsored by Shanghai Rising-Star Program. X. Huang is sponsored by Startup Foundation of ShanghaiTech University. X. Zhang is sponsored by Zhejiang Public Welfare Technology Application Research Project (2018C37118). We thank Prof. X. Huang, Prof. B. Shen, Prof. P. Cao, and Dr. X. Wang for insightful discussion. We thank Prof. Z. Qiu and Dr. T. Cheng for help in primary neuron culture. We thank Ms. M. Wu for suggestions on proteomics data analyses. We thank Dr. J. Tauler, Mr. P. J. Hsu, and Mr. A. C. Zhu for editing help.
Footnotes
Data Availability
High-throughput sequencing data can be accessed under GSE106607. Source data for bar graphs and box-plots in main and extended data figures is provided as separate excel files.
References
- 1.Roundtree IA, Evans ME, Pan T & He C Dynamic RNA modifications in gene expression regulation. Cell 169, 1187–1200 (2017). [DOI] [PMC free article] [PubMed] [Google Scholar]
- 2.Wang X et al. N6-methyladenosine-dependent regulation of messenger RNA stability. Nature 505, 117–20 (2014). [DOI] [PMC free article] [PubMed] [Google Scholar]
- 3.Wang X et al. N6-methyladenosine modulates messenger RNA translation efficiency. Cell 161, 1388–1399 (2015). [DOI] [PMC free article] [PubMed] [Google Scholar]
- 4.Xiao W et al. Nuclear m6A reader YTHDC1 regulates mRNA splicing. Mol. Cell 61, 507–519 (2016). [DOI] [PubMed] [Google Scholar]
- 5.Roundtree IA et al. YTHDC1 mediates nuclear export of N6-methyladenosine methylated mRNAs. Elife 6, e31311 (2017). [DOI] [PMC free article] [PubMed] [Google Scholar]
- 6.Hess ME et al. The fat mass and obesity associated gene (Fto) regulates activity of the dopaminergic midbrain circuitry. Nat. Neurosci 16, 1042–1048 (2013). [DOI] [PubMed] [Google Scholar]
- 7.Lence T et al. m6A modulates neuronal functions and sex determination in Drosophila. Nature 540, 242–247 (2016). [DOI] [PubMed] [Google Scholar]
- 8.Li L et al. Fat mass and obesity-associated (FTO) protein regulates adult neurogenesis. Hum. Mol. Genet 26, 2398–2411 (2017). [DOI] [PMC free article] [PubMed] [Google Scholar]
- 9.Weng Y-L et al. Epitranscriptomic m6A regulation of axon regeneration in the adult mammalian nervous system. Neuron 97, 313–325.e6 (2018). [DOI] [PMC free article] [PubMed] [Google Scholar]
- 10.Widagdo XJ et al. Experience-dependent accumulation of N6-methyladenosine in the prefrontal cortex is associated with memory processes in mice. J. Neurosci 36, 6771–6777 (2016). [DOI] [PMC free article] [PubMed] [Google Scholar]
- 11.Walters BJ et al. The role of the RNA demethylase FTO (Fat Mass and Obesity-Associated) and mRNA methylation in hippocampal memory formation. Neuropsychopharmacology 42, 1502–1510 (2017). [DOI] [PMC free article] [PubMed] [Google Scholar]
- 12.Zhao BS et al. m6A-dependent maternal mRNA clearance facilitates zebrafish maternal-to-zygotic transition. Nature 542, 475–478 (2017). [DOI] [PMC free article] [PubMed] [Google Scholar]
- 13.Ivanova I et al. The RNA m6A reader YTHDF2 is essential for the post-transcriptional regulation of the maternal transcriptome and oocyte competence. Mol. Cell 67, 1059–1067 (2017). [DOI] [PMC free article] [PubMed] [Google Scholar]
- 14.Li H-B et al. m6A mRNA methylation controls T cell homeostasis by targeting the IL-7/STAT5/SOCS pathways. Nature 548, 338–342 (2017). [DOI] [PMC free article] [PubMed] [Google Scholar]
- 15.Ki-Jun Yoon, A. et al. Temporal control of mammalian cortical neurogenesis by m6A methylation. Cell 171, 887–889.e17 (2017). [DOI] [PMC free article] [PubMed] [Google Scholar]
- 16.Jia G et al. N6-methyladenosine in nuclear RNA is a major substrate of the obesity-associated FTO. Nat. Chem. Biol 7, 885–887 (2011). [DOI] [PMC free article] [PubMed] [Google Scholar]
- 17.Zheng G et al. ALKBH5 is a mammalian RNA demethylase that impacts RNA metabolism and mouse fertility. Mol. Cell 49, 18–29 (2013). [DOI] [PMC free article] [PubMed] [Google Scholar]
- 18.Dominissini D et al. Topology of the human and mouse m6A RNA methylomes revealed by m6A-seq. Nature 485, 201–206 (2012). [DOI] [PubMed] [Google Scholar]
- 19.Meyer KD et al. Comprehensive analysis of mRNA methylation reveals enrichment in 3′ UTRs and near stop codons. Cell 149, 1635–1646 (2012). [DOI] [PMC free article] [PubMed] [Google Scholar]
- 20.Slobodin B et al. Transcription impacts the efficiency of mRNA translation via co-transcriptional N6-adenosine methylation. Cell 169, 326–337.e12 (2017). [DOI] [PMC free article] [PubMed] [Google Scholar]
- 21.Sutton MA & Schuman EM Dendritic protein synthesis, synaptic plasticity, and memory. Cell 127, 49–58 (2006). [DOI] [PubMed] [Google Scholar]
- 22.Lein ES et al. Genome-wide atlas of gene expression in the adult mouse brain. Nature 445, 168–176 (2007). © 2004 Allen Insitute for Brain Science. Allen Mouse Brain Atlas. Available from: http://mouse.brain-map.org/ [DOI] [PubMed] [Google Scholar]
- 23.Shen B et al. Efficient genome modification by CRISPR-Cas9 nickase with minimal off-target effects. Nat. Methods 11, 399–402 (2014). [DOI] [PubMed] [Google Scholar]
- 24.Morris RGM, Garrud P, Rawlins JNP & O’Keefe J Place navigation impaired in rats with hippocampal lesions. Nature 297, 681–683 (1982). [DOI] [PubMed] [Google Scholar]
- 25.LeDoux JE Emotion circuits in the brain. Annu. Rev. Neurosci 23, 155–184 (2000). [DOI] [PubMed] [Google Scholar]
- 26.Liu J, Xu Y, Stoleru D & Salic A Imaging protein synthesis in cells and tissues with an alkyne analog of puromycin. Proc. Natl. Acad. Sci 109, 413–418 (2012). [DOI] [PMC free article] [PubMed] [Google Scholar]
- 27.Ma DK et al. Neuronal activity-induced Gadd45b promotes epigenetic DNA demethylation and adult neurogenesis. Science 323, 1074–1077 (2009). [DOI] [PMC free article] [PubMed] [Google Scholar]
- 28.Guo JU, Su Y, Zhong C, Ming GL & Song H Hydroxylation of 5-methylcytosine by TET1 promotes active DNA demethylation in the adult brain. Cell 145, 423–434 (2011). [DOI] [PMC free article] [PubMed] [Google Scholar]
- 29.Franklin K and Paxinos G The Mouse Brain in Stereotaxic Coordinates 2nd ed (Academic Press, San Diego, 2004). [Google Scholar]
- 30.Li Kun, et al. βCaMKII in lateral habenula mediates core symptoms of depression. Science 341, 1016–1020 (2013). [DOI] [PMC free article] [PubMed] [Google Scholar]
- 31.Huang W et al. mTORC2 controls actin polymerization required for consolidation of long-term memory. Nat. Neurosci 16, 441–448 (2013). [DOI] [PMC free article] [PubMed] [Google Scholar]
- 32.Chiu SL et al. GRASP1 regulates synaptic plasticity and learning through endosomal recycling of AMPA receptors. Neuron 93, 1405–1419.e8 (2017). [DOI] [PMC free article] [PubMed] [Google Scholar]
- 33.Shioda N et al. Aberrant calcium/calmodulin-dependent protein kinase II (CaMKII) activity is associated with abnormal dendritic spine morphology in the ATRX mutant mouse brain. J Neurosci 31, 346–358 (2011) [DOI] [PMC free article] [PubMed] [Google Scholar]
- 34.Su Y et al. Neuronal activity modifies the chromatin accessibility landscape in the adult brain. Nat. Neurosci. 20, 476–483 (2017). [DOI] [PMC free article] [PubMed] [Google Scholar]
- 35.Picelli S et al. Full-length RNA-seq from single cells using Smart-seq2. Nat. Protoc 9, 171–181 (2014). [DOI] [PubMed] [Google Scholar]
- 36.Kim D et al. TopHat2: accurate alignment of transcriptomes in the presence of insertions, deletions and gene fusions. Genome Biol. 14, R36 (2013). [DOI] [PMC free article] [PubMed] [Google Scholar]
- 37.Trapnell C et al. Transcript assembly and quantification by RNA-Seq reveals unannotated transcripts and isoform switching during cell differentiation. Nature Biotechnol. 28, 511–515 (2010). [DOI] [PMC free article] [PubMed] [Google Scholar]
- 38.Martin M Cutadapt removes adapter sequences from high-throughput sequencing reads. EMBnet.journal 17, 10–12 (2011). [Google Scholar]
- 39.Langmead B & Salzberg SL Fast gapped-read alignment with Bowtie 2. Nat. Methods 9, 357–359 (2012). [DOI] [PMC free article] [PubMed] [Google Scholar]
- 40.Corcoran DL et al. PARalyzer: definition of RNA binding sites from PAR-CLIP short-read sequence data. Genome Biol. 12, R79 (2011). [DOI] [PMC free article] [PubMed] [Google Scholar]
- 41.Heinz S et al. Simple combinations of lineage-determining transcription factors prime cis-regulatory elements required for macrophage and B cell identities. Mol. Cell 38, 576–589 (2010). [DOI] [PMC free article] [PubMed] [Google Scholar]
- 42.Bolger AM, Lohse M & Usadel B Trimmomatic: A flexible trimmer for Illumina sequence data. Bioinformatics 30, 2114–2120 (2014). [DOI] [PMC free article] [PubMed] [Google Scholar]
- 43.Dobin A et al. STAR: Ultrafast universal RNA-seq aligner. Bioinformatics 29, 15–21 (2013). [DOI] [PMC free article] [PubMed] [Google Scholar]
- 44.Love MI, Huber W & Anders S Moderated estimation of fold change and dispersion for RNA-seq data with DESeq2. Genome Biol. 15, (2014). [DOI] [PMC free article] [PubMed] [Google Scholar]
- 45.Huang DW, Lempicki R a & Sherman, B. T. Systematic and integrative analysis of large gene lists using DAVID bioinformatics resources. Nat. Protoc 4, 44–57 (2009). [DOI] [PubMed] [Google Scholar]
- 46.Huang DW, Sherman BT & Lempicki RA Bioinformatics enrichment tools: Paths toward the comprehensive functional analysis of large gene lists. Nucleic Acids Res. 37, 1–13 (2009). [DOI] [PMC free article] [PubMed] [Google Scholar]
Associated Data
This section collects any data citations, data availability statements, or supplementary materials included in this article.