Abstract
Smart gold nanoparticle-stabilized microbubbles (SAuMBs) composed of a gas-filled core and shell including smart gold nanoparticles (SAuNPs) which can be aggregated in tumors were applied as ultrasound-mediated cancer theranostics. The gas core in the microstructure enabled the detection of tumors using ultrasound and facilitated the delivery of SAuNPs by sonoporation. The SAuNPs spontaneously aggregated in tumors, which allowed photoacoustic (PA) monitoring and photothermal treatment (PTT) of tumors.
A table of contents entry
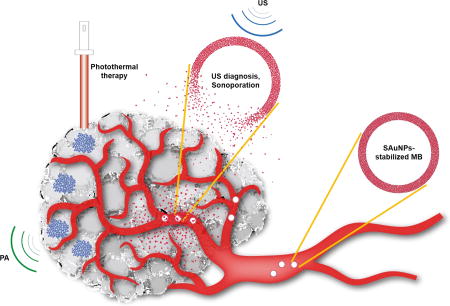
Smart gold nanoparticles-stabilized ultrasound microbubbles (SAuMBs) having diagnosis (US and PAT) and therapy (PTT) effects as cancer theranostics
Introduction
Image-guided delivery systems for cancer diagnosis and therapy have been the center of focus in various fields.[1–3] With continued development of ultrasound contrast agents (UCAs), ultrasound-mediated delivery systems that can detect cancers in real time are considered as one of the most effective treatment approaches.[4,5] To date, various UCAs comprised of gaseous cores and shells called microbubbles (MBs) have been developed which generally range from one to several micrometers in diameter.[6–8] It is well-established that cell membranes can be temporarily loosened by a synergistic phenomenon caused by ultrasound and MBs known as sonoporation, which is a simple, safe, and noninvasive approach for effective delivery of therapeutics and contrast agents to target tissues without harmful side effects.[9,10] Mitragotri et al. reported that shockwaves and liquid microjets induced by the sudden collapse of cavitation bubbles can penetrate into cells and tissues with surrounding contents.[11] This cavitation-based ultrasound therapy has been used for transdermal drug delivery, targeted drug delivery, clot lysis, and fracture healing.
The promising properties and well-known surface modification technologies of gold nanoparticles (AuNPs) have led numerous reports to demonstrate their great potential as cancer therapeutics.[12] Notably, research by Kim et al. on smart gold nanoparticles (SAuNPs) revealed that they can aggregate under acidic condition in cancers.[13,14] After the hydrolysis of ligands bound to their surface, the SAuNPs spontaneously aggregated by electrostatic interaction, causing a red shift in the absorption spectra. The aggregation of SAuNPs in cancers plays significant roles in monitoring and treating tumors using photoacoustic imaging (PAI) and photothermal therapy (PTT).[15]
NP-stabilized MBs contain a gas core, and the use of NPs instead of phospholipids and/or polymers for the preparation of MBs may present as a good alternative multimodal theranostic agent. Several researchers have developed NP-stabilized MBs composed of iron oxides (Fe3O4) or poly(butyl cyanoacrylate) NPs as a platform for ultrasound-mediated cancer treatment.[16,17] In the present study, SAuNP-stabilized MBs (SAuMBs) were prepared using pH-responsive SAuNPs and bovine serum albumin (BSA) to enhance their stability and multifunctional theranostic properties. These microstructures played a significant role as a UCA, and the SAuNPs in the microstructure shell were effectively delivered into tumor tissues and cells through sonoporation caused by interactions between ultrasound stimuli and the SAuMBs. The SAuNPs aggregated after uptake, and the tumors could consequently be detected by PAI and eliminated by PTT. Interestingly, the concentration of SAuNPs used for treatment was very low compared with that in previous studies, and these SAuMBs facilitated more effective delivery to tumor tissues and cells.
Results and discussion
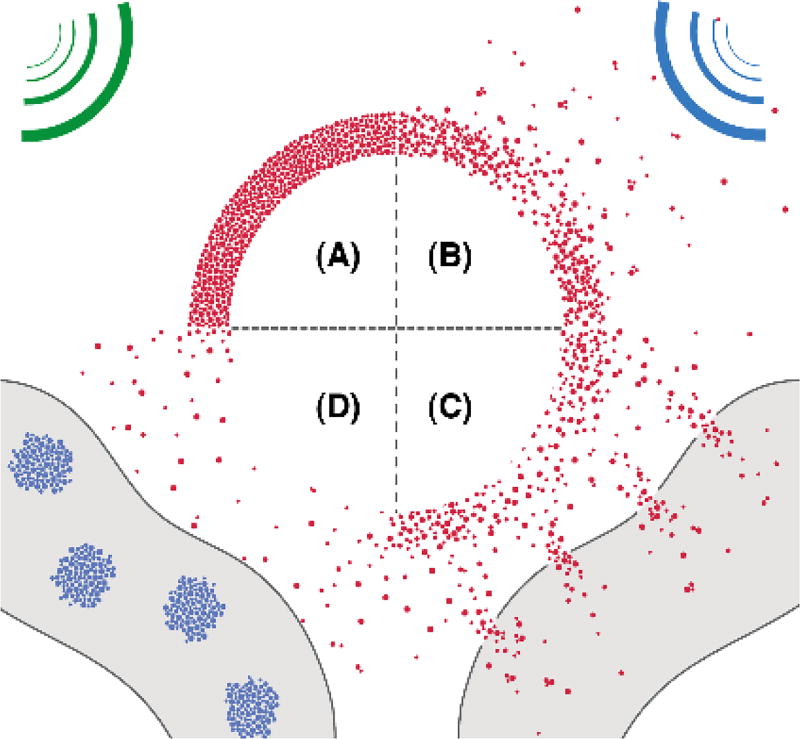
Generally, scheme 1 illustrated i) interaction between SAuMBs and US and ii) SAuNPs delivery process into cancer cells following US treatment. US wave (green) released from an US imaging device can detect SAuMBs near cancers owing to their strong impedance mismatch of more than 3000-fold compared with tissues or blood (Scheme 1A).[18] Above their resonance range, US stimulus (blue) can lead to sudden collapse of SAuMBs, and SAuNPs from SAuMBs are released (Scheme 1B). This disassembly of SAuMBs induces sonoporation phenomenon which can transiently loosen membrane of cancer cells near SAuMBs.[10] As a result, a number of SAuNPs are effectively delivered into the cells (Scheme 1C). The delivered SAuNPs into the cells can be aggregated because of pH-responsive ligands on SAuNPs (Scheme 1D). This aggregation behavior of SAuNPs enables PAI and PTT.
Scheme 1.
Process of SAuNPs release from SAuMBs and SAuNPs delivery into cancer cells following US treatment. (A) SAuMBs and US for diagnosis. (B) Collapse of SAuMBs after US stimulus. (C) Uptake process of SAuNPs into cancer cells (sonoporation). (D) Aggregation behavior of the delivered SAuNPs in the cells
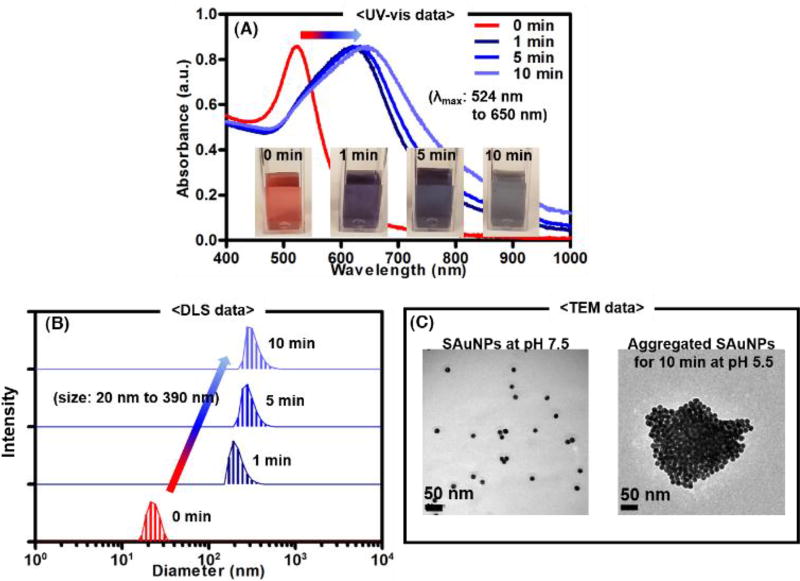
The SAuMBs were successfully prepared and thoroughly cross-checked. Briefly, 20 nm diameter AuNPs were converted to SAuNPs by reaction with reduced pH-responsive ligands, which had a negative charge. Under acidic conditions (e.g., as in tumor cells and tissue), SAuNP end groups were cleaved by hydrolysis, creating a positive charge. As a result, the SAuNPs with opposite charges spontaneously aggregated. Figure S1 illustrated a series of processes involved in SAuNP hydrolysis and aggregation under acidic conditions. UV-vis spectrometry, dynamic light scattering (DLS), and transmission electron microscopy (TEM) were used to analyze the aggregation behavior of SAuNPs at pH 5.5 (Figure 1). The color of the original SAuNP colloid changed from red to blue within 10 min, and the maximum wavelength (λmax) of the colloid increased from about 524 to 650 nm (Figure 1A). Under the same condition, SAuNP diameters were confirmed to have increased to around 390 nm by DLS and TEM (Figure 1B, C). To study the PTT effect of suspended and aggregated SAuNPs (0.25 nM) after laser irradiation (671 nm, 0.5 W cm−2), temperatures of the colloids were monitored for 5 min and showed ΔT of about 2 °C and 25°C, respectively (Figure S2A, B). These findings indicated that aggregated SAuNPs can effectively absorb laser light at 671 nm under tumor-like acidic conditions and have the potential to play a significant role in treating tumors.
Figure 1.
Aggregation behavior of smart ligand-bound gold nanoparticles (SAuNPs) at pH 5.5. To monitor spectral and color changes of SAuNP colloids, a UV-vis spectrometer was used (A). The λmax of SAuNP colloids shifted from 524 to 650 nm, and the colloid color changed from red to blue owing to aggregation of SAuNPs. Dynamic light scattering (DLS)(B) and transmission electron microscopy (TEM) (C) showed the size of SAuNPs gradually increased to about 390 nm. Aggregation of the SAuNPs was confirmed at pH 5.5.
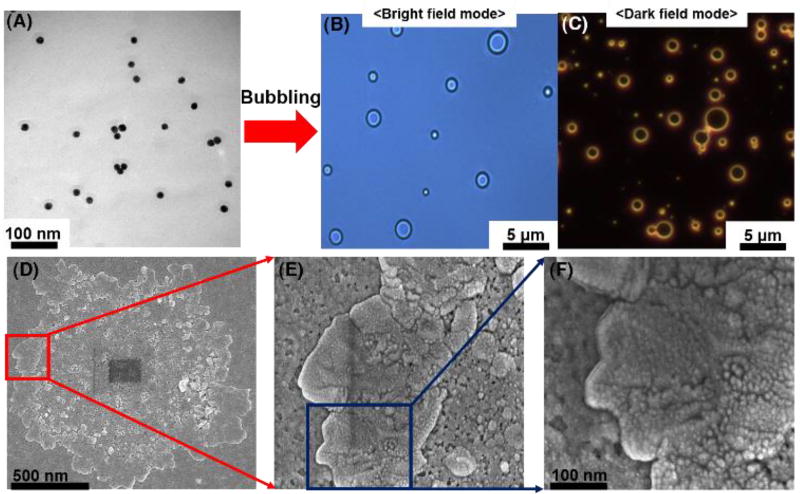
NP-stabilized MBs studies by Mørch et al. and Pourroy et al. indicate that energy barriers between NPs can be overcome by turbulent mixing and that a surfactant can stabilize air MBs.[16,17,19] Herein, BSA was used, which is known as a good surfactant to induce protein dimerization and hydrophobic interactions leading to the formation of a thin protein film at the air-liquid interface.[20] By turbulent mixing with BSA, SAuNPs in PBS were transformed into SAuMBs. Optical microscope results in bright and dark field mode showed the SAuMBs had a spherical morphology (Figure 2B) and membranes composed of SAuNPs (Figure 2C) as AuNPs can scatter light from narrowed lens regions. The average diameter of the SAuMBs was about 1 µm, and the number of SAuNPs per SAuMB layer was around 1.5 × 10⁴ (Figure S3A). For reference, it was confirmed that the number of SAuNPs before bubbling was 2.4 × 10¹² (the theoretically calculated value using UV-vis) [21] and the number of SAuMBs after bubbling was 1.6 × 10⁸ (the measured value from diluted samples using microscopy). SAuMB stability under various conditions (PBS, culture medium, and fetal bovine serum) was confirmed over a 24-h period. There was no significant difference among them (Figure S3B), and the SAuMBs showed good stability under all conditions tested for in vitro and in vivo studies. Scanning electron microscopy (SEM) results showed a shell thickness of about 250 nm for the SAuMB (Figure 2D–F), and most SAuNPs were present within the shell of the SAuMB, indicating the SAuMBs were prepared as intended. Furthermore, these results demonstrated that the MBs were successfully stabilized by the SAuNPs in the outer shell which could spontaneously aggregate under acidic conditions.
Figure 2.
Characterization of smart ligand-bound gold nanoparticle (SAuNP)-stabilized microbubbles (SAuMBs) after bubbling. Prepared SAuMBs were analyzed by microscopy and DLS. The microstructure and SAuNP shell of the SAuMBs were observed by microscopy in bright field (B) and dark field (C) modes. SEM results of SAuMBs after bubbling (D). High magnification images of the SAuMB shell (E, F) and SAuNPs within the shell (F). The shell was densely composed of a myriad of SAuNPs.
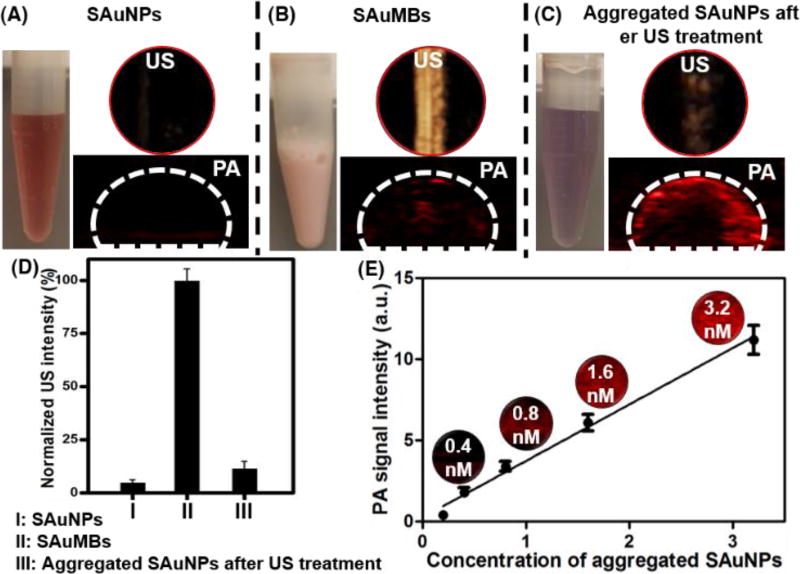
To investigate their UCA function, SAuNPs before and after microbubbling (SAuMB) were used. The SAuMBs demonstrated a strong US signal, whereas the SAuNPs did not. Because US released from the probe was reflected by the air contained within the SAuMBs, they had a powerful contrast effect (Figure 3A, B). Furthermore, the US signal of the SAuMBs decreased by 85% after US treatment demonstrating the induction of MB sonoporation (Figure 3C). These results indicated that our SAuMB preparation can function as an effective UCA and deliver SAuNPs into tumors. To examine whether SAuMBs function as a PA contrast agent, SAuMBs before and after US treatment under acidic conditions were used. While aggregated SAuNPs showed a meaningful PA signal (Figure 3C), SAuMBs did not (Figure 3B). The enhanced PA contrast effect of aggregated SAuNPs was related to their ability to effectively absorb at 671 nm, whereas intact SAuMBs cannot.
Figure 3.
Phantom study of SAuMBs after bubbling. Through US and PAT phantom studies, the heightened US contrast effect of SAuMBs was confirmed (B). SAuNPs alone did not show any ultrasound and PAT contrast effect (A). SAuNP aggregates showed a negligible ultrasound signal (C), indicating the collapse of SAuMBs under US treatment (1 MHz, 1 W cm−2, 50%, 2 min). (D) US intensity summary. (C) Aggregated SAuNPs after US treatment showed enhanced PAT contrast, while intact SAuMBs showed low PAT contrast. The concentration of the used samples was 1 nM based on the AuNP. Thus, SAuNPs were released from SAuMBs, aggregated under acidic conditions similar to cancer cells, and can be used as a PAT contrast agent. (E) Summary of aggregated SAuNP PAT signals at various concentrations (0.2–3.2 nM).
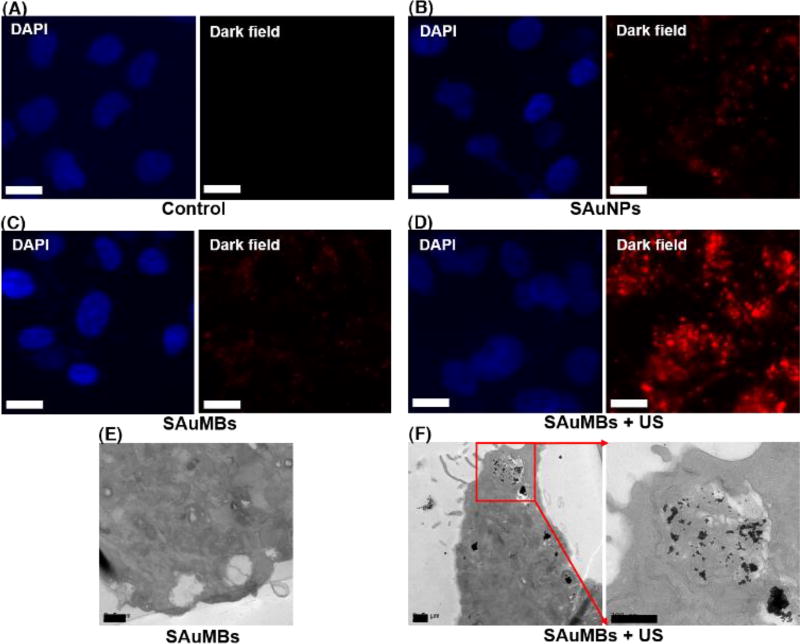
Through in vitro studies, the delivery of SAuNPs into cancer cells was confirmed by the SAuMBs and US treatment. Figure 4 showed the results of cancer cells treated with SAuNPs versus SAuMBs in dark field mode. Compared with the control group (Figure 4A), there were no meaningful signals in groups treated with only SAuNPs or SAuMBs (Figure 4B, C), but a discernible signal was detected in the group treated with SAuMBs accompanied by US treatment (Figure 4D). Sonoporation caused by SAuMBs subjected to US treatment facilitated passage of SAuNPs through the cancer cell membranes temporarily. Without US treatment, delivery was very limited. The delivery of SAuNPs into cells was verified by TEM; a considerable number of SAuNPs was present inside cells treated with SAuMBs and US (Figure 4F). Interestingly, the SAuNPs were aggregated, indicating the acidic condition inside the cancer cells induced their hydrolysis.[22] By contrast, the SAuNPs were barely detected in the group treated with only SAuMBs (Figure 4E).
Figure 4.
Cellular uptake of SAuNPs after US treatment. Microscopy was used to analyze SAuNPs in U-87 MG cells. Nuclei were stained with DAPI (blue), and SAuNPs within U-87 MGs were stained (red). Compared with the control (A), SAuNPs only (B), and SAuMBs only (C) treatment groups, SAuMB administration followed by US treatment (SAuMB+US) (D) has the highest fluorescence intensity. This resulted from release of SAuNPs from SAuMBs, sonoporation of cell membranes, and SAuNP uptake following US treatment. White scale bar: 5 µm. Additionaly uptake of SAuNPs was confirmed after US by TEM. Many aggregated SAuNPs were observed after SAuMB+US (F), whereas SAuNPs were merely shown after SAuMB treatment alone (E). Black scale bar: 500 nm.
To ascertain any PTT effect, cell viability assays were conducted. Results showed that cancer cells treated with a range of SAuMB concentrations (0.1–5 nM) over a 3-day period were not cytotoxic. Furthermore, no cytotoxicity was found in cells treated with SAuMBs and US. On the contrary, cell viability decreased to approximately 25% in cultures treated with SAuMBs, US, and laser irradiation at 671 nm for 5 min (Figure S4). This result indicated that aggregated SAuNPs within cells effectively absorbed the laser energy and in turn generated enough heat to kill the host cell. A staining kit including calcein-AM (live cells: green) and propidium iodide (dead cells: red) was used for double-checking this therapeutic effect. Confocal laser scanning microscopy (CLSM) confirmed this substantial therapeutic effect only when SAuMBs were subjected to US followed by laser irradiation treatment (Figure S5); fluorescence-activated cell sorting (FACs) showed similar results (Figure S6). Without laser irradiation, no valuable therapeutic effect was detected.
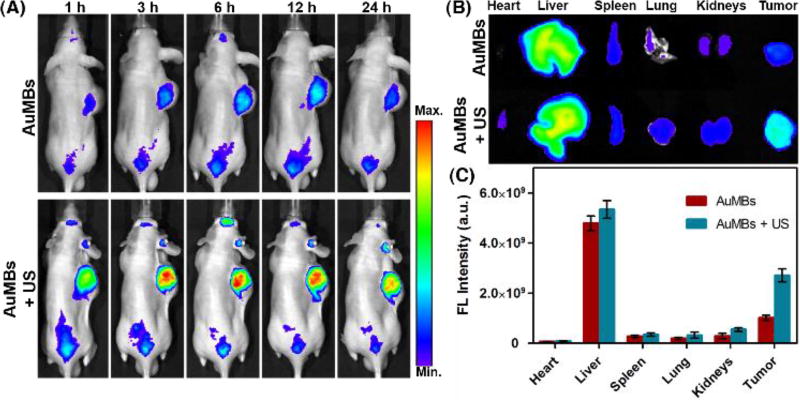
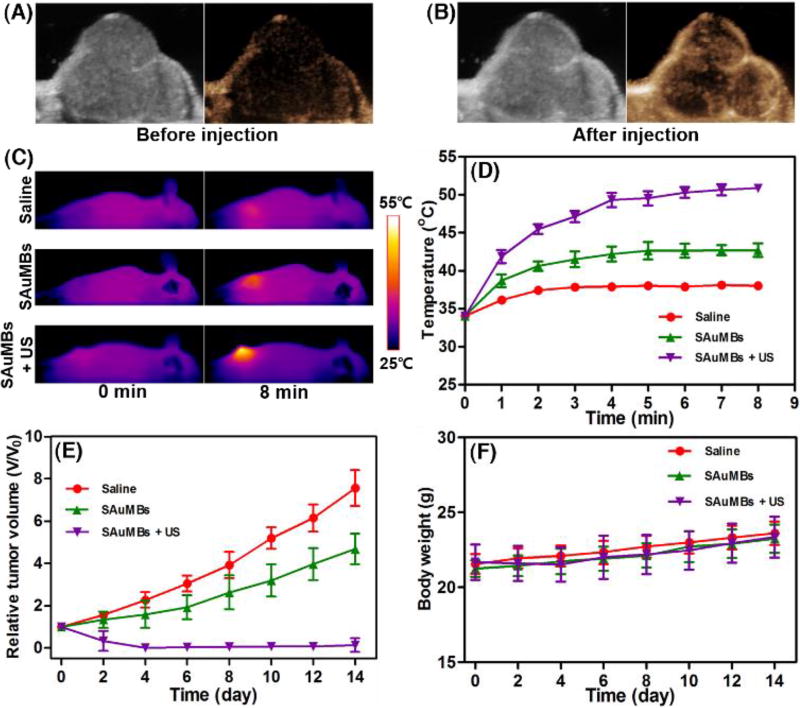
The biodistribution of SAuNPs and SAuMBs in vivo was assessed by fluorescence monitoring of U-87 MG xenograft mice for 24 h after injection of SAuMBs into the tail vein (Figure 5). SAuNP accumulation in mice was distinguished based on US treatment. Many SAuNPs were observed in tumors of mice which had been administered SAuMBs and had undergone US treatment (Figure 5A), and SAuNP-related fluorescence was maintained for at least 24 h. Tumors harvested from these mice also showed stronger fluorescence compared with mice administered SAuMBs without US. The majority of SAuNPs in mice were found in the liver, followed by tumors (Figure 5B). The application of US treatment more than doubled the fluorescence signal of tumors. Mouse tumors were also examined before and after SAuMBs injection to verify their enhanced US contrast effect. As shown in Figure 6A, B, tumors of mice injected with SAuMBs exhibited a clearly distinguished US signal that could be visualized within seconds.
Figure 5.
Biodistribution of SAuMBs. Tumor-bearing mice were visualized to check SAuMB biodistribution (N = 3). SAuMBs (150 µL, 10 nM) were injected into the tail vein, and US treatment was applied toward tumors for 5 min. Whole body scans were conducted for 24 h (A). After 24 h, each mouse was euthanized and the organs and tumors were harvested (B). (C) Summary of organ and tumor fluorescence. Tumors from mice treated with SAuMBs and US showed much greater fluorescence intensity versus those treated with SAuMBs only. It was confirmed that SAuMBs and US stimulus induced sonoporation phenomenon to enhance SAuNPs uptake into tumors.
Figure 6.
US diagnosis and PTT effects of SAuMBs in in vivo level. To ascertain possibility of the SAuMBs as an UCA, 150 µL of the SAuMBs were injected into the xenograft mouse models. Before (A) and after (B) injection, the tumor was scanned by using an US device. The tumor was detected in a moment, and an enhanced US contrast effect of the SAuMBs was confirmed. The tumor-bearing mice were monitored for 14 d after laser irradiation of tumors for 8 min (N = 3). Temperatures of all mice were scanned for 8 mi(C) and all tumor temperatures plotted (D). Temperature changes of tumors from mice treated with SAuMBs+US were above 15 °C within 5 min, whereas tumors from mice given saline or SAuMBs alone only showed slight temperature increases. While the relative tumor volume (V/Vo) of SAuMBs+US mice almost reached 0, that of the other two groups gradually increased (E). Use of SAuMBs+US+laser irradiation did not have a major influence on mouse body weight (F).
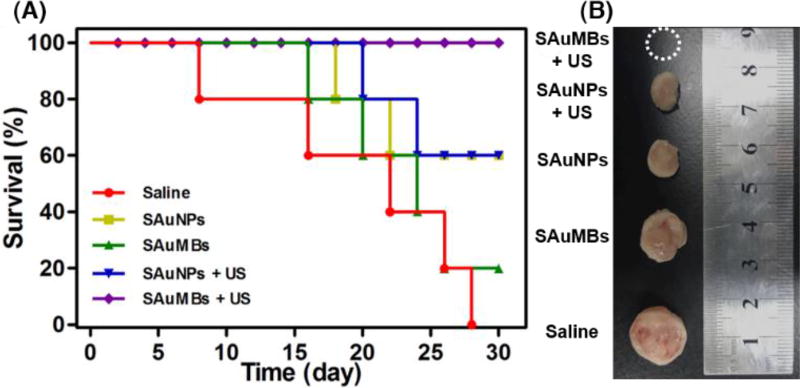
The PTT effect of SAuMBs on mouse tissues after US and laser irradiation was shown in Figure 6C–E. At 6 h postinjection and US treatment, mice were irradiated at 671 nm with a laser intensity of 0.5 W cm−2 for 8 min. With the exception of mice treated with SAuMBs and US, no significant change in temperature was observed (Figure 6C, D), and temperature increases were mainly found in tumors. The ΔT of mice treated with SAuMBs and US was approximately 25 °C, while the ΔT of mice treated with SAuMBs alone was only 8 °C. Relative tumor volume was monitored for 14 days after laser irradiation (Figure 6E), and tumors from mice treated with SAuMBs and US significantly diminished within 4 days and did not increase in size thereafter. On the contrary, the relative tumor volume of mice treated with saline or SAuMBs alone gradually grew. These results indicated the following: i) the injected SAuMBs were destroyed by US treatment, ii) the SAuNPs released from SAuMBs were delivered to tumor tissues and cells through sonoporation, iii) the acidic condition of the tumors caused SAuNP aggregation, and iv) SAuNP aggregates produced heat after laser irradiation, effectively eliminating the tumors. It should be noted that there was no substantial difference in body weight between the mouse treatment groups (Figure 6F). After 30 days, mice treated with SAuMBs and US survived, but the survival rate in those treated with SAuMBs alone was only 20% (Figure 7A). The harvested tumors were shown in Figure 7B. As expected, while the tumors in mice treated with SAuMBs and US were eliminated, the tumors of fairly large size were harvested from other four groups (saline, SAuMBs, SAuNPs, and SAuNPs+US).
Figure 7.
Mouse survival following treatment. Mice were treated with saline (control), SAuNPs alone, SAuMBs alone, SAuNPs+US, or SAuMBs+US then subjected to laser irradiation of tumors for 8 min (N = 5) and monitored for 30 d (A). Tumors were harvested to compare their sizes (B). All SAuMBs+US mice survived till the end the experiment, and no tumors were found. However, only 20% of SAuMBs only mice survived (mean tumor size: 1.3 cm), and SAuNP only mice showed 60% survival (mean tumor size: 1 cm). Interestingly, there was no substantial difference in survival between SAuNPs and SAuNPs+US groups because SAuNPs cannot induce sonoporation.
Conclusions
Herein, an efficient approach was proposed for the treatment of cancers with SAuNPs. The SAuMBs acted as theranostic agents and were successfully prepared by simple turbulent mixing. Tumors were readily detected by SAuMB administration and clinical ultrasound. Deconstruction of the SAuMBs by ultrasound stimuli released the SAuNPs located in their outer shell, enabling the selective transport of SAuNPs into cancer cells via sonoporation. The acidic environment of tumor tissues and cells induced the aggregation of the SAuNPs, offering a promising way for effectively monitoring and treating cancers via PAT and PTT, respectively.
Supplementary Material
Acknowledgments
This work was supported by a grant from the KRIBB Research Initiative Program (Korean Biomedical Scientist Fellowship Program), the Korea Research Institute of Bioscience and Biotechnology, Republic of Korea, and the Major State Basic Research Development Program of China (2017YFA0205201, 2014CB744503, and 2013CB733802), the National Natural Science Foundation of China (NSFC) (81422023, 81371596, 81571660, U1705281, and U1505221), and the Intramural Research Program, National Institute of Biomedical Imaging and Bioengineering, National Institutes of Health.
Footnotes
Electronic Supplementary Information (ESI) available: Synthetic procedures, experimental methods and characterization data for SAuNPs and SAuMBs. See DOI: 10.1039/x0xx00000
Conflicts of interest
There are no conflicts to declare.
References
- 1.Alicia F, Romila M, Anthony J. Appl. Biochem. Biotechnol. 2011;165:1628. [Google Scholar]
- 2.Lammers T, Kiessling F, Hennink W, Storm G. Mol. Pharm. 2010;7:1899. doi: 10.1021/mp100228v. [DOI] [PubMed] [Google Scholar]
- 3.Chen H, Hong H, Zhang Y, Valdovinos H, Shi S, Kwon G, Theuer C, Barnhart T, Cai W. ACS Nano. 2013;7:9027. doi: 10.1021/nn403617j. [DOI] [PMC free article] [PubMed] [Google Scholar]
- 4.Stride E, Saffari N. Proc. Inst. Mech. Eng. H. 2003;217:429. doi: 10.1243/09544110360729072. [DOI] [PubMed] [Google Scholar]
- 5.Lukáč R, Kauerová Z, Mašek J, Bartheldyová E, Kulich P, Koudelka Š, Korvasová Z, Plocková J, Papoušek F, Kolář F, Schmidt R, Turánek J. Langumuir. 2011;27:4829. doi: 10.1021/la104677b. [DOI] [PubMed] [Google Scholar]
- 6.Mehta K, Lee J, Taha A, Avgerinos E, Chaer R. J Vasc. Surg. 2017;66:266. doi: 10.1016/j.jvs.2016.12.133. [DOI] [PubMed] [Google Scholar]
- 7.Perera R, Hernandez C, Zhou H, Kota P, Burke A, Exner A. Wiley Interdiscip. Rev. Nanomed. Nanobiotechnol. 2015;7:593. doi: 10.1002/wnan.1326. [DOI] [PMC free article] [PubMed] [Google Scholar]
- 8.Martin K, Dayton P. Wiley Interdiscip. Rev. Nanomed. Nanobiotechnol. 2013;5:329. doi: 10.1002/wnan.1219. [DOI] [PMC free article] [PubMed] [Google Scholar]
- 9.Karshafian R, Bevan P, Williams R, Samac S, Burns P. Ultrasound Med. Biol. 2009;35:847. doi: 10.1016/j.ultrasmedbio.2008.10.013. [DOI] [PubMed] [Google Scholar]
- 10.Wu J, Pepe J, Rincon M. Ultrasonics. 2006;44:21. doi: 10.1016/j.ultras.2006.06.033. [DOI] [PubMed] [Google Scholar]
- 11.Mitragotri S. Nat. Rev. Drug Discov. 2005;4:255. doi: 10.1038/nrd1662. [DOI] [PubMed] [Google Scholar]
- 12.Yang Y, Ren L, Wang H. Ther. Deliv. 2017;8:879. doi: 10.4155/tde-2017-0049. [DOI] [PubMed] [Google Scholar]
- 13.Jung S, Nam J, Hwang S, Park J, Hur J, Im K, Park N, Kim S. Anal. Chem. 2013;85:7674. doi: 10.1021/ac401390m. [DOI] [PubMed] [Google Scholar]
- 14.Nam J, Won N, Jin H, Chung H, Kim S. J Am. Chem. Soc. 2009;131:13639. doi: 10.1021/ja902062j. [DOI] [PubMed] [Google Scholar]
- 15.Song J, Kim J, Hwang S, Jeon M, Jeong S, Kim C, Kim S. Chem. Commun. 2016;52:8287. doi: 10.1039/c6cc03100e. [DOI] [PubMed] [Google Scholar]
- 16.Mørch Ý, Hansen R, Berg S, Åslund A, Glomm W, Eggen S, Schmid R, Johnsen H, Kubowicz S, Snipstad S, Sulheim E, Hak S, Singh G, McDonagh B, Blom H, Stenstad P. Contrast Media Mol. Imaging. 2015;10:356. doi: 10.1002/cmmi.1639. [DOI] [PubMed] [Google Scholar]
- 17.Kovalenko A, Jouhannaud J, Polavarapu P, Krafft M, Waton G, Pourroy G. J Colloid Interface Sci. 2016;472:180. doi: 10.1016/j.jcis.2016.02.016. [DOI] [PubMed] [Google Scholar]
- 18.Persson H, Hertz C. Ultrasonics. 1985;23:83. doi: 10.1016/0041-624x(85)90037-x. [DOI] [PubMed] [Google Scholar]
- 19.Kovalenko A, Polavarapu P, Gallani J, Pourroy G, Waton G, Krafft M. ChemPhysChem. 2014;15:2440. doi: 10.1002/cphc.201402248. [DOI] [PubMed] [Google Scholar]
- 20.Eggen S, Fagerland S, Mørch Y, Hansen R, Søvik K, Berg S, Furu H, Bøhn A, Lilledahl M, Angelsen A, Angelsen B, Davies C. J Control. Release. 2014;187:39. doi: 10.1016/j.jconrel.2014.05.020. [DOI] [PubMed] [Google Scholar]
- 21.Haiss W, Thanh N, Aveyard J, Fernig D. Anal. Chem. 2007;79:4215. doi: 10.1021/ac0702084. [DOI] [PubMed] [Google Scholar]
- 22.Zhang X, Lin Y, Gillies R. J Nucl. Med. 2010;51:11670. doi: 10.2967/jnumed.109.068981. [DOI] [PMC free article] [PubMed] [Google Scholar]
Associated Data
This section collects any data citations, data availability statements, or supplementary materials included in this article.


