

Abstract
Background:
Multiple studies have concluded that calorie restriction for at least 12 weeks is associated with reduced food cravings, while others have shown that calorie restriction may increase food cravings. We addressed this ambiguity in a systematic review and meta-analysis.
Methods:
We searched for studies conducted on subjects with obesity, implemented calorie restriction for at least 12 weeks and measured food cravings pre-and post-intervention. Our final 8 studies mostly used the Food Craving Inventory. Other comparable methods were converted to a similar scale. We used the duration ≥ 12 weeks, but closest to 16 weeks for studies with multiple follow-ups and performed DerSimonian-Laird random-effects meta-analyses using the ‘metafor’ package in R software.
Results:
Despite heterogeneity across studies, we observed reductions in pooled effects for overall food cravings (−0.246[−0.490, −0.001]) as well as cravings for sweet (−0.410[−0.626, −0.194]), high-fat (−0.190[−0.343, −0.037]), starchy (−0.288[−0.517, −0.058]) and fast-food (−0.340[−0.633, −0.048]) in the meta-analysis. Baseline body weight, type of intervention, duration, sample-size and percentage of females explained the heterogeneity.
Conclusions:
Calorie restriction is associated with reduced food cravings supporting a de-conditioning model of craving reductions. Our findings should ease the minds of clinicians concerned about increased cravings in patients undergoing calorie restriction interventions.
Keywords: Food craving inventory, food cravings, calorie restriction, weight-loss
1. Introduction
Food cravings could be defined as frequent, intense and irresistible desires to consume a particular type of food 1. Food cravings differ from hunger by their specificity (i.e. the desire to consume only a particular type of food) and intensity (i.e. high level of desire to consume the food) 2. Several validated measures have been developed and used to quantify food cravings (e.g. Food Craving Inventory; FCI 1, Food Craving Questionnaire 3, and Control of Eating Questionnaire 4) as well as some study-specific questionnaires. Individuals with overweight and obesity have been shown to have higher levels of cravings for energy dense food, particularly for high fat food in individuals with type II diabetes mellitus 5. Moreover, in a cross sectional study, BMI was found to be weakly, yet positively associated with cravings for high fat food, sweet food, starchy food and fast food 6. Individuals who crave high fat food have been shown to have higher body mass indices compared to individuals who crave for starchy food 7. Furthermore, food cravings have been shown to mediate the association between increased body mass index and eating behavior that is characterized by some as addictive and also in people with eating disorders 8. Since increased food cravings typically result in an increase in consumption of food 6, increased food cravings are particularly relevant to obesity.
There are two main theories regarding the etiology of food cravings. One theory indicates that food cravings occur due to an individual being deprived of energy of energy, particular nutrients and / or specific types of food 9, 10. However, this theory has little empirical support. Another evidence-based theory indicates that food cravings primarily occur due to the development of associations between consumption of a specific type of food with a particular stimulus, environment or social context (e.g. special occasions). These theories suggest that food cravings are largely a conditioned response 11. In summary, while the majority of the literature appears to focus around these two theories (i.e. deficiency and conditioning), given the complexity of the phenomenon of food cravings, it is likely that the etiology of food cravings may be multi-determined.
Extended calorie restriction has been shown to be an efficient modality for achieving weight loss 12. Nevertheless, based on the deficiency (i.e. nutrient/energy) theory of food cravings 9, it has been hypothesized that deficiencies in energy intake, particularly during weight loss, could enhance cravings 13. The rebound weight gain observed following the conclusion of extended calorie restriction interventions in several studies is commonly cited in support of the deficiency hypothesis 14. Conversely, there is evidence to suggest that restriction of caloric consumption and reduced intake of craved items of food for periods extending for at least 12 weeks may suppress food cravings 15–17. However, there are also some studies that have concluded that extended calorie restriction does not have a significant effect on food cravings 18 and may even increase food cravings 19.
To address this ambiguity, we aimed to qualitatively synthesize and quantitatively examine the findings of the available literature that examined, using a pre-and post-intervention repeated-measures design, the effects of extended calorie restriction on overall and specific types of food cravings in a systematic review and meta-analysis. We hypothesized that intended restriction of energy intake by at least 500kcal/day for periods extending at least 12 weeks would significantly reduce cravings for energy dense food (e.g. sweet, high-fat and fast food) and overall food cravings compared to the pre-intervention state.
2. Methods
Search Strategy
All the procedures conducted in the study were approved by the Texas Tech University Human Research Protection Program (HRPP) and were conducted in accord with the PRISMA guidelines. PubMed, Scopus, PsychInfo and Web-of-Science electronic databases were searched from 12th of October, 2015 to 14th of October 2015 for scholarly work using specific key words and key word combinations (see Table 1). The key words and MeSH terms were formatted according to the syntax of each search engine, with the aim of identifying all studies that examined the effects of extended calorie restriction on food cravings. Only the work published after December, 1980 in English language were retrieved.
Table 1:
Keywords and keyword combinations used to screen the PubMed, Scopus, PsychInfo and Web-of-Science electronic databases
| Food AND |
| (crav* OR “Food craving inventory” OR FCI OR “Food craving questionnaire” OR FCQ OR “Food chocolate craving questionnaire” OR FCCQ OR “Orientation to chocolate Questionnaire” OR OCQ OR “Questionnaire on craving for sweet or Rich Foods” OR QCSRF) AND |
| (calori* OR energy exp OR diet OR “low calorie” OR “low carbohydrate” OR “low lycemic” OR “low fat” OR “weight loss” OR “loss of weight” OR “weight reduction” OR “reduction of weight”) |
Outcomes of the initial search conducted on the electronic databases were narrowed down by removing duplicates. Titles and available abstracts of the remaining records were screened for the presence of pre-defined exclusion criteria: 1) non-availability of full-text publications in English language; 2) text-books, book chapters and review papers; 3) non-human studies; 4) not being an interventional study; 5) not implementing a calorie restriction intervention at least in one study arm; 6) not quantitatively measuring food cravings before and after the intervention; 7) duration being < 2 weeks; 8) including children who were < 12 years of age; 9) including individuals with a BMI of < 30 kg/m2 ; and 10) including individuals diagnosed with eating disorders. Title and abstracts of both references and citations of the records that survived the described comprehensive screening process were screened to identify additional publications. Full-text manuscripts of the records that survived the initial screening process were examined for the exclusion criteria and for the quality of the methods. Particularly, studies that did not have at least one pure dietary calorie restriction intervention arm were excluded. Due to the fact that a typical calorie restriction intervention lasts for at least 12 weeks, the studies that were shorter than 12 weeks in duration were excluded in the final stage of screening. One author (CNK) reviewed all the publications to make the decisions regarding inclusion / exclusion based on the criteria. Ambiguous cases were discussed with the senior authors (JAD and MB) before final decisions were made.
Risk of Bias Assessment in Individual Studies
Individual studies that met the eligibility criteria were evaluated for the risk of bias using the methods in the Cochrane Handbook 20. Each study was evaluated for each of the following criteria: random sequence generation, allocation concealment, blinding of outcome assessments, completeness of outcome data and selective reporting.
Data Extraction and Cleaning
First, data were extracted from the papers that survived screening for eligibility into pre-defined data fields. When a study was comprised of multiple study arms, they were entered into the database as separate investigations, given that a dietary calorie restriction intervention of at least 12 weeks was implemented in each study arm. When food cravings were measured at multiple time points within a given study, the time point that was closest to 16 weeks, but was greater than 12 weeks was used as the post-intervention time point. The database was compared with original sources to ensure accuracy.
When required information was missing, potential sources of such information (e.g. supplementary tables and figures, protocol papers, dissertations, etc.) were identified and examined in order to extract such data. Corresponding authors of 3 publications were contacted to obtain additional information related to the published studies and useful de-identified summary statistics of the analyses that were not reported in the original manuscripts.
Missing post-vs. pre-intervention change score standard deviations that could not be calculated or obtained from the authors were imputed from the marginal standard deviations using the method from the Cochrane Handbook, conservatively assuming that pre-post correlations of 0.25 for all pre-post Likert measures 20. As most of the publications that survived the screening protocol used the FCI to measure overall food cravings and cravings for certain categories of food (e.g. sweet food, high-fat food, starchy food, fast-food and fruits and vegetables), studies that did not use FCI or an equivalent scale to measure food cravings were excluded from the meta-analysis. Overall and specific food cravings measured using alternative yet comparable scales to FCI and the respective standard deviations of the change scores were converted to a 1–5 scale.
Outcome Measures
Pooled effect-sizes for the post-vs. pre-intervention changes in overall food cravings and cravings for sweet food, high-fat food, starchy food, fast-food and fruits and vegetables as measured by the FCI or an equivalent scale (converted to a 5-point scale as described above) were examined in the meta-analyses and subsequent meta-regression analyses as the primary outcome variables.
Meta-analyses and Meta-regression Analyses
Multiple DerSimonian-Laird random-effects meta-analyses 21 were performed on the completed database using the ‘metafor’ package in R statistical software (version 3.2.5.) to examine whether pooled effect-sizes for the post-vs. pre-intervention changes in overall food cravings and cravings for sweet food, high-fat food, starchy food, fast-food and fruits and vegetables significantly differed from zero (i.e. no effect) 22. In an attempt to explain the heterogeneity of the outcomes, post-hoc exploratory meta-regression analyses were performed controlling for the 1) baseline body weight (individuals with a higher baseline body weight tend to have a higher energy deficit when a constant reduced calorie level is prescribed; including baseline body weight was included to account for this heterogeneity in energy deficits) ; 2) limited exposure to a certain category of food during the intervention (e.g. low-carbohydrate diets; low-fat diets) as compared to reduction of overall caloric intake via consumption of typical food (limiting exposure to a certain category of food is a potential source of heterogeneity in calorie restriction interventions); 3) sample size of each study arm (studies with higher sample sizes are likely to have narrower standard errors and 95% confidence intervals; including sample size as an explanatory variable accounts for this variability in standard errors); 4) percentage of female subjects (in calorie restriction interventions men and women differ based on their weight loss and loss of fat mass; they are also likely to show differential psychological and neurophysiological responses to calorie restriction); 5) percentage of individuals with type-II diabetes mellitus (individuals with type II diabetes mellitus are known to show differential neurophysiological responses to food cues compared to otherwise healthy individuals; this may be a potential source of heterogeneity in food craving-related outcomes); 6) duration of the intervention (durations of the included study arms ranged from 12 weeks to 56 weeks; this was considered as a potential source of heterogeneity); 7) change in body weight during the intervention (change in body weight was included as a surrogate of the energy deficit and the level of adherence to the interventions); and 8) mean age of the subjects (as variability of age could be a potential source of heterogeneity, age was included as a covariate). Multiple combinations of the above control variables were tested until at least 90% of the residual variance of the meta-analyses were explained by combinations of control variables.
3. Results
The outcomes of the initial database search and subsequent screening are summarized in a PRISMA flow-chart (see Figure 1). All of the included studies recruited adults with obesity, implemented dietary calorie restriction interventions and examined food cravings at the baseline and following at least 12 weeks of the intervention. However, the interventions were substantially heterogeneous. For instance, subjects in some study arms were instructed and provided resources to restrict their energy intake by a certain number of calories 23–25 or by a percentage of their estimated energy intake 18, while participants of other studies were given a specific type of a diet to follow (e.g. low-fat 17, 24, low-carbohydrate 17, 19, high carbohydrate and protein 19, vegetarian 24) in addition to restricting their overall energy intake. The energy deficit also varied from low-calorie diets 15–19, 23–25 to very-low calorie diets 15, 16. Females outnumbered males in all studies that reported the male: female ratio. Characteristics of the studies that survived the eligibility assessment protocol and were included in the meta-analysis are summarized in Table 2.
Figure 1:
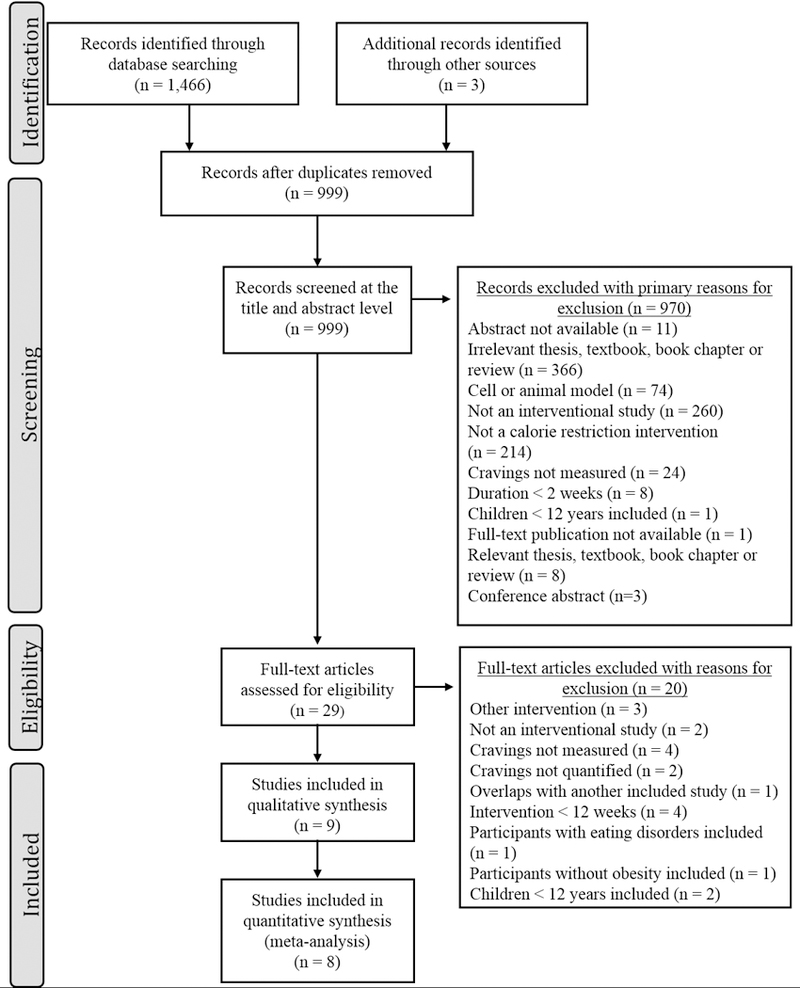
PRISMA flowchart of publication selection for the meta-analysis.
Table 2:
Characteristics of the nine studies and their study arms that survived the screening protocol.
| Group [n] | Participant Characteristics (baseline) | Dietary Intervention | Instructions Regarding Physical Activity | Measure of Food Cravings | Duration (Weeks) [completers] | Limited Intake Of Specific Type(s) of Food | ||||
|---|---|---|---|---|---|---|---|---|---|---|
| Age (Years) | F (%) | DM (%) | Weight (kg) | |||||||
| Anton et al. (2012) 23 | Overall [811] | 51.0±9.0 | 63.5 | 0 | 93.0±16.0 | Subjects were randomly assigned to one four diets: 1) LF (20% of energy) average protein (15% of energy); 2) LF high protein (25% of energy); 3) moderate fat (40% of energy) average protein; 4) moderate fat high protein. Each diet caused a 750 kcal/d deficit from baseline energy requirement. Craving data of all subjects were pooled and analyzed. | Not mentioned | FCI | 26 [645] ‡ | Yes |
| Barnard et al. (2009) 24 | LF Vegan [49] | 56.7±? | 55.1 | 100 | 97.0±22.9 | Avoid high-fat food; vegetarian (10% energy from fat; 15% from protein; 75% from carbohydrate). | Same level as baseline | FCI | 22 [47] * 74 [36] * |
Yes |
| ADA diet [50] | 54.6±? | 66.0 | 100 | 99.3±21.0 | 500–1000 kcal/d deficit as per ADA 2003 guidelines (15- 20% energy from protein; < 7% from saturated fat; 60- 70% from carbohydrate and monounsaturated fat). | Same level as baseline | FCI | 22 [44] * 74 [41] * |
Yes | |
| Batra et al. (2013) 40 | Behavior [94] | 49.1±10.1 | 73.0 | ? | 94.5±21.9 | Used portion-size controlled menus to reduce energy intake (26% protein; 26% fat; 48% low glycemic index carbohydrate) targeting a weight loss of 0.5–1 kg/week. | Not mentioned | FCI FCQ-T |
26 [74] * | No |
| Greenway et al. (2010) 25 | Control [581] | 43.7±11.1 | 85.0 | 0 | 99.5±14.3 | Subjects were instructed at 12- weekly intervals to maintain a 500 kcal/d deficit based on WHO algorithm for calculating resting metabolic rate. Adherence was not assessed. | Generally instructed to increase (non- specific; adherence was not assessed) | COEQ | 8 [511] † 56 [511] † |
No |
| Harvey et al. (1993) 15 | LCD [48] | 52.0±8.7 | 61.9 | 100 | 107.6±19.1 | 1000–1200 kcal/d self-selected balanced diet (≤ 30% energy from fat; 55–60% from carbohydrate; 10- 15% from protein as per ADA 1987 guidelines). | Not mentioned | Study Specific | 7 [42] * 13 [42] * |
No |
| VLCD [45] | 53.6±10.2 | 68.4 | 100 | 103.2±16.6 | 400–500 kcal/d diet comprised of lean meat, fish or foul and an occasional liquid protein meal supplement. | Not mentioned | Study Specific | 7 [38] * 13 [38] * |
Yes | |
| Jakubowicz et al. (2012) 19 | HCb [96] | 45.7±? | 59.4 | 0 | 91.2±9.8 | M: 1600 kcal/d; F: 1400 kcal/d by consumption of a 600 kcal high carbohydrate and high protein containing breakfast. Energy intake was monitored via self- completed check lists. | Same level as baseline | FCI | 16 [87] ‡ | No |
| LCb [97] | 46.5±? | 59.8 | 0 | 90.4±9.2 | M: 1600 kcal/d; F: 1400 kcal/d by consumption of a 300 kcal low Carbohydrate containing breakfast. Energy intake was monitored via self- completed check lists. | Same level as baseline | FCI | 16 [85] ‡ | Yes | |
| Martin et al. (2006) 16 | LCD [39] | 46.7±12.6 | 76.9 | ? | 96.5±22.5 | 1200 kcal/d comprised of self- selected typical food (50% energy from carbohydrate; 20% from protein; 30% from fat). | Not mentioned | FCI | 12 [19] * | No |
| VLCD [59] | 44.2±11.1 | 74.5 | ? | 123.1±25.6 | 800 kcal/d via consumption of 5 standard meal replacement shakes/d comprised of 80 g protein; 10g fat; 97 g carbohydrate). | Not mentioned | FCI | 6 [?] 12 [39] * |
Yes | |
| Martin et al. (2011) 17 | LC [153] | 45.8±9.3 | 68.4 | ? | 103.7±15.2 | Limiting carbohydrate intake to < 20 g per day by consuming low- glycemic index vegetables. | Not mentioned | FCI | 13 [134] † 26 [134] † |
Yes |
| LF [154] | 44.6±10.2 | 67.2 | ? | 103.4±14.4 | M: 1500 – 1800 kcal/d; F: 1200– 1500 kcal/d (30% energy from fat; 15% from protein; 55% from carbohydrate). | Not mentioned | FCI | 13 [136] † 26 [136] † |
Yes | |
n, sample size; ?, data not available;
, statistics used for the meta-analysis are from completers only analyses;
, statistics used for the meta-analysis are from intention-to-treat analyses where last observations of subjects who completed at least one post-intervention time point was carried forward (the number shown as completers is the number of subjects who completed at least one post-intervention time point);
, statistics used for the meta-analysis are from intention-to-treat analyses where the last observation was carried forward from the entire sample (the number shown as completers is the number of subjects who actually completed the respective time point); ADA, American Diabetes Association; COEQ, Control of Eating Questionnaire; DM, subjects with type – II diabetes mellitus; F, Females; FCI, Food Craving Inventory; FCQ-T; Food Craving Questionnaire – trait version; HCb, high carbohydrate and protein breakfast; LC, low carbohydrate; LCb, low carbohydrate breakfast; LCD, low calorie diet; LF, low fat; VLCD, very-low calorie diet.
The outcomes of the risk of bias assessment of the studies that met eligibility and were included in the meta-analysis are summarized in Table 3. Given that the current meta-analysis aimed to examine the post-vs. pre-intervention changes in food cravings within eligible study groups (rather than comparing with a control group), the influences of biases associated with random sequence generation; allocation concealment; blinding of participants; and blinding of outcome assessments on the pooled outcomes were minimal. Completers-only analysis of food cravings was a potential risk of bias in four studies.
Table 3:
Summary of risk of bias assessment of the studies included in the qualitative synthesis
| Random sequence generation (selection bias) |
Allocation concealment (selection bias) |
Blinding of outcome
assessments (detection bias) |
Incomplete outcome data (attrition bias) |
Selective reporting (reporting bias) |
|
|---|---|---|---|---|---|
| Anton et al. (2012) 23 | ? | + | + | + | + |
| Barnard et al. (2009) 24 | + | + | + | + | + |
| Batra et al. (2013) 40 | − | + | + | − | + |
| Greenway et al. (2010) 25 | + | + | + | + | + |
| Harvey et al. (1993) 15 | ? | ? | + | − | + |
| Jakubowicz et al. (2012) 19 | ? | ? | + | + | + |
| Martin et al. (2006) 16 | − | − | + | − | + |
| Martin et al. (2011) 17 | + | + | + | + | + |
, low risk of bias;
, high risk of bias; ?, unclear risk of bias
Six out of the nine studies that survived the screening protocol used the FCI to measure food cravings. In the FCI, subjects rated the frequency of development of food cravings to items of food categorized under six subscales on a 1–5 Likert scale: Overall food cravings; cravings for sweet food, high-fat food; starchy food; fast-food; fruits and vegetables. One study 15 used a study specific questionnaire that examined the frequency of development of cravings for different categories of food on separate 1–5 Likert scales. Two subscales of the questionnaire used in the study represented cravings for high-fat food and starchy food. Given that the FCI also used 1–5 Likert scales to measure food cravings, the means and standard deviations of change in cravings in the above two categories during the calorie restriction interventions implemented in the study were used in the meta-analysis. Another study 25 used the Control of Eating Questionnaire, which measured the frequency of development of cravings for food with categories that were equivalent to cravings for sweet food, starchy food, fast-food and fruits and vegetables on separate 0–100 mm visual analogue scales. Means and standard deviations of changes in food cravings for the above categories of food during the calorie restriction intervention in the study were therefore converted to a 1–5 scale that was comparable with the FCI using the following formula: 5-point scale = 1 + (0–100 mm scale / 25). The remaining study 18 had to be excluded from the meta-analysis due to the inability to convert the measurements of food cravings into scales comparable to the 1–5 Likert scale used in the FCI to measure frequency of development of cravings for sweet food, high-fat food, starchy food, fast-food, fruits and vegetables and overall food cravings. The final cleaned database created from the 8 studies included changes in overall food cravings (10 study arms) and changes in cravings for sweet food (11 study arms), high-fat food (23 study arms), starchy food (13 study arms), fast-food (11 study arms) and fruits and vegetables (4 study arms).
Most studies and study arms that examined the effects of dietary calorie restriction on overall food cravings found a significant reduction compared to the baseline (Figure 2a). Accordingly, the meta-analysis also revealed a significant reduction of overall food cravings compared to the baseline (−0.246 [−0.490, −0.001]). A similar reduction of cravings for sweet food (Figure 2b; −0.410 [−0.626, −0.194]), high-fat food (Figure 2c; −0.190 [−0.343, −0.037]), starchy food (Figure 2d; −0.288 [−0.517, −0.058]) and fast-food (Figure 2e; −0.340 [−0.633, −0.048]) were seen in the meta-analysis. Cravings for fruits and vegetables did not significantly differ from zero in the meta-analysis conducted using the outcomes of 4 study arms (Figure 2f; −0.038 [−0.350, 0.274]). Funnel plots created for overall food cravings and cravings for specific types of food (Figure 3a-f) indicated that the study arms were heterogeneous. This was substantiated further by very high Higgins’ I2 statistics associated with all forms of food cravings (Figure 2a-f) 26. However, on subsequent meta-regression analyses, combinations of pre-determined modifier variables completely (i.e. 100%) explained the residual variance in the meta-analyses conducted for overall food cravings and cravings for sweet food, starchy food, fast-food and fruits and vegetables (Table 4). Modifier variables accounted for 96.5% of the residual variance in the meta-analysis conducted for cravings for high-fat food.
Figure 2:
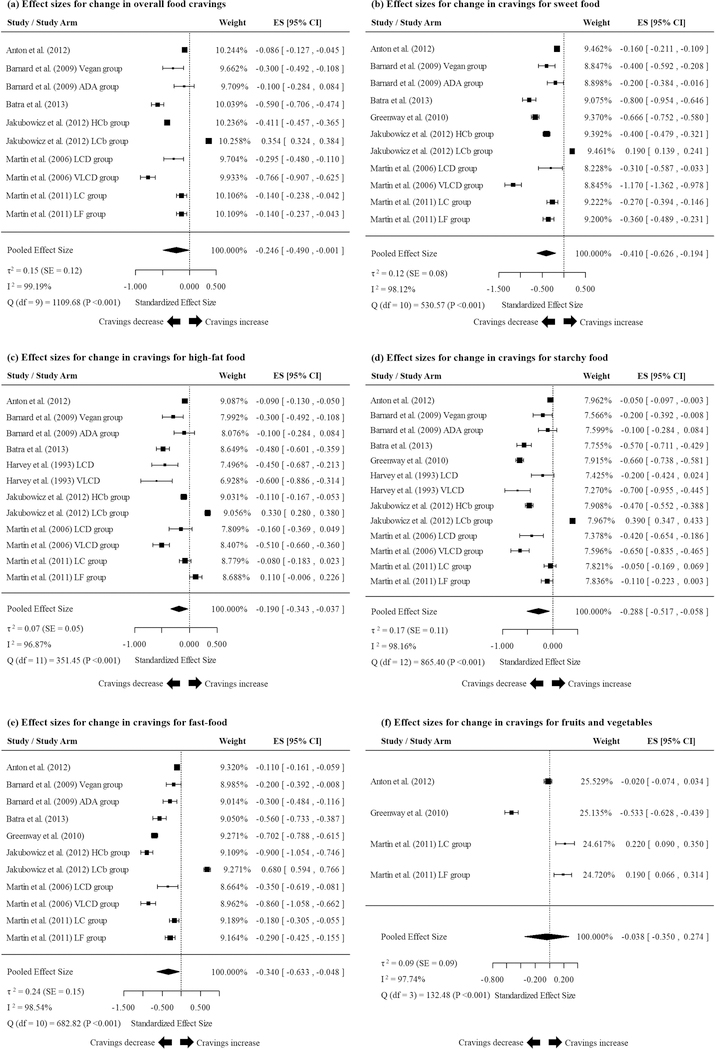
Results of the meta-analyses examining the pooled changes in (a) overall food cravings; (b) cravings for sweet food; (c) cravings for high-fat food; (d) cravings for starchy food; (e) cravings for fast-food (e); and (f) cravings for fruits and vegetables during extended calorie restriction interventions.
Figure 3:
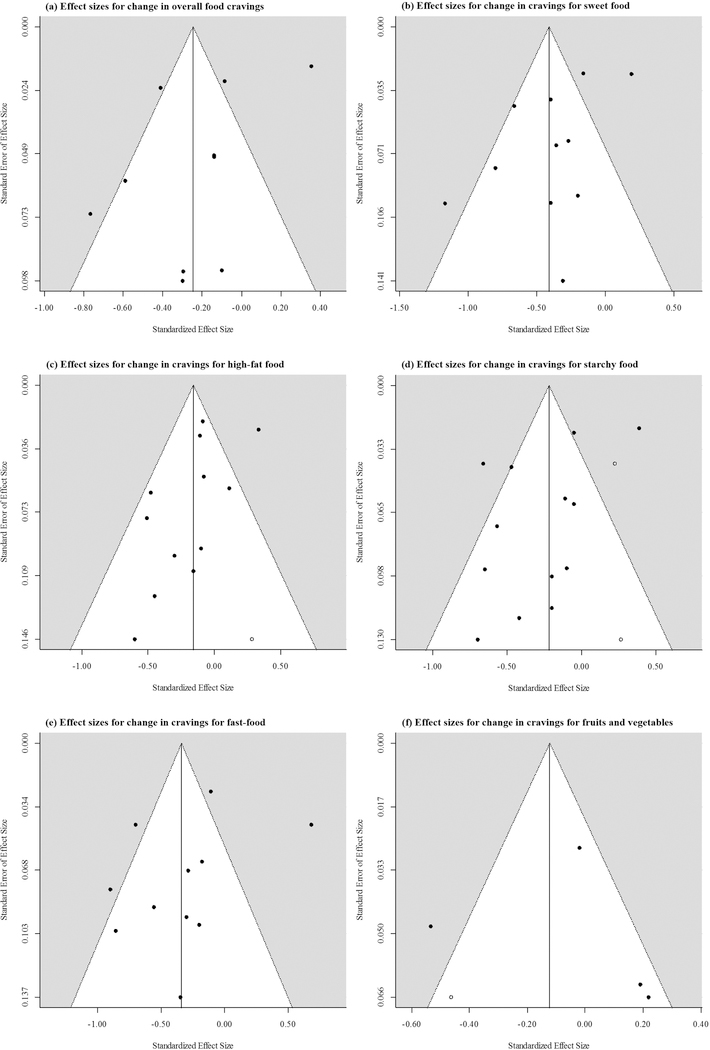
Funnel plots indicating the relationship between the effect-sizes and standard errors of effect sizes of individual studies included in the meta-analyses examining the pooled changes in (a) overall food cravings; (b) cravings for sweet food; (c) cravings for high-fat food; (d) cravings for starchy food; (e) cravings for fast-food (e); and (f) cravings for fruits and vegetables during extended calorie restriction interventions. Colored data points indicate effect sizes of observed studies. White data points indicate the effect sizes of potentially missing studies as determined by the trim-and-fill method.
Table 4:
Results of the best-fitting models in the meta-regression analyses.
| (a) Change in effect sizes of overall food cravings | ||||
|---|---|---|---|---|
| Modifier | Estimate | SE | Z | P |
| Intercept | 2.621 | 0.180 | 14.668 | 1.035 × 10−48 |
| Baseline weight (kg) | −0.043 | 0.003 | −15.605 | 6.757 × 10−55 |
| LI | 0.707 | 0.026 | 27.381 | 4.675 × 10−165 |
| Sample size | −0.001 | <0.001 | −13.979 | 2.091 × 10−44 |
| Female (%) | 0.016 | 0.004 | 3.654 | 2.585 × 10−04 |
| I2 = 0.00%; R2 = 100%; τ2 = 0.00 | ||||
| (b) Change in effect sizes of for sweet food | ||||
| Modifier | Estimate | SE | Z | P |
| Intercept | 3.151 | 0.227 | 12.873 | 9.286 × 10−44 |
| Baseline weight (kg) | −0.050 | 0.003 | −15.229 | 2.277 × 10−52 |
| LI | 0.564 | 0.043 | 13.141 | 1.910 × 10−39 |
| Sample Size | −0.001 | <0.001 | −5.653 | 1.577 × 10−08 |
| Female (%) | 0.019 | 0.004 | 4.939 | 7.866 × 10−07 |
| Duration (weeks) | −0.004 | 0.003 | −1.723 | 8.494 × 10−02 |
| I2 = 0.00%; R2 = 100%; τ2 = 0.00 | ||||
| (c) Change in effect sizes of high-fat food | ||||
| Modifier | Estimate | SE | Z | P |
| Intercept | 3.016 | 0.356 | 8.474 | 2.377 × 10⁻¹⁷ |
| Baseline weight (kg) | −0.029 | 0.003 | −9.381 | 6.556 × 10⁻²¹ |
| LI | 0.3918 | 0.053 | 7.361 | 1.825 × 10⁻¹³ |
| Duration (weeks) | −0.030 | 0.005 | −5.629 | 1.811 × 10−08 |
| Weight change (kg) | −0.003 | 0.006 | −0.506 | 6.128 × 10−01 |
| I2 = 39.02%; R2 = 96.51%; τ2 = 0.0021 | ||||
| (d) Change in effect sizes of starchy food | ||||
| Modifier | Estimate | SE | Z | P |
| Intercept | 2.362 | 0.272 | 8.698 | 3.388 × 10⁻¹⁸ |
| Baseline weight (kg) | −0.036 | 0.003 | −12.962 | 1.998 × 10−38 |
| LI | 0.786 | 0.040 | 19.764 | 6.043 × 10−87 |
| Sample size | −0.001 | <0.001 | −6.783 | 1.178 × 10⁻¹¹ |
| Female (%) | 0.007 | 0.003 | 2.560 | 1.048 × 10−02 |
| Weight change (kg) | −0.009 | 0.004 | −1.977 | 4.800 × 10−02 |
| I2 = 0.00%; R2 = 100%; τ2 = 0.00 | ||||
| (e) Change in effect sizes of fast-food | ||||
| Modifier | Estimate | SE | Z | P |
| Intercept | −9.286 | 1.296 | −7.163 | 7.889 × 10⁻¹³ |
| Baseline weight (kg) | 0.094 | 0.014 | 6.893 | 5.470 × 10⁻¹² |
| LI | 1.638 | 0.098 | 16.758 | 4.937 × 10−63 |
| Sample size | −0.001 | <0.001 | −14.652 | 1.313 × 10−48 |
| Subjects with DM (%) | −0.020 | 0.002 | −11.116 | 1.043 × 10⁻²⁸ |
| I2 = 0.00%; R2 = 100%; τ2 = 0.00 | ||||
| (f) Change in effect sizes of fast-food | ||||
| Modifier | Estimate | SE | Z | P |
| Intercept | 0.426 | 0.048 | 8.851 | 8.701 × 10⁻¹⁹ |
| Duration (weeks) | −0.017 | 0.002 | −11.505 | 1.240 × 10⁻³⁰ |
| I2 = 0.00%; R2 = 100%; τ2 = 0.00 | ||||
DM, diabetes mellitus; LI, limited intake of specific type(s) of food; SE, standard error.
Visual examination of the funnel plots did not reveal evidence of publication bias (Figure 3a-f). However, exploration of the models using the trim-and-fill method 27, 28 revealed the possibility of missingness of one study with an effect size of 0.28 [−0.01, 0.57] for change in cravings for high-fat food (Figure 3c); two studies with effect sizes of 0.23 [0.15, 0.30] and 0.27 [0.01, 0.52] for change in cravings for starchy food (Figure 4d); and one study with an effect size of −0.46 [−0.59, −0.33] for cravings for fruits and vegetables (Figure 3f). Meta-analyses conducted after including these estimated effect sizes of potentially missing studies revealed that pooled effects for changes in cravings for high-fat food and starchy food were still significantly lower than zero (−0.16 [−0.31, −0.01] and −0.22 [−0.42, −0.01]). Inclusion of the estimated effect-size of a potentially missing study examining changes in cravings for fruits and vegetables did not result in a significant difference from zero (−0.12 [−0.40, 0.16]). Trim-and-fill test did not reveal evidence of publication bias in relation to change in overall food cravings or cravings for sweet food and fast-food.
4. Discussion
Our meta-analysis indicated that calorie restriction for periods extending at least 12 weeks is associated with reductions in measures of overall food cravings and cravings for sweet food, high-fat food, starchy food and fast-food, with the interventions invariably causing an energy deficit. Therefore, our findings do not support the notion that food cravings occur due to a deficiency of energy or nutrients 9. Specifically, if the deficit theory were to hold true, one would expect to see increased craving resulting from extended caloric restriction.
Our results do however support the alternate explanation that craving develops as a result of a conditioned association between repeated consumption of a specific type of food with a particular stimulus, environment, or an occasion (i.e. classical conditioning) 11. According to this theoretical perspective, subsequent exposure to the conditioned stimulus is thought to trigger food cravings. Thus, uncoupling the association between the consumption of the craved item of food and the stimulus would lead to suppression of overall food cravings. Dietary calorie restriction interventions largely limit the consumption of energy dense food, while maintaining exposure to the stimuli, environments and occasions that were previously associated with consumption of specific types of food. Dissociation of consumption of food and associated stimuli could be a mechanism through which extended calorie restriction results in reductions of overall food cravings and cravings for energy dense food. However, it should be noted that a food craving is likely a complex bio-psycho-social phenomenon that cannot be fully explained using a simple psychological model alone. Therefore, while our findings suggest that classical conditioning may be playing an important role in the development of food cravings, we note that the current focus of the literature is somewhat narrow and emphasize the need to examine other potential etiological and mechanistic influences (e.g. neurophysiological) to better understand this complex phenomenon.
While evidence regarding the effects of extended calorie restriction on neurophysiological mechanisms that regulate human ingestive behavior is limited 29, there are some parallels that can be drawn. Neuroimaging studies conducted for varied purposes that were able to indirectly examine this question indicate that extended calorie restriction may suppress food-cue reactivity of brain regions that regulate food reward 30–32 and are by extension, often thought to be a neurophysiological surrogate for “craving”. Similarly, regions that are often thought to “suppress food cravings” show enhanced food-cue reactivity indicating increased executive inhibitory control over drives towards ingestion 30 (i.e. craving suppression). This enhancement of executive inhibitory control with a concurrent suppression of food reward provides a biological rationale for the behavioral outcomes we have compiled in the present meta-analysis. While this is currently an evidence-based theoretical proposition, direct evidence from studies specifically designed to test this theory could further substantiate this conjecture.
In the meta-regression analyses many explanatory variables were negatively associated with change in post-vs. pre-intervention food cravings, indicating that as each explanatory variable increased numerically, a greater reduction of cravings could be expected (Table 4). First, the meta-regression models predicted that as the baseline weight increased, a greater reduction in overall food cravings and cravings for sweet food, high-fat food and starchy food could be expected. Thus, the models suggest that extended calorie restriction may be more effective in suppressing food cravings in individuals with higher body weights. However, the association between initial body weight and change in cravings for fast-food indicated that cravings for fast-food seem to decrease to a lesser extent in individuals with a higher baseline body weight during a calorie restriction intervention. This unexpected finding needs further exploration. Second, the meta-regression models suggested that as the duration of intervention increased, the reduction in cravings for sweet food, high-fat food and fruits and vegetables was greater. As increased intervention durations could lead to the dissociation of consumption of craved food and associated stimuli to a greater extent, this finding further substantiates the theory that food cravings may be a conditioned response. Furthermore, this finding suggests that increasing the duration of a calorie restriction intervention may be an effective strategy for suppressing food cravings in individuals with obesity. Third, limited exposure to a particular type of food (e.g. low-fat diet, low-carbohydrate diet) was found to be decreasing the magnitude of reduction in overall and all specific forms of cravings, except for cravings for fruits and vegetables. Thus, limiting intake of a specific category of food during calorie restriction intervention may be counterproductive in reducing food cravings. When a calorie restriction intervention aims to decrease the overall calorie consumption via reduction of intake of a specific category of food, it is likely to increase exposure to other categories of food. However, if the calorie restriction intervention does not target a specific category of food, it is more likely to reduce exposure to all categories of food. This greater reduction of exposure to food stimuli may explain the fact that interventions that did not aim to reduce consumption of a specific category of food were more successful in suppressing food cravings. This too is consistent with the classical conditioning theory of food cravings. Fourth, as the percentage of females in a study increased, the magnitude of reduction in overall food cravings and cravings for sweet food and starchy food decreased. Thus, extended calorie restriction appears to be less effective in females in reducing overall food cravings and cravings for sweet and starchy food. While this phenomenon needs further exploration in a well-controlled prospective clinical trial, our preliminary finding suggests the need to augment calorie restriction interventions prescribed to women with obesity with other forms of behavioral and psychological interventions(e.g. targeted cognitive behavioral interventions) to enhance craving management. While there was some heterogeneity in specific subgroups (e.g. women), overall, we did not observe a significant association between the change in body weight and the change in any form of food cravings. Thus, weight loss per se and possibly the associated reductions in adipose tissue appear not to be associated with the reductions of food cravings seen in extended calorie restriction interventions. Taken together, our meta-regression analyses indicated that having a higher baseline body weight, engaging in a longer calorie restriction intervention, not limiting exposure to specific categories of food and male gender but not weight loss per se are associated with achieving a greater reduction in food cravings during extended calorie restriction interventions.
Our findings address a common concern among clinicians who manage obesity; specifically, the worry that prescribing calorie restriction interventions could increase food cravings, thus reducing adherence to the prescribed regimes and increasing the risk of weight cycling 14, 33, 34. Our meta-analysis establishes empirically that prescribed calorie restriction interventions are associated with suppression of overall food cravings and cravings for specific categories of food such as sweet food, high fat food, starchy food and , suggesting that these concerns are likely unfounded. Furthermore, our findings indicate that increased food cravings does not appear to be a mechanism leading to the high failure rates observed in calorie restriction interventions targeting weight loss and weight loss maintenance.
While our meta-analysis answered the question whether extended calorie restriction suppresses food cravings in individuals with obesity, several questions regarding the effects of extended calorie restriction and food cravings remain unanswered. First, there is some evidence to suggest that extended calorie restriction is also associated with a reduction in hunger 35, 36, while other interventional studies have shown that calorie restriction may have no effect on hunger 37. In this meta-analysis we only examined the effects of calorie restriction on food cravings, which differs from hunger by definition. While, it has been observed in clinical settings that individuals with food cravings tend to misunderstand food cravings as hunger and as such tend to give in to food cravings 2, future systematic reviews and meta-analyses should be aimed at examining the effects of extended calorie restriction on self-reported hunger. Third, we do not have a clear understanding of the effects of extended calorie restriction on the ability of an individual to resist food cravings as compared to giving in to food cravings. There is limited evidence to suggest that extended calorie restriction may be associated with a decreased frequency of giving in to food cravings 18. Few other studies have demonstrated that extended calorie restriction appear to increase dietary restraint in individual with obesity 24, 38. Thus, future studies should examine the effects of extended calorie restriction on the proportion of instances where cravings are resisted by individuals who develop cravings. Furthermore, effects of extended calorie restriction on dietary restraint need to be elucidated.
The literature that was evaluated in the present systematic review and meta-analysis had some limitations. First the included studies were heterogeneous in the types of dietary interventions, subject characteristics and durations. Despite this heterogeneity, the effect-size estimates of most studies and the pooled effect sizes clearly indicated reductions in food cravings along with calorie restriction interventions. Second, the scales used to measure food cravings were heterogeneous. However, we were able to convert several scales into a common 5-point scale to pool their outcomes in the meta-analysis. Third, food cravings was a secondary or a minor outcome in most of the studies. Fourth, data regarding actual energy intake during the intervention periods were not available in almost all studies. Thus, the results of the meta-analysis only indicated the outcomes of prescription of calorie restriction interventions. Fifth, sample characteristics of the studies that met the eligibility criteria (e.g. body weight, percentage of females) were restricted, limiting the ranges of the control variables included in the meta-regression models, thus limiting the generalizability of the outcomes of the meta-regression models. Moreover, several studies did not report the change scores of food cravings and the standard deviations of change scores. Partly due to the limitations in the literature that was reviewed, the meta-analysis also had some limitations. The effect sizes were not necessarily independent as some of the effect sizes were derived from studies and study arms conducted by the same groups of investigators. We also did not have access to individual level data. Finally, even though food cravings are not limited to individuals with obesity 1, 2, 39, given that our systematic review and meta-analysis focused on the effects of calorie restriction on food cravings in a specific clinical population (i.e. individuals with obesity), our findings cannot be generalized to other populations (e.g. individuals without obesity).
The meta-analysis had several strengths. First, we used a systematic search strategy, which was sensitive in the initial stages and specific in the later scrutinizing stages. Second, when the data were not available, we obtained these missing data from the authors of original manuscripts and imputed missing data using a well-established and conservative approach. Finally, we performed a random-effects rather than a fixed effects meta-analysis, thus we avoided the invalid assumption that the heterogeneous group of studies we analyzed had equal effect sizes and variances of effect sizes.
In conclusion, in this systematic review and meta-analysis, we found support for the previous, yet debated, finding of some studies that extended calorie restriction is associated with suppression of overall food cravings and cravings for energy dense foods. This finding should ease the minds of clinicians who are concerned about increasing food cravings in patients who are prescribed dietary calorie restriction interventions.
Acknowledgments
The authors wish to thank the corresponding authors who provided us with the requested missing data and Dr. Keely Hawkins for helping to obtain access to missing data. C. Martin’s institution and his work is supported by: 1) grant U54 GM104940 from the National Institute of General Medical Sciences of the National Institutes of Health, which funds the Louisiana Clinical and Translational Science Center, and 2) NORC Center Grant P30 DK072476 entitled “Nutrition and Metabolic Health Through the Lifespan” sponsored by NIDDK.
No direct support was received related to the preparation of this manuscript. The Pennington Biomedical Research Center (PBRC) / Louisiana State University owns the Food Craving Inventory (FCI), which is one of the instruments used to assess food cravings in some of the studies reviewed in this meta-analysis. The co-author from PBRC (CKM) is not an inventor nor does he receive royalties from use of the FCI.
List of Abbreviations (in the order of occurrence)
- ADA
American Diabetes Association
- COEQ
Control of Eating Questionnaire
- DM
subjects diagnosed with diabetes mellitus
- F
Females
- FCI
Food Craving Inventory
- FCQ
T Food Craving Questionnaire – trait version
- HCb
high carbohydrate and protein breakfast
- LC
low carbohydrate
- LCb
low carbohydrate breakfast
- LCD
low calorie diet
- LF
low fat
- LI
limited intake of specific type(s) of food
- SE
standard error
- VLCD
very-low calorie diet
Footnotes
Conflicts of Interest
The authors do not have any other conflicts of interest to declare.
References
- 1.White MA, Whisenhunt BL, Williamson DA, Greenway FL, Netemeyer RG. Development and validation of the food-craving inventory. Obes Res 2002; 10: 107–14. [DOI] [PubMed] [Google Scholar]
- 2.Martin CK, McClernon FJ, Chellino A, Correa JB. Food cravings: A central construct in food intake behavior, weight loss, and the neurobiology of appetitive behavior. Handbook of Behavior, Food and Nutrition Springer; 2011; 741–55. [Google Scholar]
- 3.Moreno S, Rodríguez S, Fernandez MC, Tamez J, Cepeda-Benito A. Clinical validation of the trait and state versions of the Food Craving Questionnaire. Assessment 2008; 15: 375–87. [DOI] [PubMed] [Google Scholar]
- 4.Dalton M, Finlayson G, Hill A, Blundell J. Preliminary validation and principal components analysis of the Control of Eating Questionnaire (CoEQ) for the experience of food craving. Eur J Clin Nutr 2015. [DOI] [PubMed]
- 5.Delahanty LM, Meigs JB, Hayden D, Williamson DA, Nathan DM, Group DPPDR. Psychological and behavioral correlates of baseline BMI in the diabetes prevention program (DPP). Diabetes Care 2002; 25: 1992–8. [DOI] [PMC free article] [PubMed] [Google Scholar]
- 6.Chao A, Grilo CM, White MA, Sinha R. Food cravings, food intake, and weight status in a community-based sample. Eat Behav 2014; 15: 478–82. [DOI] [PMC free article] [PubMed] [Google Scholar]
- 7.White MA, Grilo CM. Psychometric properties of the Food Craving Inventory among obese patients with binge eating disorder. Eat Behav 2005; 6: 239–45. [DOI] [PubMed] [Google Scholar]
- 8.Joyner MA, Gearhardt AN, White MA. Food craving as a mediator between addictive-like eating and problematic eating outcomes. Eat Behav 2015; 19: 98–101. [DOI] [PMC free article] [PubMed] [Google Scholar]
- 9.Weingarten HP, Elston D. The phenomenology of food cravings. Appetite 1990; 15: 231–46. [DOI] [PubMed] [Google Scholar]
- 10.Polivy J, Coleman J, Herman CP. The effect of deprivation on food cravings and eating behavior in restrained and unrestrained eaters. Int J Eat Disord 2005; 38: 301–9. [DOI] [PubMed] [Google Scholar]
- 11.Gibson EL, Desmond E. Chocolate craving and hunger state: implications for the acquisition and expression of appetite and food choice. Appetite 1999; 32: 219–40. [DOI] [PubMed] [Google Scholar]
- 12.Finer N Low‐Calorie Diets and Sustained Weight Loss. Obesity Research 2001; 9: 290S–94S. [DOI] [PubMed] [Google Scholar]
- 13.Chaput JP, Lord C, Aubertin-Leheudre M, Dionne IJ, Khalil A, Tremblay A. Is overweight/obesity associated with short sleep duration in older women? Aging Clin Exp Res 2007; 19: 290–4. [DOI] [PubMed] [Google Scholar]
- 14.Wing RR, Phelan S. Long-term weight loss maintenance. The American journal of clinical nutrition 2005; 82: 222S–25S. [DOI] [PubMed] [Google Scholar]
- 15.Harvey J, Wing RR, Mullen M. Effects on food cravings of a very low calorie diet or a balanced, low calorie diet. Appetite 1993; 21: 105–15. [DOI] [PubMed] [Google Scholar]
- 16.Martin CK, O’Neil PM, Pawlow L. Changes in Food Cravings during Low‐Calorie and Very‐Low‐Calorie Diets. Obesity 2006; 14: 115–21. [DOI] [PubMed] [Google Scholar]
- 17.Martin CK, Rosenbaum D, Han H, Geiselman PJ, Wyatt HR, Hill JO, et al. Change in food cravings, food preferences, and appetite during a low-carbohydrate and low-fat diet. Obesity (Silver Spring) 2011; 19: 1963–70. [DOI] [PMC free article] [PubMed] [Google Scholar]
- 18.Gilhooly CH, Das SK, Golden JK, McCrory MA, Dallal GE, Saltzman E, et al. Food cravings and energy regulation: the characteristics of craved foods and their relationship with eating behaviors and weight change during 6 months of dietary energy restriction. Int J Obes (Lond) 2007; 31: 1849–58. [DOI] [PubMed] [Google Scholar]
- 19.Jakubowicz D, Froy O, Wainstein J, Boaz M. Meal timing and composition influence ghrelin levels, appetite scores and weight loss maintenance in overweight and obese adults. Steroids 2012; 77: 323–31. [DOI] [PubMed] [Google Scholar]
- 20.Higgins JP, Green S. Cochrane handbook for systematic reviews of interventions: Wiley Online Library; 2008. [Google Scholar]
- 21.DerSimonian R, Laird N. Meta-analysis in clinical trials. Controlled clinical trials 1986; 7: 177–88. [DOI] [PubMed] [Google Scholar]
- 22.Viechtbauer W Conducting meta-analyses in R with the metafor package. J Stat Softw 2010; 36: 1–48. [Google Scholar]
- 23.Anton SD, Gallagher J, Carey VJ, Laranjo N, Cheng J, Champagne CM, et al. Diet type and changes in food cravings following weight loss: findings from the POUNDS LOST Trial. Eat Weight Disord 2012; 17: e101–8. [DOI] [PMC free article] [PubMed] [Google Scholar]
- 24.Barnard ND, Gloede L, Cohen J, Jenkins DJ, Turner-McGrievy G, Green AA, et al. A low-fat vegan diet elicits greater macronutrient changes, but is comparable in adherence and acceptability, compared with a more conventional diabetes diet among individuals with type 2 diabetes. J Am Diet Assoc 2009; 109: 263–72. [DOI] [PMC free article] [PubMed] [Google Scholar]
- 25.Greenway FL, Fujioka K, Plodkowski RA, Mudaliar S, Guttadauria M, Erickson J, et al. Effect of naltrexone plus bupropion on weight loss in overweight and obese adults (COR-I): a multicentre, randomised, double-blind, placebo-controlled, phase 3 trial. The Lancet 2010; 376: 595–605. [DOI] [PubMed] [Google Scholar]
- 26.Higgins J, Thompson SG. Quantifying heterogeneity in a meta‐analysis. Statistics in medicine 2002; 21: 1539–58. [DOI] [PubMed] [Google Scholar]
- 27.Duval S, Tweedie R. A nonparametric “trim and fill” method of accounting for publication bias in meta-analysis. Journal of the American Statistical Association 2000; 95: 89–98. [Google Scholar]
- 28.Duval S, Tweedie R. Trim and fill: A simple funnel-plot-based method of testing and adjusting for publication bias in meta-analysis. Biometrics 2000; 56: 455–63. [DOI] [PubMed] [Google Scholar]
- 29.Kahathuduwa CN, Boyd LA, Davis T, O’Boyle M, Binks M. Brain regions involved in ingestive behavior and related psychological constructs in people undergoing calorie restriction. Appetite 2016; 107: 348–61. [DOI] [PubMed] [Google Scholar]
- 30.Rosenbaum M, Sy M, Pavlovich K, Leibel RL, Hirsch J. Leptin reverses weight loss-induced changes in regional neural activity responses to visual food stimuli. J Clin Invest 2008; 118: 2583–91. [DOI] [PMC free article] [PubMed] [Google Scholar]
- 31.Murdaugh DL, Cox JE, Cook EW 3rd, Weller RE. fMRI reactivity to high-calorie food pictures predicts short-and long-term outcome in a weight-loss program. Neuroimage 2012; 59: 2709–21. [DOI] [PMC free article] [PubMed] [Google Scholar]
- 32.Bruce AS, Bruce JM, Ness AR, Lepping RJ, Malley S, Hancock L, et al. A comparison of functional brain changes associated with surgical versus behavioral weight loss. Obesity (Silver Spring) 2014; 22: 337–43. [DOI] [PMC free article] [PubMed] [Google Scholar]
- 33.Wing RR, Hill JO. Successful weight loss maintenance. Annual review of nutrition 2001; 21: 323–41. [DOI] [PubMed] [Google Scholar]
- 34.Maclean PS, Bergouignan A, Cornier MA, Jackman MR. Biology’s response to dieting: the impetus for weight regain. Am J Physiol Regul Integr Comp Physiol 2011; 301: R581–600. [DOI] [PMC free article] [PubMed] [Google Scholar]
- 35.Wadden TA, Stunkard AJ, Day SC, Gould RA, Rubin CJ. Less food, less hunger: reports of appetite and symptoms in a controlled study of a protein-sparing modified fast. Int J Obes 1987; 11: 239–49. [PubMed] [Google Scholar]
- 36.Wing RR, Marcus MD, Blair EH, Burton LR. Psychological responses of obese type II diabetic subjects to very-low-calorie diet. Diabetes Care 1991; 14: 596–9. [DOI] [PubMed] [Google Scholar]
- 37.Anton SD, Han H, York E, Martin CK, Ravussin E, Williamson DA. Effect of calorie restriction on subjective ratings of appetite. J Hum Nutr Diet 2009; 22: 141–7. [DOI] [PMC free article] [PubMed] [Google Scholar]
- 38.Martin CK, Redman LM, Zhang J, Sanchez M, Anderson CM, Smith SR, et al. Lorcaserin, a 5-HT(2C) receptor agonist, reduces body weight by decreasing energy intake without influencing energy expenditure. J Clin Endocrinol Metab 2011; 96: 837–45. [DOI] [PMC free article] [PubMed] [Google Scholar]
- 39.Weingarten HP, Elston D. The phenomenology of food cravings. Appetite 1990; 15: 231–46. [DOI] [PubMed] [Google Scholar]
- 40.Batra P, Das SK, Salinardi T, Robinson L, Saltzman E, Scott T, et al. Relationship of cravings with weight loss and hunger. Results from a 6 month worksite weight loss intervention. Appetite 2013; 69: 1–7. [DOI] [PubMed] [Google Scholar]