Abstract
As a widely used animal model in MR imaging studies, rhesus macaque helps to better understand both normal and abnormal neural development in the human brain. However, the available adult macaque brain atlases are not well suitable for study of brain development at the early postnatal stage, since this stage undergoes dramatic changes in brain appearances and structures. Building age matched atlases for this critical period is thus highly desirable yet still lacking. In this paper, we construct the first spatiotemporal (4D) cortical surface atlases for rhesus macaques from 2 weeks to 24 months, using 138 longitudinal MRI scans from 32 healthy rhesus monkeys. Specifically, we first perform intra-subject cortical surface registration to obtain within-subject mean cortical surfaces. Then, we perform inter-subject registration of within-subject mean surfaces to obtain unbiased and longitudinally-consistent 4D cortical surface atlases. Based on our 4D rhesus monkey atlases, we further chart the first developmental-trajectories-based parcellation maps using the local surface area and spectral clustering algorithm. Our 4D macaque surface atlases and parcellation maps will greatly facilitate early brain development studies of macaques.
Index Terms: Rhesus macaque, monkey, cortical surface atlas, brain development, parcellation
1. INTRODUCTION
Nonhuman primates, particularly the rhesus macaques (Macaca mulatta), are a widely used animal model for investigating the neural substrates of human social behaviors and complex cognitive functions, due to their phylogenetic closeness to humans [1, 2]. The gene-editing technologies further make it feasible to create monkey models for human neurodevelopmental disorders (e.g., autism spectral disorder and Rett syndrome [3]). Hence, studying the rhesus brain development based on Magnetic Resonance (MR) images is important not only for understanding the maturation of normal brains but also for investigating the intervention and treatment of neurodevelopmental disorders [4].
During the early postnatal stage, the rhesus cerebral cortex undergoes a dynamic and critical development in both structures and functions. As a foundation in brain MRI studies, brain atlas provides appropriate reference spaces that facilitate both the analysis of spatially-localized experimental data and the comparison across individuals and studies. However, the available adult monkey atlases are not well suitable for monkey studies during early postnatal stage. This is because as the MR images of infant monkey brains have dramatic changes in image contrast, intensity appearance, brain size, and cortical folding degree across different ages, as shown in Fig. 1. Hence, a spatiotemporal atlas (i.e., 4D) is highly desired, yet still lacking.
Fig. 1.

Longitudinal T1-weighted scans of a typical rhesus from 2 weeks to 12 months.
As in human brain MRI studies, cortical surface-based analysis is highly suitable for studying the convoluted cerebral cortex in rhesus macaques. Therefore, we are motivated to develop the first spatiotemporal (i.e., 4D) cortical surface atlas of infant rhesus macaques for comprehensively characterizing early postnatal brain in macaque. More specifically, our 4D macaque atlas is created at 13 time points, from 2 weeks to 24 months of age, based on 138 serial MRI scans from 32 rhesus monkeys. In addition, we further parcellate our 4D atlas into distinct regions based on cortical development, which reflects the underlying cortical microstructural changes and thus helps define the microstructurally distinctive cortical regions.
2. METHODS
2.1. Data and image processing
This study was performed based on a public rhesus macaque neurodevelopment data set with 32 (Macaca mulatta) [1], in which each monkey has 4 to 5 longitudinal MRI scans during early postnatal stages, by using a GE MR 750 3.0T scanner. The number of subjects at each age is shown in Fig. 2. T1-weighted (T1w) MR images were acquired using parameters: TI/TR/T E = 450/8.684/3.652 ms, FOV=140 ×140 mm, flip angle = 12, acquisition matrix= 256 × 256, and voxel size= 0.55 × 0.55 × 0.8 mm3. T2-weighted (T2w) MR images were acquired using parameters: T R/T E = 2500/87 ms, flip angle = 90, acquisition matrix= 256 × 256, and voxel size = 0.6 × 0.6 × 0.6 mm3.
Fig. 2.
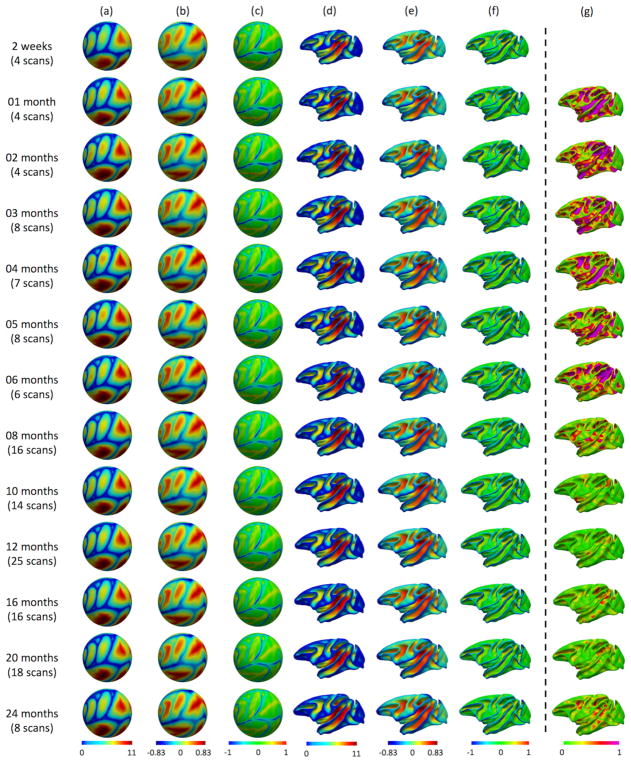
The constructed 4D cortical surface atlases of rhesus macaque from 2 weeks to 24 months (a–f) and the absolute difference of the average convexity between two consecutive time points (g). The cortical folding geometrics are mapped on the spherical space (a, b, c) and averaged inner cortical surfaces (d, e, f). (a) and (d) show the sulcal depth, (b) and (e) show the average convexity, (c) and (f) the mean curvature.
All T2w MR images were rigidly aligned onto the corresponding T1w MR images, and all images were resampled to 0.55 × 0.55 × 0.55 mm3. To handle the low tissue contrast problem appeared in early stage postnatal MRI scans, we applied our in-house developed tools for infant brain tissue segmentation and cortical surface reconstruction [5, 6, 7]. At each vertex on the reconstructed cortical surfaces, the cortical morphological features (e.g., cortical thickness, sulcal depth, average convexity and curvature) were computed. All cortical surfaces were then mapped onto a standard sphere to facilitate further atlas construction and analysis.
2.2. Construction of 4D cortical surface atlas
Given the macaque monkeys with longitudinal scans, it is problematic to directly build the 4D cortical surface atlas by aligning all subjects at age separately using group-wise registration. This is because the resulting 4D atlas would have neither temporal correspondences, nor temporally-consistent appearance, and hence influences the analysis of early brain development. To address these issues and leverage within-subject longitudinal constraints, an advanced registration strategy proposed in [7] is adopted.
More specifically, first, to establish the unbiased within-subject longitudinal correspondences, the intra-subject cortical surface registration is performed using Spherical Demons [8]. Second, based on the resulted cortical correspondences, the within-subject mean cortical surface is computed for each subject. During early postnatal stages, although the brain size and shape are growing dramatically, the major cortical folds are present at term birth and preserved during postnatal development [4]. Therefore, within-subject mean cortical surfaces are sharp and contain detailed information of cortical folding. Third, inter-subject cortical surface registration is performed by group-wisely aligning the within-subject mean cortical surfaces across all subjects, thus establishing unbiased inter-subject cortical correspondences. The unbiased population-mean surface across all subjects and time points is obtained by averaging all within-subject mean cortical surfaces. Fourth, each surface is mapped onto a common space by using the deformation field concatenated from two deformation fields: 1) the one from each surface to its within-subject mean surface, and 2) the one from within-subject mean surface to the population mean surface. Each surface at the common space is then resampled to a standard mesh tessellation, thus leading to longitudinally-consistent inter-subject cortical correspondences. Fifth, for each time point, an age-specific surface atlas is built by attaching the corresponding mean cortical folding features, e.g., mean sulcal depth, average convexity and mean curvature [9], across all subjects.
2.3. Development-based atlas parcellation
Based on the established longitudinal and cross-sectional cortical correspondences, the developmental trajectory is defined at vertex-level by concatenating the corresponding cortical attributes across different time points. In this study, we adopt the local surface area as a cortical attribute for atlas parcellation. However, our method is generic to use other cortical attributes, e.g., cortical thickness and cortical folding. For example, given a vertex i of the subject s and its local surface area at time point t denoted as , the developmental trajectory of the vertex i is defined as over totally Ts longitudinal scans. Of note, the dynamic cortical developmental trajectories in infant macaques reflect the underlying microstructural changes of the cortex, and thus could help better define the microstructurally and functionally distinctive regions than using the conventional sulcalgyral landmarks, which often have poor correspondences with microstructural borders.
Let As denotes the affinity matrix for subject s, As(i, j) is the affinity of developmental trajectories between vertices i and j. This is first computed as the Pearson’s correlation between the developmental trajectories of Vs(i) and Vs(j). The resulted As(i, j) is then normalized as between [0, 1], for describing the similarity of the developmental trajectories of two vertices. If two vertices i and j have very different developmental trajectories, the corresponding As(i, j) is low and vice versa. The mean similarity matrix A is computed by averaging all similarity matrices across all subjects.
We then apply the spectral clustering method [10] on the matrix A to perform the parcellation. More specifically, we normalize A as L = D−1/2AD−1/2, where D is a diagonal matrix with D(i, i) = Σj Ai,j. Next, the data is represented in an eigenspace using top 30 eigenvectors of D, which can better capture the distributions of the original data points. Finally, based on the new data representation in the eigenspace, we use a k-means clustering method to cluster the vertices into different groups.
3. RESULTS
Fig. 2 shows our constructed 4D cortical surface atlas of macaques during the first 24 months, including 13 time points at 2 weeks, 1, 2, 3, 4, 5, 6, 8, 10, 12, 16, 20, 24 months of age. The cortical folding geometrics are mapped on the spherical space (a,b,c) and also the averaged inner cortical surface (d,e,f). Specifically, (a) and (d) show the sulcal depth, (b) and (e) show the averaged convexity, and (c) and (f) show the mean curvature. As can be observed, major cortical folds are already established at birth and remain relatively consistent during brain development. However, both average convexity and sulcal depth develop rapidly especially during the first 6 months and then change gradually. This can also be observed in Fig. 2(g), which shows the absolute difference of the average convexity between two consecutive time points. These observations indicate the necessity of building the 4D atlas, especially for early postnatal stage with dynamic development.
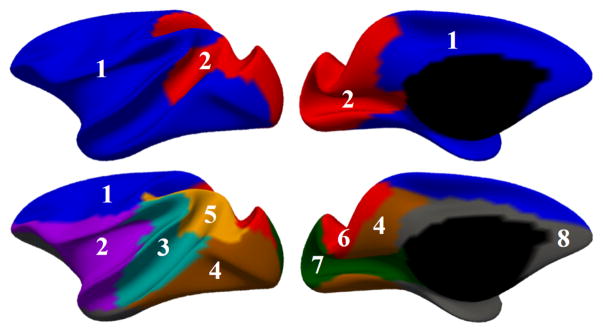
The developmental-trajectories-based parcellation has been performed on the constructed 4D rhesus monkey atlas. To capture the coarse pattern in developmental regionalization of cortical structure, we first constrained the number of clusters to be two. In Fig. 3, the top row shows the two-cluster parcellation on the slightly inflated average inner cortical surface. This parcellation map shows an anterior-posterior division, where the occipital and superior parietal cortices (labeled as region 2) are separated from the frontal, temporal, insula and inferior parietal cortices (labeled as region 1).
Fig. 3.
Development-based atlas parcellation maps with two different cluster numbers, K = 2 (in the top row) and K = 8 (in the bottom row), respectively.
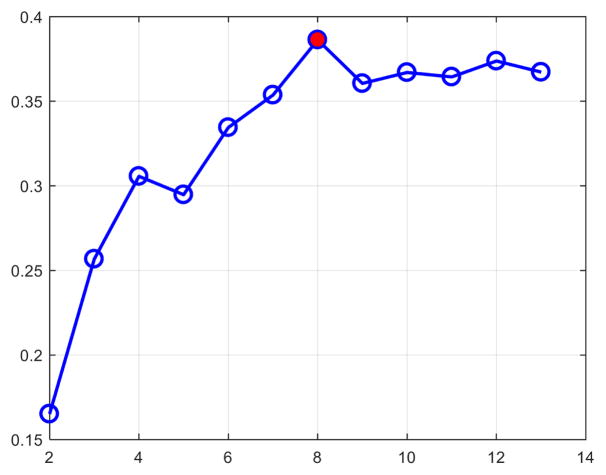
To determine the appropriate number of clusters K, we computed the widely used silhouette coefficient [11]. As plotted in Fig. 4, based on the peak of the silhouette coefficients, we identified K = 8 clusters for building our 4D macaque cortical surface atlas. The clustering results are shown in the bottom row of Fig. 3, from which we can observe that the clusters correspond closely to the structurally and functionally meaningful regions. According to the labeled numbers in the figure, these regions approximately correspond to: (1) superior and middle frontal, (2) inferior frontal, insula and temporal pole, (3) superior temporal, (4) inferior temporal and precuneus, (5) supra-marginal, (6) superior parietal, (7) occipital, and (8) limbic and cingulate. This parcellation map shows meaningful correspondences to existing neuroscience knowledge. This also helps justify our assumption, i.e., cortex development reflects structurally and functionally distinct regions, which can be determined by the underlying microstructure. Our 4D infant macaque cortical atlas equipped with development-based parcellations will be a good reference for visualization, spatial normalization, analysis and comparison among various studies on both normal and abnormal monkey brain development.
Fig. 4.
The silhouette coefficients.
4. CONCLUSION
In this work, for the first time, we have built a 4D cortical surface atlas for infant rhesus monkeys from 2 weeks to 24 months, with dense time points and through an unbiased and longitudinally-consistent manner. More importantly, we have unprecedentedly parcellated our 4D cortical surface atlas into distinct regions using developmental trajectories of local surface area. In the future, we will provide more cortical attributes, e.g., local gyrification and myeline content, onto our 4D rhesus atlas and also make our 4D atlas publicly available to greatly facilitate early brain research in monkeys.
Acknowledgments
This work is supported in part by NIH grants: MH100217, MH108914, MH107815 and MH109773.
Thanks to Dr. Matin A. Styner and his co-authors for making the UNC-Wisconsin Neurodevelopment Rhesus MRI Database publicly available.
References
- 1.Young Jeffrey T, Shi Yundi, Niethammer Marc, et al. The unc-wisconsin rhesus macaque neurodevelopment database: A structural mri and dti database of early postnatal development. Front Neurosci. 2017;11:29. doi: 10.3389/fnins.2017.00029. [DOI] [PMC free article] [PubMed] [Google Scholar]
- 2.Malkova L, Heuer E, Saunders RC. Longitudinal magnetic resonance imaging study of rhesus monkey brain development. Eur J of Neurosci. 2006;24(11):3204–3212. doi: 10.1111/j.1460-9568.2006.05175.x. [DOI] [PubMed] [Google Scholar]
- 3.Chen Yongchang, Yu Juehua, Niu Yuyu, et al. Modeling rett syndrome using talen-edited mecp2 mutant cynomolgus monkeys. Cell. 2017;169(5):945–955. doi: 10.1016/j.cell.2017.04.035. [DOI] [PMC free article] [PubMed] [Google Scholar]
- 4.Scott Julia A, Grayson David, Fletcher Evan, et al. Longitudinal analysis of the developing rhesus monkey brain using magnetic resonance imaging: birth to adulthood. Brain Struct Funct. 2016;221(5):2847–2871. doi: 10.1007/s00429-015-1076-x. [DOI] [PMC free article] [PubMed] [Google Scholar]
- 5.Li Gang, Nie Jingxin, Wang Li, et al. Measuring the dynamic longitudinal cortex development in infants by reconstruction of temporally consistent cortical surfaces. NeuroImage. 2014;90:266–279. doi: 10.1016/j.neuroimage.2013.12.038. [DOI] [PMC free article] [PubMed] [Google Scholar]
- 6.Wang Li, Gao Yaozong, Shi Feng, et al. Links: Learning-based multi-source integration framework for segmentation of infant brain images. NeuroImage. 2015;108:160–172. doi: 10.1016/j.neuroimage.2014.12.042. [DOI] [PMC free article] [PubMed] [Google Scholar]
- 7.Li Gang, Wang Li, Shi Feng, et al. Construction of 4d high-definition cortical surface atlases of infants: Methods and applications. Med Image Anal. 2015;25(1):22–36. doi: 10.1016/j.media.2015.04.005. [DOI] [PMC free article] [PubMed] [Google Scholar]
- 8.Thomas Yeo BT, Sabuncu Mert R, Vercauteren Tom, et al. Spherical demons: fast diffeomorphic landmark-free surface registration. IEEE TMI. 2010;29(3):650–668. doi: 10.1109/TMI.2009.2030797. [DOI] [PMC free article] [PubMed] [Google Scholar]
- 9.Fischl Bruce, Sereno Martin I, Tootell Roger BH, et al. High-resolution intersubject averaging and a coordinate system for the cortical surface. Hum Brain Mapp. 1999;8(4):272–284. doi: 10.1002/(SICI)1097-0193(1999)8:4<272::AID-HBM10>3.0.CO;2-4. [DOI] [PMC free article] [PubMed] [Google Scholar]
- 10.Ng Andrew Y, Jordan Michael I, Weiss Yair. Adv Neural Info Proc Syst. MIT Press; 2002. On spectral clustering: Analysis and an algorithm; pp. 849–856. [Google Scholar]
- 11.Rousseeuw Peter J. Silhouettes: a graphical aid to the interpretation and validation of cluster analysis. J Comput Appl Math. 1987;20:53–65. [Google Scholar]


