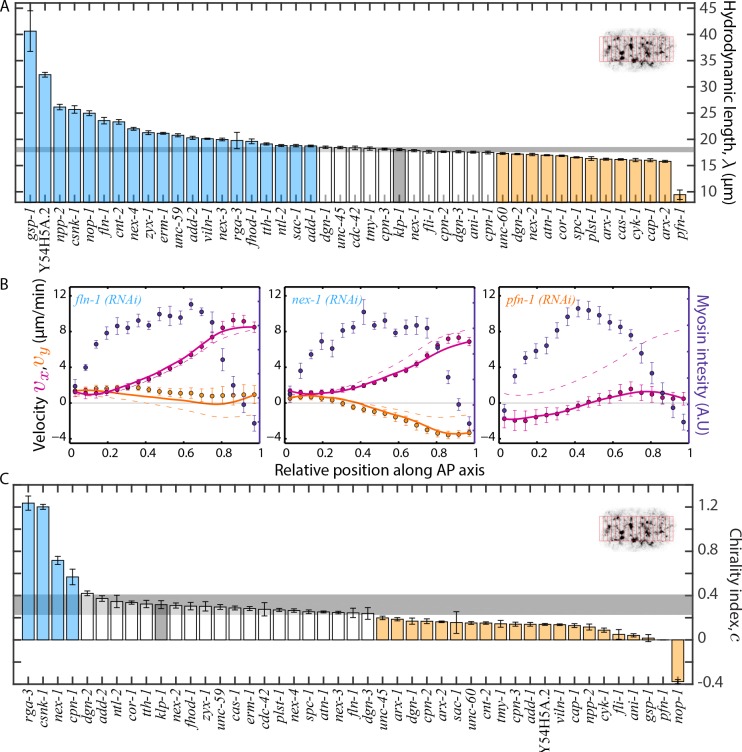
Figure 6. Estimation of physical properties of the cortex.
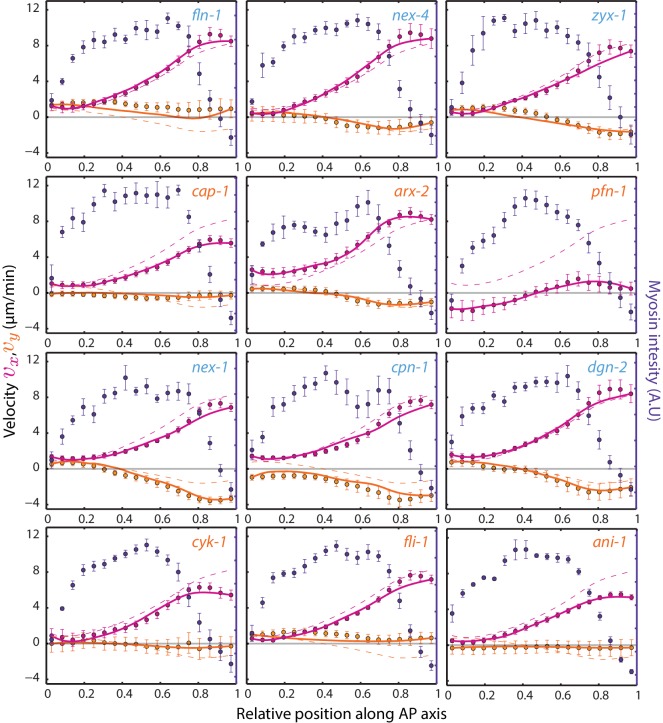
(A), (C) Comparison of the hydrodynamic length, and chirality index, of the cortex respectively. Error bars, SEM; gray bar, negative control, klp-1 (RNAi) condition; gray horizontal bar, error of the mean with 99% confidence for klp-1 (RNAi); cyan, beige bars, significantly different knockdowns with 99% confidence (significance determined using normal cumulative distribution function in MATLAB). The bins over which spatial average of velocities were determined in each frame are shown in the inset. (B) Average myosin intensity (blue markers) and velocity profiles (magenta markers, AP flow velocity ; beige markers, y-velocity ) along the AP axis for representative RNAi conditions. Error bars, SEM. Magenta and beige curves, respective theoretical velocity profiles. Dashed lines, theoretical velocity profiles for klp-1 (RNAi) condition. See Figure 6—figure supplement 1 for more examples of fit profiles of significantly different ABPs. See Supplementary file for number of independent embryo samples in each RNAi condition.


