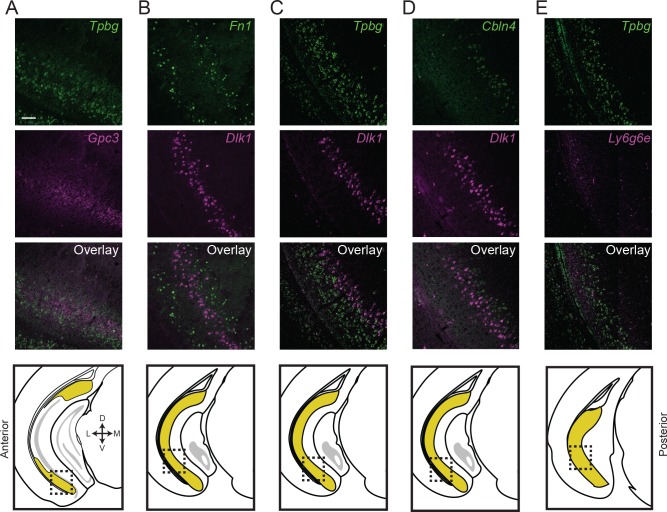
Figure 5. Subiculum subclasses exhibit discrete, abutting boundaries.
(A) Two-color fluorescent ISH detecting expression of Tpbg and Gpc3 marker genes, directly illustrating subiculum subdomains are abutting and non-overlapping. Atlas schematic in lowest row denotes area examined. (B-E) As in (A), but for Fn1 and Dlk1 (B), Tpbg and Dlk1 (C), Cbln4 and Dlk1 (D), and Tpbg and Ly6g6e (E). Scale bars: 100 μm.

