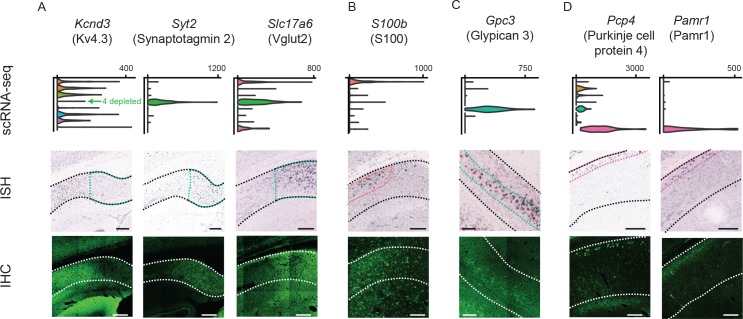
Figure 8. Differentially expressed genes correspond to cluster-specific protein products.
Top row: gene names, along with associated protein products targeted in IHC. Second row: violin plots of genes that were enriched or depleted in specific clusters. Third row: ISH images of corresponding genes. Black dashed lines illustrate extent of pyramidal cell layer. Colored dashed lines denote spatial domain of associated cluster. Fourth row: immunohistochemical detection of protein products. White dashed lines illustrate extent of pyramidal cell layer. (A) Gene products enriched or depleted in the Fn1-expressing cluster (i.e. cluster 4); namely, Kcnd3 (encoding the potassium channel subunit Kv4.3), Syt2 (encoding synaptotagmin 2, involved in exocytosis), and Slc17a6 (encoding Vglut2, mediating glutamate uptake into synaptic vesicles). (B) Results for S100, expressed in the S100b-expressing cluster (i.e. cluster 1). Note that the antibody recognizes S100 (i.e. both S100B and S100A) and thus labels astrocytes as well as neurons. (C) Results for the gene product Gpc3/Gpc3, enriched in the Gpc3-expressing cluster (i.e. cluster 5). (D) Results for the gene products Pcp4/Pcp4 and Pamr1/Pamr1, enriched in the Ly6g6e-expressing cluster (i.e. cluster 9). All scale bars: 200 μm.


