

Abstract
Purpose:
Myocardial injury connotes worse prognosis in the Acute Respiratory Distress Syndrome (ARDS), however the prognostic connotation of changes in cardiac troponin (cTn) levels in ARDS patients is not known.
Methods:
We performed a study of 908 ARDS patients enrolled in two previously completed ARDS Network trials. We obtained plasma samples via the NIH BIOLINCC repository and measured cTn using the ARCHITECT STAT high sensitivity troponin-I assay (Abbott Laboratories) at trial day 0 and 3. We constructed Cox proportional hazard models to determine the association between 60-day mortality and quintiles of percentage change in high-sensitivity troponin (ΔhsTnI).
Results:
The median percent change in hsTnI (%ΔhsTnI) from day 0 to day 3 was −58.2% (IQR −79.0 to 0%). After multivariable adjustment, participants with a 32.1% or greater increase in hsTnI between day 0 and day 3 (highest quintile) had a 2.27 fold increased risk for mortality (95% CI 1.29 – 3.99, p=0.002) as well as fewer ventilator-free and ICU-free days compared to the lowest quintile.
Conclusion:
Progressive myocardial injury in ARDS patients is associated with worse outcome, independent of severity of critical illness. Investigation of the mechanisms underlying this relationship is warranted to guide possible strategies to mitigate myocardial injury in ARDS.
Keywords: ARDS, troponin, myocardial injury, cardiac, hypoxia
Introduction
The acute respiratory distress syndrome (ARDS) is a common cause of respiratory failure with substantial associated morbidity and mortality (1, 2). Cardiac involvement in ARDS, in the form of pulmonary vascular and right heart disease (3–5) and myocardial injury (6–11), is associated with adverse outcome in ARDS, and strategies to reduce myocardial injury in critical illness are attractive as potential therapies. Most studies have assessed the association between myocardial injury and ARDS outcomes using measures of myocardial injury at a single time point (6, 8, 9, 11), however serial measurements of myocardial injury could give clinicians an additional risk discriminator or opportunity to intervene. Serial measurements could also help distinguish ongoing myocardial injury from chronic myocardial injury. Peak troponin levels were associated with worsening echocardiographic indices of right heart function in a small study of 42 patients with ARDS (12), and increasing troponin levels on serial examinations was associated with worse outcome in sepsis and other non-cardiac critical illness (13, 14). Data assessing the association of progressive myocardial injury with ARDS outcomes are lacking.
Current highly-sensitivity assays for cardiac troponin (hsTnI) detect troponin in over 90% of patients with ARDS (8) and provide an opportunity to characterize ARDS-associated myocardial injury with sensitivity and precision. We performed a multi-center cohort study of ARDS patients to determine whether the change in hsTnI over 3 days is associated with mortality, hypothesizing that those patients with rising hsTnI levels over 3 days would have increased mortality. We also investigated patient and disease-specific factors associated with progressive myocardial injury.
Methods
Patient population
Our study population was comprised of patient cohorts from two NHLBI-sponsored ARDS Network clinical trials. The ALVEOLI trial enrolled patients in 23 ICUs, and randomized 549 subjects with ARDS already receiving low tidal volume ventilation to receive treatment with a lower or a higher positive end-expiratory pressure (PEEP) strategy (15). The Fluid and Catheter Treatment Trial (FACTT) included 1000 subjects with ARDS across 20 ICUs in a 2×2 design, randomizing subjects to conservative or liberal fluid management strategies and to treatment guided by a pulmonary artery catheter or central venous catheter (16, 17).
The inclusion criteria were similar in both trials. All patients had ratio of partial pressure of oxygen (PaO2) to fraction of inspired oxygen (fiO2) less than 300, bilateral pulmonary infiltrates, and no clinical evidence of left atrial hypertension. Patients with acute myocardial infarction and those patients with severe chronic pulmonary or neuromuscular disease were excluded. Only 27 of 1000 patients enrolled in FACTT had a history of prior heart failure, whereas the ALVEOLI trial did not report information on history of heart failure. Patients on hemodialysis were excluded from the FACTT trial, and hemodialysis status was not reported in the ALVEOLI trial.
We obtained the trial data sets and plasma samples from the NIH Biologic Specimen and Data Repository Information Coordinating Center (BioLINCC) (18, 19). For the present study, we included 908 ALVEOLI and FACTT subjects who were intubated within the 24 hours prior to study enrollment (day 0), were alive at study day 3, and who had an available plasma sample from study day 0 and 3. Study flow is displayed in the Supplemental Figure 1. Both initial trials were approved by participating Institutional Review Boards (IRB) (15–17). For this study, all data were publicly available from BioLINCC and no protected health information was included in study data sets. Thus, the Johns Hopkins Hospital IRB exempted our study from IRB review.
High sensitivity troponin I (hsTnI) measurements
We measured hsTnI in EDTA-anticoagulated plasma samples using the ARCHITECT STAT hsTnI assay (Abbott Laboratories). The limit of detection (LoD) was 2 ng/L. For subjects with values below the LoD, the value was set at LoD divided by (1.3 ng/L). The upper reference limit (99th percentile value of a healthy reference population) was 26 ng/L (20, 21).
Study endpoints
The primary outcome was in-hospital death within 60 days of enrollment. The secondary outcomes were ICU-free days (defined as the number of days not in the ICU within the first 30 days of trial enrollment) and ventilator free days (defined as the number of days not receiving mechanical ventilation within the first 30 days of trial enrollment).
Other variables
The Sequential Organ Failure Assessment (SOFA) score on day 0, an indicator of global illness severity, was used to adjust for the heterogeneity in injury severity within the study cohort (22). Other notable covariates included demographics, ventilator parameters, primary cause of ARDS, and vasopressor requirement.
Statistical analysis
The main exposure variable of interest was the percentage change in hsTnI (%ΔhsTnI), defined as [(hsTnIDay 3 − hsTnIDay 0)*100]/hsTnIDay 0. For the primary analysis, we categorized %ΔhsTnI into quintiles. We report categorical and continuous demographic and clinical data across quintiles of percentage change in troponin. We performed a trend analysis to determine whether a linear trend exists in the association between demographic/clinical variable and %ΔhsTnI category. We utilized univariate logistic regression models for categorical variables and linear regression models for continuous variables. The P value reported in Table 1 is from an F test for the null hypothesis that model coefficients are zero. We used Cox proportional hazards models to estimate the hazard ratios (with 95% confidence intervals [CI]) for all-cause mortality comparing %ΔhsTnI quintiles to the lowest quintile. Patients were followed-up from day 3 until death, hospital discharge, or trial day 60, consistent with the parent trials. For secondary endpoints, we used multiple linear regression to estimate the average difference (with 95% CI) in ICU-free days and ventilator-free days comparing %ΔhsTnI quintiles to the lowest quintile.
Table 1.
Characteristics of study participants by quintile of percent change in high sensitivity troponin I levels between the day of intubation (day 0) and day 3.
| Quintile of percent change in HS-troponin (range) |
|||||||
|---|---|---|---|---|---|---|---|
| Overall | First (−98.5 to −81.8%) | Second (−81.8 to −67.6%) | Third (−67.6 to −40.7%) | Fourth (−40.7 to 32.1%) | Fifth (>32.1%) | P value | |
| Number | 908 | 181 | 182 | 181 | 182 | 182 | |
| Age, years | 50.4 | 47.1 | 49.1 | 51.5 | 53.8 | 51.4 | 0.005 |
| Ethnicity, % | 0.09 | ||||||
| White | 68.4 | 62.4 | 68.7 | 76.8 | 71.4 | 62.6 | |
| Black | 19.2 | 24.3 | 17.6 | 14.4 | 18.1 | 21.4 | |
| Other | 12.4 | 13.3 | 13.7 | 8.8 | 10.4 | 15.9 | |
| Male sex, % | 52.3 | 47.5 | 54.9 | 50.8 | 55.5 | 52.7 | 0.54 |
| Primary cause of ARDS, % | 0.04 | ||||||
| Aspiration | 15.5 | 14.4 | 17.6 | 14.9 | 15.4 | 15.4 | |
| Pneumonia | 48.2 | 43.1 | 48.4 | 48.1 | 53.8 | 47.8 | |
| Sepsis | 22.0 | 22.7 | 22.0 | 27.1 | 14.8 | 23.6 | |
| Transfusion | 1.8 | 5.0 | 1.1 | 0.6 | 1.6 | 0.5 | |
| Trauma | 4.4 | 7.2 | 3.3 | 5.5 | 2.7 | 3.3 | |
| Other | 8.0 | 7.7 | 7.7 | 3.9 | 11.5 | 9.3 | |
| Day 0 variables | |||||||
| HS-troponin, ng/L | 978.9 | 1,843.2 | 1,947.6 | 362.8 | 569.2 | 173.0 | -- |
| Temperature, °C | 37.5 | 37.8 | 37.7 | 37.5 | 37.5 | 37.2 | <0.001 |
| Heart rate, beats per min | 101.7 | 105.4 | 102.7 | 99.4 | 99.6 | 101.1 | 0.03 |
| Systolic BP, mmHg | 112.3 | 111.0 | 112.9 | 115.6 | 112.7 | 109.2 | 0.05 |
| Diastolic BP, mmHg | 58.8 | 59.9 | 60.3 | 59.3 | 58.6 | 55.9 | 0.004 |
| Vasopressor use, % | 31.1 | 35.9 | 29.7 | 24.3 | 29.1 | 36.2 | 0.07 |
| Height, cm | 169.7 | 169.4 | 169.9 | 169.5 | 170.4 | 169.0 | 0.78 |
| Weight, kg | 79.6 | 80.0 | 80.4 | 80.6 | 80.0 | 77.3 | 0.62 |
| SOFA score | 7.6 | 7.5 | 7.5 | 7.6 | 7.5 | 8.0 | 0.50 |
| Tidal volume, mL | 479.0 | 488.1 | 481.0 | 474.8 | 485.5 | 465.5 | 0.33 |
| PEEP, cm H2O | 9.4 | 9.9 | 9.1 | 9.2 | 9.3 | 9.4 | 0.44 |
| Plateau pressure, cm H2O | 26.0 | 27.0 | 26.3 | 25.4 | 25.7 | 25.8 | 0.28 |
| FiO2 | 0.65 | 0.66 | 0.63 | 0.60 | 0.65 | 0.70 | <0.001 |
| PaO2/FiO2 ratio | 149.5 | 152.9 | 148.7 | 160.6 | 146.0 | 139.5 | 0.04 |
| Lung compliance, mL/cmH2O | 32.8 | 32.0 | 31.6 | 33.2 | 34.1 | 33.2 | 0.73 |
| Murray Lung Injury score | 2.8 | 2.9 | 2.9 | 2.8 | 2.8 | 2.8 | 0.79 |
| pH | 7.37 | 7.38 | 7.37 | 7.37 | 7.37 | 7.34 | 0.004 |
| pCO2, mmHg | 39.6 | 38.1 | 39.8 | 40.1 | 40.4 | 39.9 | 0.23 |
| pO2, mmHg | 89.7 | 94.3 | 87.2 | 90.1 | 87.6 | 89.4 | 0.51 |
| Creatinine, mg/dL | 1.51 | 1.40 | 1.39 | 1.67 | 1.50 | 1.58 | 0.32 |
| Day 3 variables | |||||||
| HS-troponin, ng/L | 386.9 | 178.7 | 470.2 | 158.5 | 403.2 | 721.7 | -- |
| Temperature, °C | 37.3 | 37.2 | 37.4 | 37.4 | 37.3 | 37.3 | 0.23 |
| Heart rate, beats per min | 93.7 | 92.4 | 93.0 | 95.6 | 92.4 | 94.8 | 0.38 |
| Systolic BP, mmHg | 122.4 | 121.1 | 123.9 | 122.0 | 123.2 | 121.8 | 0.80 |
| Diastolic BP, mmHg | 63.2 | 63.5 | 64.4 | 62.3 | 63.0 | 63.0 | 0.67 |
| Vasopressoruse, % | 15.2 | 10.5 | 11.0 | 13.3 | 17.6 | 23.6 | 0.003 |
| Weight, kg | 84.0 | 84.0 | 83.6 | 84.0 | 84.3 | 83.9 | 0.99 |
| Tidal volume, mL | 396.8 | 392.7 | 401.7 | 404.3 | 398.5 | 386.7 | 0.34 |
| PEEP, cm H2O | 8.5 | 8.3 | 7.7 | 8.4 | 8.7 | 9.5 | 0.003 |
| Plateau pressure,cm H2O | 23.0 | 22.6 | 22.6 | 22.8 | 22.8 | 24.4 | 0.10 |
| FiO2, | 0.48 | 0.47 | 0.46 | 0.48 | 0.49 | 0.5 | 0.14 |
| PaO2/FiO2 ratio, | 185.8 | 198.7 | 187.7 | 187.2 | 182.2 | 173.3 | 0.08 |
| Lung compliance, mL/cmH2O | 32.3 | 33.1 | 31.7 | 32.5 | 33.8 | 30.1 | 0.57 |
| pH | 7.40 | 7.42 | 7.41 | 7.39 | 7.39 | 7.37 | <0.001 |
| pCO2, mmHg | 42.8 | 41.9 | 42.0 | 42.8 | 43.3 | 44.2 | 0.41 |
| pO2, mmHg | 81.1 | 84.2 | 81.0 | 80.2 | 80.8 | 79.0 | 0.52 |
| Fluid balance, mL | 4,554.2 | 4,364.8 | 3,109.6 | 3,839.2 | 4,668.9 | 6,783.6 | <0.001 |
Values in the Table were calculated using multiple imputation to take missing data into account (see Supplemental Table 1 for description of data available for each variable).
For all analyses, we used 3 models with increasing adjustment for potential confounders defined a priori. Model 1 was adjusted for age (continuous), sex, randomized trial assignment, and hs-troponin levels at day 0 (quintiles). Model 2 was further adjusted by SOFA score at day 0 (continuous). Model 3 further adjusted for use of vasopressors at day 0 and day 3, heart rate at day 0 and day 3 (continuous), and total fluid balance between day 0 and day 3 (continuous).
To evaluate determinants of hsTnI progression between day 0 and day 3, we used multiple linear regression with loge-transformed TnDay 3 as the dependent variable and day 0 and 3 clinical covariates as independent variables. The final model included variables with p <0.1 in univariate analyses and was further adjusted via stepwise backwards selection removing variables with p >0.1 to arrive at the final multivariate model.
Data were complete for hsTnIDay 0 and hsTnIDay 3 and for all outcomes. Covariates missing data are shown in the Supplemental Table 1. Multiple imputation using chained equations with 50 imputed data sets was performed to account for missing data. The main results using multiple imputation and using complete case analysis were similar. All results reported herein were obtained using the multiply imputed dataset. A two-tailed p-value <0.05 was considered statistically significant. Statistical analyses were performed using Stata version 15.0 (StataCorp Inc, College Station, TX).
Results
Patient characteristics and demographics are shown in Table 1, stratified by quintile of %ΔhsTnI. Patients with greater positive change in hsTnI were older, had worse hypoxemia on day 0, had lower pH on days 0 and 3,were more likely to require vasopressors and higher PEEP on day 3, and had a more positive cumulative fluid balance between days 0 and 3.
On average, hsTnI values decreased between day 0 and day 3 (Fig 1). The median hsTnIDay 0 was 36.2 ng/L (interquartile range 9.1-175.3 ng/L), the median hsTnIDay 3 was 18.2 ng/L (5.3-97.7 ng/L), and the median %ΔhsTnI was −58.1% (inter-quartile range of percentage change −78.9 to 0%). The majority of subjects (71.9%) had a decrease in hsTnI levels. hsTnI levels at days 0 and 3 were correlated (Spearman correlation coefficient 0.77), but there was substantial between subject variability in ΔhsTnI (Supplemental Figure 2).
Fig 1.
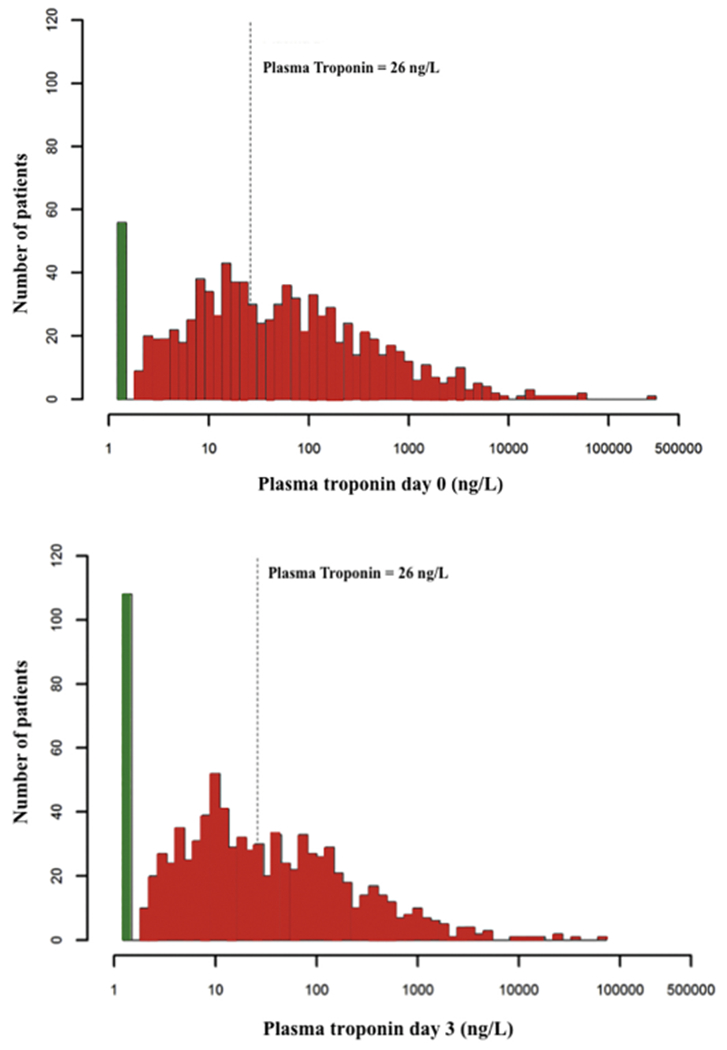
Histogram of the distributions of day 0 and day 3 high-sensitivity troponin levels.
The white bar represents those subjects with undetectable high-sensitivity troponin levels. The dotted line represents a high-sensitivity troponin level of 26 ng/L, corresponding to the 99th percentile reference value of a healthy population.
In multivariable models, significant predictors of day 3 hsTnI included day 0 hsTnI, age, day 0 temperature and day 0 heart rate, requirement for vasopressors on day 3, arterial pH on day 3 and peak creatinine level (Table 2). If only day 0 variables were considered in the final model, day 0 hsTnI, age, day 0 temperature, heart rate, creatinine, and FIO2 were strong predictors of day 3 troponin level (Supplemental Table 2). Significant predictors of the percentage change in troponin between day 0 and day 3 included only lower arterial pH on day 3 and lower temperature on trial day 0 (supplemental Table 3). Of note, neither PEEP nor total fluid balance was associated with day 3 troponin or trend in troponin in adjusted models. We defined “pulmonary ARDS” as ARDS due to aspiration or pneumonia and “extrapulmonary ARDS” as ARDS due to sepsis, transfusion, trauma or other causes. There were no significant differences in either day 0 troponin or trend in troponin between pulmonary or extarpulmonary ARDS.
Table 2.
Determinants of high sensitivity troponin I levels at day 3 after intubation.
| Ratio of geometric means (95% confidence interval) | P-value | |
|---|---|---|
| High-sensitivity troponin, day 0† | 46.44 (37.01 – 58.28) | <0.001 |
| Age | 1.46 (1.16 – 1.84) | 0.001 |
| Temperature, day 0 | 0.63 (0.50 – 0.78) | <0.001 |
| Heart rate, day 0† | 1.20 (0.95 – 1.52) | 0.009 |
| FiO2, day 0 | 1.26 (0.99 – 1.60) | 0.06 |
| Creatinine, day 0† | 4.06 (1.72 – 9.59) | <0.001 |
| Vasopressoruse, day 3 (yes vs. no) | 1.33 (1.06 – 1.69) | 0.016 |
| pH, day 3 | 0.48 (0.39 – 0.60) | <0.01 |
Values in the Table are ratios of geometric means calculated from linear regression models with log-high sensitivity troponin I levels at day 3 as outcome. For categorical variables, the ratios are compared with respect to the reference category. For continuous variables, the ratios compare the 90th to the 10th percentiles of the predict or variable in the overall study sample. The 90th and 10th percentiles were, for log high-sensitivity troponin at day 0, 6.71 and 1.06 log(ng/L); for age, 73 and 30 years; for temperature at day 0, 38.8 and 36.3 °C; for heart rate at day 0, 127 and 74 beats per minute; for FiO2 at day 0, 1.0 and 0.4; for creatinine at day 0, 2.7 and 0.5 mg/dL; and for pH at day 3, 7.48 and 7.28.
Ratios of geometric means were adjusted for other variables in the Table. Variables were included in the multivariable model if P <0.10 in the univariable model, and after a stepwise selection method with retention if P<0.10 in the multivariable model (see Methods for details). Values in the Table were calculated using multiple imputation to take missing data into account (see Supplemental Table 1 for description of data available for each variable).
Modeled as restricted cubic splines to accommodate non-linear associations (see Methods for details).
In-hospital mortality within 60 days of enrollment increased in a dose-dependent fashion with increasing %ΔhsTnI (Fig 2). After multivariable adjustment for trial assignment, age, sex, hsTnI at day 0, SOFA score at day 0, vasopressor use at day 0 and 3, heart rate and day 0 and 3, and total fluid balance between day 0 and 3, participants with a 32.1% or greater increase in hsTnI between day 0 and day 3 (highest quintile) had a 2.27 fold increased risk for mortality (95% CI 1.29 – 3.99, p=0.002; Table 3) as well as approximately 3.2 fewer ventilator-free and ICU-free days (Supplemental Table 4). Results were directionally and qualitatively similar when the absolute change in hsTnI between day 0 and day 3 was considered instead of %ΔhsTnI to assess hsTnI trajectories (Supplemental Table 5) with a statistical trend towards association of absolute change in hsTnI and outcome.
Fig 2.

Kaplan-Meier curves for cumulative mortality by quintiles of percent change in high-sensitivity troponin levels between day 0 and day 3.
Table 3.
Hazard ratios for 60-day mortality by quintile of % change in high sensitivity troponin I levels between the day of intubation (day 0) and day 3.
| Quintile of % change in hs-troponin between day 0 and day 3 (range) |
||||||
|---|---|---|---|---|---|---|
| First (−98.5 to −81.8%) | Second (−81.8 to −67.6%) | Third (−67.6 to −40.7%) | Fourth (−40.7 to 32.1%) | Fifth (>32.1%) | P trend | |
| Number of participants | 181 | 182 | 181 | 182 | 182 | |
| Mean hs-troponin at day 0, ng/L | 1,843.2 | 1,947.6 | 362.8 | 569.2 | 173.0 | |
| Mean hs-troponin at day 3, ng/L | 178.7 | 470.2 | 158.5 | 403.2 | 721.7 | |
| Mean change in hs-troponin (%) | −89.1 | −75.4 | −56.7 | −10.3 | 1,442.2 | |
| Number of deaths (%) | 27 (14.9) | 34 (18.7) | 49 (27.1) | 47 (25.8) | 68 (37.4) | |
| Model 1 | ||||||
| Hazard ratio (95% confidence interval) | 1.00 (reference) | 1.40 (0.84 – 2.35) | 2.14 (1.32 – 3.49) | 2.35 (1.41 – 3.91) | 3.88 (2.39 – 6.32) | <0.001 |
| Model 2 | ||||||
| Hazard ratio (95% confidence interval) | 1.00 (reference) | 1.42 (0.80 – 2.49) | 1.99 (1.16 – 3.41) | 2.11 (1.20 – 3.70) | 3.22 (1.86 – 5.59) | <0.001 |
| Model 3 | ||||||
| Hazard ratio (95% confidence interval) | 1.00 (reference) | 1.28 (0.72 – 2.27) | 1.67 (0.96 – 2.89) | 1.63 (0.92 – 2.90) | 2.27 (1.29 – 3.99) | 0.002 |
Values in the Table were calculated using multiple imputation to take missing data into account (see Supplemental Table 1 for description of data available for each variable).
Model 1: Adjusted for age, sex, randomized trial assignment, and hs-troponin levels at day 0 (quintiles).
Model 2: Further adjusted for SOFA score at day 0.
Model 3: Further adjusted for use of vasopressors at day 0 and day 3, heart rate at day 0 and day 3, and total fluid balance between day 0 and day 3 (continuous).
Discussion
We present a cohort study assessing the prognostic association of trajectories in cardiac troponin levels in patients with ARDS. We report several major findings. First, most patients with ARDS have detectable troponin which declines over time, however approximately 28% of patients with ARDS will manifest increasing hsTnI levels reflecting progressive myocardial injury over the first 72 hours of treatment. Second, several factors including age, vasopressor requirement, peak creatinine, temperature, and arterial pH are associated with progressive myocardial injury. Third, the relative change in hsTnI levels over the first 72 hours of treatment was a graded strong predictor of survival, ICU-free days, and ventilator free days. Our study suggests that progressive myocardial injury could represent a major determinant of outcome in ARDS patients, and serial hsTnI levels in these patients may have prognostic value.
Our group previously reported that over 90% of patients with ARDS manifest detectable troponin when evaluated with a highly sensitive troponin assay (8). The present study extends these findings, and we report that the majority of these patients will subsequently have declining troponin levels over their first 3 days of support. Only one other study has reported on the longitudinal trend in troponin levels in ARDS. In a cohort of 42 ARDS patients who had troponin-I (conventional assay) checked on ICU admission and every 12 hours thereafter for 72 hours (12), 16 of 42 patients had detectable troponin-I on admission. Overall, 25 of the 42 subjects ultimately had detectable levels over the study period, including 26% of those who had an initially negative troponin (12). In contrast, we report that most patients with initial detectable troponin will have subsequent level that declines. Differences between this small study and our results are likely explained by study size, single center versus multicenter design, and different troponin assay utilized. The study by Lazzeri and colleagues used a troponin-I assay that has a 99th percentile upper reference limit of 100ng/L (12). In contrast, we used a highly sensitive troponin assay with 99th percentile reference range of 26 ng/L and limit of detection of 2 ng/L, which is much more sensitive to detect myocardial injury. Our findings are similar to those of Masson et al in the Albumin Italian Outcome Sepsis (ALBIOS) study of crystalloid versus albumin (13). They report a cohort of patients with severe sepsis, the majority of whom were receiving mechanical ventilation. Between trial day 1 and 2, 21% of patients (92 of 436) had troponin levels measured with a highly sensitive assay that increased by 20% or more (13). Thus, our results and those of Masson and colleagues corroborate that most patients with critical illness have detectable troponin and most, but not all, of the myocardial injury improves over time with ICU management.
Elevated troponin can be secondary to type I myocardial infarction related to coronary plaque rupture, type II myocardial infarction related to mismatch between myocyte oxygen demand and supply, or myocardial injury not meeting criteria for myocardial infarction (23–25). In our study, patients were excluded prior to trial enrollment if they had active cardiac ischemia. Thus we suspect that the myocardial injury in our cohort relates to the underlying critical illness. We previously reported that creatinine and SOFA score, arterial pH and pCO2, and heart rate and body temperature were associated with initial day 0 hsTnI levels. In the present analysis, we report that day 0 hsTnI, temperature, heart rate, vasopressor use, and arterial pH and the peak creatinine were associated with day 3 troponin. These factors all relate to the underlying illness more so than to modifiable clinical factors. Although a fluid conservative strategy reduced ventilator free days in FACTT (17), 72-hour fluid balance was not associated with trend in hsTnI in the present work. This observation is consistent with prior data that brain natriuretic peptide levels were not associated with outcome in ARDS (26). It does not appear that troponin trends are associated with fluid toxicity due to the fact that fluid balance was not associated with troponin levels in multi-variable models. Similarly, none of the ventilator variables assessed-including oxygenation, tidal volume, and plateau pressure- were associated with trend in hsTnI. Thus, progressive myocardial injury seems related more to the underlying critical illness than to modifiable treatment related factors, and future studies should assess mechanisms by which myocardial injury could be modified.
We report that progressive myocardial injury is independently associated with increased 60-day mortality and with fewer ventilator and ICU free days, even adjusting for underlying critical illness with SOFA score, vasopressor requirement, fluid balance, heart rate, and age. This independent association of hsTnI trajectories contrasts with our observation that initial hsTnI levels were associated with ARDS outcomes, but the association virtually disappeared after adjusting for underlying critical illness (8). It is likely that introducing two time points for hsTnI assessment integrates risk across day 0 to day 3 and adds an independent prognostic element beyond a single day risk score, such as SOFA score. Our findings are again consistent with those of Lazzeri and colleagues in ARDS and Masson and colleagues in severe sepsis, who both note that increasing troponin was associated with worse outcomes (12, 13). A rising troponin level could thus identify a subgroup of patients with ongoing organ injury in response to their underlying illness. This subgroup could be well suited for novel therapeutics, for enrollment in clinical trials in need of a high-risk patient pool, or for expanded diagnostics. For example, in Lazzeri and colleagues’ study, increasing troponin was associated with worse right heart function on echocardiography (12). Echocardiography to guide management of ARDS and titration of therapy to right ventricular function is attractive (5, 27–30) but its efficacy is unproven. Patients with progressive myocardial injury may be an attractive subgroup for initial right ventricular protective treatment strategies. Other attractive cardioprotective treatments in these patients could include beta blockade (31) and extracorporeal support (32, 33).
Limitations of our study include its observational design, which limits our ability to establish causal connections. Not all patients had available plasma on trial day 0 and trial day 3 and by design, our trial excluded patients who died before trial day 3 representing a form of survivor bias. Blood was only sampled on day 0 and 3, whereas clinically troponin levels can be checked more frequently. More granular information on troponin trajectories may provide additional prognostic information. The FACTT and ALVEOLI protocols did not include electrocardiography or echocardiography. Few patients in these trials received prone positioning, thus these data cannot investigate the association of prone positioning in ARDS with myocardial injury. Thus, we could not evaluate cardiac structural or electrical correlates of troponin trajectories. The mechanism of death was not ascertained in the parent trials, and troponin trajectories may have different prognostic implications in patients with cardiovascular versus non-cardiovascular deaths. The trials comprising our cohort were published in 2004 and 2006, and it is possible that patients in the present study do not reflect completely ARDS patients in the modern era. Finally, data on baseline medical therapy including beta-blockers, aspirin, and anticoagulants was not available in either parent trial and vasopressor choice and dose was not standardized in these trials but rather at clinical discretion which limits the ability to perform granular analyses of vasopressors and myocardial injury
In conclusion, progressive myocardial injury occurs in a significant number of patients with ARDS and is associated with higher 60-day mortality independent of underlying critical illness. ARDS patients with progressive myocardial injury represent a high-risk subgroup and future studies should assess the underlying pathophysiology of progressive myocardial injury and potential treatments.
Supplementary Material
Highlights.
Most patients with ARDS suffer myocardial injury detectable with a highly sensitive troponin assay, and 72% of ARDS patients with myocardial injury have declining troponin levels over 3 days
In-hospital mortality for ARDS patients increased in a dose-dependent fashion with increasing percentage change in troponin over 3 days
After multivariable adjustment participants with a 32.1% or greater increase in troponin between day 0 and day 3 had a 2.27 fold increased risk for mortality (95% CI 1.29 – 3.99, p=0.002; Table 3) as well as approximately 3.2 fewer ventilator-free and ICU-free days
Acknowledgments
Disclosures: Abbott Laboratories provided reagents and financial support for the study; the study was designed and executed solely by the study investigators without industry involvement. Dr. Sokoll received further research funding from Abbott Laboratories. Dr. Morrow reports grants to the TIMI Study Group from Abbott Laboratories, Amgen, AstraZeneca, Daiichi Sankyo, Eisai, GlaxoSmithKline, Merck, Novartis, Roche Diagnostics, Singulex and consultant fees from Abbott Laboratories, AstraZeneca, diaDexus, GlaxoSmithKline, Merck, Peloton, Roche Diagnostics, and Verseon. Dr. Metkus performs consulting unrelated to this subject matter for BestDoctors Inc and Oakstone/EBIX. Dr. Metkus received royalties for a textbook publication from McGraw-Hill publishing, unrelated to this subject matter. From 2014-2016, Dr. Metkus received salary support from NIH-NHLBI grant number T32-HL007227-40.
Footnotes
Publisher's Disclaimer: This is a PDF file of an unedited manuscript that has been accepted for publication. As a service to our customers we are providing this early version of the manuscript. The manuscript will undergo copyediting, typesetting, and review of the resulting proof before it is published in its final citable form. Please note that during the production process errors may be discovered which could affect the content, and all legal disclaimers that apply to the journal pertain.
References
- 1.Bellani G, Laffey JG, Pham T, Fan E, Brochard L, Esteban A, Gattinoni L, van Haren F, Larsson A, McAuley DF, Ranieri M, Rubenfeld G, Thompson BT, Wrigge H, Slutsky AS, Pesenti A, Investigators LS, Group ET. Epidemiology, Patterns of Care, and Mortality for Patients With Acute Respiratory Distress Syndrome in Intensive Care Units in 50 Countries. Jama 2016; 315: 788–800. [DOI] [PubMed] [Google Scholar]
- 2.Herridge MS, Tansey CM, Matte A, Tomlinson G, Diaz-Granados N, Cooper A, Guest CB, Mazer CD, Mehta S, Stewart TE, Kudlow P, Cook D, Slutsky AS, Cheung AM, Canadian Critical Care Trials G. Functional disability 5 years after acute respiratory distress syndrome. The New England journal of medicine 2011; 364: 1293–1304. [DOI] [PubMed] [Google Scholar]
- 3.Metkus TS, Tampakakis E, Mullin CJ, Houston BA, Kolb TM, Mathai SC, Damico R, Maron BA, Hassoun PM, Brower RG, Tedford RJ. Pulmonary Arterial Compliance in Acute Respiratory Distress Syndrome: Clinical Determinants and Association With Outcome From the Fluid and Catheter Treatment Trial Cohort. Critical care medicine 2017; 45: 422–429. [DOI] [PMC free article] [PubMed] [Google Scholar]
- 4.Bull TM, Clark B, McFann K, Moss M, National Institutes of Health/National Heart L, Blood Institute AN. Pulmonary vascular dysfunction is associated with poor outcomes in patients with acute lung injury. American journal of respiratory and critical care medicine 2010; 182: 1123–1128. [DOI] [PMC free article] [PubMed] [Google Scholar]
- 5.Mekontso Dessap A, Boissier F, Charron C, Begot E, Repesse X, Legras A, Brun-Buisson C, Vignon P, Vieillard-Baron A. Acute cor pulmonale during protective ventilation for acute respiratory distress syndrome: prevalence, predictors, and clinical impact. Intensive care medicine 2016; 42: 862–870. [DOI] [PubMed] [Google Scholar]
- 6.Bajwa EK, Boyce PD, Januzzi JL, Gong MN, Thompson BT, Christiani DC. Biomarker evidence of myocardial cell injury is associated with mortality in acute respiratory distress syndrome. Critical care medicine 2007; 35: 2484–2490. [DOI] [PubMed] [Google Scholar]
- 7.Lazzeri C, Bonizzoli M, Cozzolino M, Verdi C, Cianchi G, Batacchi S, Franci A, Gensini GF, Peris A. Serial measurements of troponin and echocardiography in patients with moderate-to-severe acute respiratory distress syndrome. J Crit Care 2016; 33: 132–136. [DOI] [PubMed] [Google Scholar]
- 8.Metkus TS, Guallar E, Sokoll L, Morrow D, Tomaselli G, Brower R, Schulman S, Korley FK. Prevalence and Prognostic Association of Circulating Troponin in the Acute Respiratory Distress Syndrome. Critical care medicine 2017. [DOI] [PMC free article] [PubMed] [Google Scholar]
- 9.Rivara MB, Bajwa EK, Januzzi JL, Gong MN, Thompson BT, Christiani DC. Prognostic significance of elevated cardiac troponin -T levels in acute respiratory distress syndrome patients. PloS one 2012; 7: e40515. [DOI] [PMC free article] [PubMed] [Google Scholar]
- 10.Sandoval Y, Smith SW, Apple FS. Present and Future of Cardiac Troponin in Clinical Practice: A Paradigm Shift to High-Sensitivity Assays. The American journal of medicine 2016; 129: 354–365. [DOI] [PubMed] [Google Scholar]
- 11.Vasile VC, Chai HS, Khambatta S, Afessa B, Jaffe AS. Significance of elevated cardiac troponin T levels in critically ill patients with acute respiratory disease. The American journal of medicine 2010; 123: 1049–1058. [DOI] [PubMed] [Google Scholar]
- 12.Lazzeri C, Bonizzoli M, Cozzolino M, Verdi C, Cianchi G, Batacchi S, Franci A, Gensini GF, Peris A. Serial measurements of troponin and echocardiography in patients with moderate-to-severe acute respiratory distress syndrome. J Crit Care 2016. [DOI] [PubMed] [Google Scholar]
- 13.Masson S, Caironi P, Fanizza C, Carrer S, Caricato A, Fassini P, Vago T, Romero M, Tognoni G, Gattinoni L, Latini R, Albumin Italian Outcome Sepsis Study I. Sequential N-Terminal Pro-B-Type Natriuretic Peptide and High-Sensitivity Cardiac Troponin Measurements During Albumin Replacement in Patients With Severe Sepsis or Septic Shock. Critical care medicine 2016; 44: 707–716. [DOI] [PubMed] [Google Scholar]
- 14.Ostermann M, Lo J, Toolan M, Tuddenham E, Sanderson B, Lei K, Smith J, Griffiths A, Webb I, Coutts J, Chambers J, Collins on P, Peacock J, Bennett D, Treacher D. A prospective study of the impact of serial troponin measurements on the diagnosis of myocardial infarction and hospital and six-month mortality in patients admitted to ICU with non-cardiac diagnoses. Crit Care 2014; 18: R62. [DOI] [PMC free article] [PubMed] [Google Scholar]
- 15.Brower RG, Lanken PN, MacIntyre N, Matthay MA, Morris A, Ancukiewicz M, Schoenfeld D, Thompson BT, National Heart L, Blood Institute ACTN. Higher versus lower positive end-expiratory pressures in patients with the acute respiratory distress syndrome. The New England journal of medicine 2004; 351: 327–336. [DOI] [PubMed] [Google Scholar]
- 16.National Heart L, Blood Institute Acute Respiratory Distress Syndrome Clinical Trials N, Wheeler AP, Bernard GR, Thompson BT, Schoenfeld D, Wiedemann HP, deBoisblanc B, Connors AF Jr., Hite RD, Harabin AL. Pulmonary-artery versus central venous catheter to guide treatment of acute lung injury. The New England journal of medicine 2006; 354: 2213–2224. [DOI] [PubMed] [Google Scholar]
- 17.National Heart L, Blood Institute Acute Respiratory Distress Syndrome Clinical Trials N, Wiedemann HP, Wheeler AP, Bernard GR, Thompson BT, Hayden D, deBoisblanc B, Connors AF Jr., Hite RD, Harabin AL. Comparison of two fluid-management strategies in acute lung injury. The New England journal of medicine 2006; 354: 2564–2575. [DOI] [PubMed] [Google Scholar]
- 18.Giffen CA, Carroll LE, Adams JT, Brennan SP, Coady SA, Wagner EL. Providing Contemporary Access to Historical Biospecimen Collections: Development of the NHLBI Biologic Specimen and Data Repository Information Coordinating Center (BioLINCC). Biopreservation and biobanking 2015; 13: 271–279. [DOI] [PMC free article] [PubMed] [Google Scholar]
- 19.Giffen CA, Wagner EL, Adams JT, Hitchcock DM, Welniak LA, Brennan SP, Carroll LE. Providing researchers with online acces s to NHLBI biospecimen collections: The results of the first six years of the NHLBI BioLINCC program. PloS one 2017; 12: e0178141. [DOI] [PMC free article] [PubMed] [Google Scholar]
- 20.Korley FK, Schulman SP, Sokoll LJ, DeFilippis AP, Stolbach AI, Bayram JD, Saheed MO, Omron R, Fernandez C, Lwin A, Cai SS, Post WS, Jaffe AS. Troponin elevations only detected with a high-sensitivity assay: clinical correlations and prognostic significance. Academic emergency medicine : official journal of the Society for Academic Emergency Medicine 2014; 21: 727–735. [DOI] [PubMed] [Google Scholar]
- 21.Apple FS, Ler R, Murakami MM. Determination of 19 cardiac troponin I and T assay 99th percentile values from a common presumably healthy population. Clin Chem 2012; 58: 1574–1581. [DOI] [PubMed] [Google Scholar]
- 22.Vincent JL, Moreno R, Takala J, Willatts S, De Mendonca A, Bruining H, Reinhart CK, Suter PM, Thijs LG. The SOFA (Sepsis -related Organ Failure Assessment) score to describe organ dysfunction/failure. On behalf of the Working Group on Sepsis-Related Problems of the European Society of Intensive Care Medicine. Intensive care medicine 1996; 22: 707–710. [DOI] [PubMed] [Google Scholar]
- 23.Chapman AR, Adamson PD, Mills NL. Assessment and classification of patients with myocardial injury and infarction in clinical practice. Heart 2017; 103: 10–18. [DOI] [PMC free article] [PubMed] [Google Scholar]
- 24.Thygesen K, Alpert JS, Jaffe AS, Simoons ML, Chaitman BR, White HD, Joint ESCAAHAWHFTFfUDoMI, Authors/Task Force Members C, Thygesen K, Alpert JS, White HD, Biomarker S, Jaffe AS, Katus HA, Apple FS, Lindahl B, Morrow DA, Subcommittee ECG, Chaitman BR, Clemmensen PM, Johanson P, Hod H, Imaging S, Underwood R, Bax JJ, Bonow JJ, Pinto F, Gibbons RJ, Classification S, Fox KA, Atar D, Newby LK, Galvani M, Hamm CW, Intervention S, Uretsky BF, Steg PG, Wijns W, Bassand JP, Menasche P, Ravkilde J, Trials, Registries S, Ohman EM, Antman EM, Wallentin LC, Armstrong PW, Simoons ML, Trials, Registries S, Januzzi JL, Nieminen MS, Gheorghiade M, Filippatos G, Trials, Registries S, Luepker RV, Fortmann SP, Rosamond WD, Levy D, Wood D, Trials, Registries S, Smith SC, Hu D, Lopez-Sendon JL, Robertson RM, Weaver D, Tendera M, Bove AA, Parkhomenko AN, Vasilieva EJ, Mendis S, Guidelines ESCCfP, Bax JJ, Baumgartner H, Ceconi C, Dean V, Deaton C, Fagard R, Funck-Brentano C, Hasdai D, Hoes A, Kirchhof P, Knuuti J, Kolh P, McDonagh T, Moulin C, Popescu BA, Reiner Z, Sechtem U, Sirnes PA, Tendera M, Torbicki A, Vahanian A, Windecker S, Document R, Morais J, Aguiar C, Almahmeed W, Arnar DO, Barili F, Bloch KD, Bolger AF, Botker HE, Bozkurt B, Bugiardini R, Cannon C, de Lemos J, Eberli FR, Escobar E, Hlatky M, James S, Kern KB, Moliterno DJ, Mueller C, Neskovic AN, Pieske BM, Schulman SP, Storey RF, Taubert KA, Vranckx P, Wagner DR. Third universal definition of myocardial infarction. J Am Coll Cardiol 2012; 60: 1581–1598.22958960 [Google Scholar]
- 25.Anderson JL, Morrow DA. Acute Myocardial Infarction. The New England journal of medicine 2017; 376: 2053–2064. [DOI] [PubMed] [Google Scholar]
- 26.Semler MW, Marney AM, Rice TW, Nian H, Yu C, Wheeler AP, Brown NJ, Network NNA. B-Type Natriuretic Peptide, Aldosterone, and Fluid Management in ARDS. Chest 2016; 150: 102–111. [DOI] [PMC free article] [PubMed] [Google Scholar]
- 27.Wadia SK, Shah TG, Hedstrom G, Kovach JA, Tandon R. Early detection of right ventricular dysfunction using transthoracic echocardiography in ARDS: a more objective approach. Echocardiography 2016; 33: 1874–1879. [DOI] [PubMed] [Google Scholar]
- 28.Paternot A, Repesse X, Vieillard-Baron A. Rationale and Description of Right Ventricle-Protective Ventilation in ARDS. Respir Care 2016; 61: 1391–1396. [DOI] [PubMed] [Google Scholar]
- 29.Garcia-Montilla R, Imam F, Miao M, Stinson K, Khan A, Heitner S. Optimal right heart filling pressure in acute respiratory distress syndrome determined by strain echocardiography. Echocardiography 2017; 34: 851–861. [DOI] [PubMed] [Google Scholar]
- 30.Zochios V, Parhar K, Tunnicliffe W, Roscoe A, Gao F. The Right Ventricle in ARDS. Chest 2017; 152: 181–193. [DOI] [PubMed] [Google Scholar]
- 31.Morelli A, Ertmer C, Westphal M, Rehberg S, Kampmeier T, Ligges S, Orecchioni A, D’Egidio A, D’Ippoliti F, Raffone C, Venditti M, Guarracino F, Girardis M, Tritapepe L, Pietropaoli P, Mebazaa A, Singer M. Effect of heart rate control with esmolol on hemodynamic and clinical outcomes in patients with septic shock: a randomized clinical trial. Jama 2013; 310: 1683–1691. [DOI] [PubMed] [Google Scholar]
- 32.Fan E, Brodie D, Slutsky AS. Fifty Years of Research in ARDS. Mechanical Ventilation during Extracorporeal Support for Acute Respiratory Distress Syndrome. For Now, a Necessary Evil. American journal of respiratory and critical care medicine 2017; 195: 1137–1139. [DOI] [PubMed] [Google Scholar]
- 33.Combes A, Pesenti A, Ranieri VM. Fifty Years of Research in ARDS. Is Extracorporeal Circulation the Future of Acute Respiratory Distress Syndrome Management? American journal of respiratory and critical care medicine 2017; 195: 1161–1170. [DOI] [PubMed] [Google Scholar]
Associated Data
This section collects any data citations, data availability statements, or supplementary materials included in this article.