

Abstract
Background:
High-throughput expression analyses of post-mortem brain tissue have been widely used to study bipolar disorder and schizophrenia. However, despite the extensive efforts, no consensus has emerged as to the functional interpretation of the findings. We hypothesized that incorporating information on cell type-specific expression would provide new insights.
Methods:
We re-analysed 15 publicly available bulk-tissue expression datasets on schizophrenia and bipolar disorder, representing various brain regions from eight different cohorts of subjects (unique subjects: 332 controls, 129 bipolar disorder, 341 schizophrenia). We studied changes in the expression profiles of cell type marker-genes, and evaluated whether these expression profiles could serve as surrogates for relative abundance of their corresponding cells.
Results:
In both disorders, we consistently observed an increase in the expression profiles of cortical astrocytes and a decrease in the expression profiles of fast-spiking parvalbumin interneurons. No changes in astrocyte expression profiles were observed in subcortical regions. Furthermore, we found that many of the genes previously identified as differentially expressed in schizophrenia are highly correlated with the expression profiles of astrocytes or fast-spiking parvalbumin interneurons.
Conclusions:
Our results indicate convergence of transcriptome studies of schizophrenia and bipolar disorder on changes in cortical astrocytes and fast-spiking parvalbumin interneurons, providing a unified interpretation of numerous studies. We suggest that these changes can be attributed to alterations in the relative abundance of the cells and are important for understanding the pathophysiology of the disorders.
Keywords: Gene expression, psychiatric disorders, cell types, cortex, meta-analysis, mitochondria
Introduction
Despite extensive research, a comprehensive understanding of the etiology and pathophysiology of bipolar disorder (BP) and schizophrenia (SCZ) has yet to emerge. The involvement of several biological systems and mechanisms have been proposed, including the immune system, epigenetics, and excitatory-inhibitory balance (1–10). However, the causality, the pathological impact, as well as the crosstalk between these systems remains to be resolved.
Transcriptomics analyses of post-mortem brain tissue have been widely applied in the study of both disorders. In broad strokes, the goal of these analyses is to answer two major questions: Which genes or gene modules are affected by the disease? What is their functional relevance to the disease, if any? Unfortunately, definitive answers have been elusive. The specific genes reported by individual studies rarely overlap (11, 12) even for studies based on the same cohorts of subjects (12, 13). Some level of agreement can be observed at the gene-set level using enrichment analyses based on resources such as the Gene Ontology (GO) (11, 14, 15) or cell type-specific genes (15–19) . In both disorders, downregulated transcripts were repeatedly reported to be enriched in genes related to mitochondrial function (12, 14, 17, 20–22) or being over-expressed in neurons (17–19). Yet, the interpretation of these findings has remained speculative.
In a parallel line of research, numerous studies have evaluated changes in the abundance of specific brain cell types in psychiatric patients using experimental cell counting methods (2, 23–29). As with transcriptome studies, these have yielded conflicting results. The discrepancies among the findings have been previously discussed (2, 30) and attributed to biological factors such as cohort differences, subject variability and different cortical regions analyzed, as well as technical or methodological factors, including relying on a single marker to identify the cells of interest.
It has been previously suggested that some of the transcriptional signal captured from brain tissue of psychiatric patients might represent differences in the number of cells expressing these genes rather than alterations in transcript levels within the cells (18, 31). Thus, while the question of changes in the abundance of specific cell types in psychiatric patients remains open, it would seem sensible to address potential variation in cell numbers in transcriptome studies. However, obtaining counts of cell types is technically difficult and is not available for the existing transcriptomic studies of brain tissue.
Fluctuations in cell type abundance can be directly inferred from bulk tissue transcriptomics data (32–37). These approaches have been successfully ap plied to various tissues, including the brain (35, 36, 38, 39). However, due to the scarcity of reliable markers for brain cell types, to date brain studies have been limited to a small number of relatively broad cell types such as “neurons” (34, 38, 39).
Recently, our group has extended the repertoire of cellular markers for 36 cell types brain-wide using Neuro (40) Expresso, a database of brain cell type expression profiles based on publicly available single- and pooled-cell data (40). We have further demonstrated that summarised expression of these markers (referred to as a Marker Gene Profile, MGP) can be used to infer changes in the abundance of specific cell types across samples (40). While MGPs are not direct measures of cell numbers, they have several advantages in that: 1) they are based on multiple markers for each cell type and thus are less likely to be adversely affected by artifacts or noise in individual genes, 2) They allow assessment of multiple cell types simultaneously, and 3) they provide information on relative cellular abundance in a sample, based on the same data used to evaluate its gene expression levels.
In the current work, our goal was to address two major questions: First, is there consistent evidence for alterations in the abundance of specific brain cell types in BP and SCZ subjects? Second, can alterations in cellular abundance provide a more parsimonious interpretation of previous findings based on traditional differential expression analyses? To address these questions, we re-analyzed 15 publicly available datasets, representing seven different cohorts of subjects. Our results indicate a decrease in neocortical fast spiking parvalbumin-positive interneurons (fsPV) and an increase in astrocytes, in all of the cohorts studied. In addition, we show that many genes previously reported to be differentially expressed in SCZ can be attributed to relative abundance changes in these two cell types. Our results provide a unifying interpretation for multiple transcriptomic studies, and emphasize the need for future studies to incorporate changes related to cellular composition into analysis and interpretation of their observations.
Methods and Materials
Detailed descriptions of the methods are provided in the supplement. Except where noted, analyses were conducted in R version 3.3.2 (41). Scripts and data files underlying the analyses are available through https://github.com/ltoker/CellularChangesPsychiatry .
Datasets
Table S1 contains full information on the datasets analysed. Data from Stanley Medical Research Institute (SMRI) were downloaded from https://www.stanleygenomics.org/stanley. Data for datasets GSE17806, GSE53987, GSE35978, GSE13564, GSE80655 and GSE25219 were downloaded from the Gene Expression Omnibus (GEO) https://www.ncbi.nlm.nih.gov/geo. The McLean dataset was obtained from the Harvard Brain Tissue Resource Center (http://national_databank.mclean.harvard.edu/, accessed in 2004). Information regarding the brain pH and the exact age of the samples in McLean dataset was obtained from an earlier study based on the same cohort of subjects (42).
Data pre-processing
Microarray data were pre-processed and normalized with the “rma” function of the “oligo” or “affy” R packages (43). Probeset to gene annotation s were obtained from Gemma (44) (http://gemma.msl.ubc.ca/). RNAseq data pre-processing is described in supplementary methods. The data were batch corrected using the “ComBat” function from the “sva” R package (45).
Sex-specific genes (XIST, KDM5D, RPS4Y1) were used to identify misannotated samples (46) and to define the noise threshold. Supplementary table S1 contains the number of misannotated samples and the noise threshold for each of the datasets analysed.
Estimation of marker gene profiles
The general approach for estimation of marker gene profiles was previously described (40). Briefly, marker gene-sets were obtained from NeuroExpresso via neuroexpresso.org (supplementary table S2). Human orthologues were defined using HomoloGene (ftp://ftp.ncbi.nih.gov/pub/HomoloGene/build68/homologene.data) (47). MGPs were calculated for each cell type separately, based on the corresponding marker gene-sets, using Principal component analysis (PCA) (40). To reduce the impact of outlier samples, PCA was repeated 100 times on subsampled data, containing equal number of subjects per group, and the mean score for each sample was used for downstream analyses. QC assessment of MGP analysis outcome are described in supplementary methods.
Statistical analysis of MGPs
For each dataset, a two-sided Wilcoxon rank-sum test was used to compare MGPs between diagnostic groups. Mixed-models were used to pool MGPs across the datasets. For visualization purposes, scores were normalized to the range 0–1.
Gene-MGP correlation
Spearman’s correlation between genes and MGPs of each of the cortical cell types was calculated separately for each of the datasets analysed. List of probesets with altered expression in the cortex of SCZ subjects was obtained from supplementary table 2 in Mistry et al. 2013 (11).
Developmentally regulated genes in fsPV interneurons
Data from a time course of mouse developing fsPV cells (48) was downloaded from GEO (GSE17806). The effect of age on each of the genes on the microarray platform was evaluated using linear models, treating the age of the animals as an ordered factor. Developmentally regulated genes were defined as genes selected while controlling the FDR at 0.01.
Gene expression in human brain cell types
The expression level of top genes correlated with fsPV and astrocyte MGPs in human cell types was evaluated based on single-cell expression data from Darmanis et al. (GSE67835) (40, 49). Only cells purified from adult subjects and classified as astrocytes, endothelial cells, microglia, oligodendrocytes, oligodendrocyte precursor cells (OPCs) or neurons were used.
Raw cell count data
Raw cell counts from Beasley et al. (27) were downloaded from the Stanley Neuropathology database (http://sncid.stanleyresearch.org/Data/RawData.aspx). For visualization purposes the raw values were normalized to the range 0–1.
Functional enrichment of cortical cell type transcriptomes
Mouse cell type-specific expression profiles were downloaded from the NeuroExpresso database (40). Gene signals were z-transformed and summarised at the cell type level by taking the average of all samples representing the same cell type (normalized scores). The functional role of the overexpressed genes was assessed based on GO annotations using the precision-recall method implemented in ErmineJ (50, 51).
Results
The focus of this paper is analysis of brain cell type marker-gene expression profiles (MGPs) in subjects with BP, SCZ and controls. The MGP analysis assesses coordinated changes in the expression levels of cell type-specific marker genes across samples from bulk tissue. These relative changes can be cautiously interpreted as surrogates of relative abundance of the corresponding cell types (40).
We initially analysed 13 publicly-available expression datasets from multiple brain regions, representing six independent cohorts of subjects. 11/13 datasets included samples from the neocortex (Table 1, supplementary table S1). Our key result is an increase in astrocyte and a decrease in fast-spiking parvalbumin-positive interneuron (fsPV) MGPs in neocortex of both psychiatric groups (Fig. 1–2, supplementary Fig. S3, S11–12). The changes replicated across the individual datasets, with the exception of a single dataset, indicating a decrease in astrocyte MGPs in the BP group (same discrepancy was not observed in two additional datasets from the same cohort of subjects) (Fig. 1–2). For both cell types, the effect sizes were larger in the SCZ than in BP group (median effect difference SCZ vs. BP|: Astrocytes 0.053, fsPV cells: −0.052, Fig. 1–2). We confirmed these findings with an alternative cell type profile estimation method (32) (supplementary Fig. S18–20).
Table 1.
| Dataset | Cohort | Region | Reference | Description |
|---|---|---|---|---|
| Psychiatry datasets | ||||
| GSE21138 | VBBN | DLPC (BA46) | (81) | Human bulk tissue |
| GSE53987 | ACOME | DLPC (BA46) Hippocampus Striatum |
(82) | Human bulk tissue |
| McLean | McLean66 | DLPC (BA9) | NA | Human bulk tissue |
| GSE35978 | SMRI (A+C) |
Parietal cortex, cerebellum |
(83) | Human bulk tissue |
| Study17Laeng | SMRI (A) | Hippocampus | NA | Human bulk tissue |
| Study1AltarA | SMRI (A) | DLPFC (BA46) | NA | Human bulk tissue |
| Study3Bahn | SMRI (A) | DLPFC (BA46) | (84) | Human bulk tissue |
| Study5Dobrin | SMRI (A) | DLPFC (BA46) | NA | Human bulk tissue |
| Study7Kato | SMRI (A) | DLPFC (BA46) | (21) | Human bulk tissue |
| Study16Kemether | SMRI (C) | Thalamus | NA | Human bulk tissue |
| Study2AltarC | SMRI (C) | DLPFC (BA46/BA10) |
NA | Human bulk tissue |
| Study4Chen | SMRI (C) | PFC (BA6) | NA | Human bulk tissue |
| GSE80655 | PNDRC | DLPFC | (18) | Human bulk tissue |
| PsychEncode | * | DLPFC (BA46) | NA | Human bulk tissue |
| CommonMind | * | DLPFC (BA9) | NA | Human bulk tissue |
| Development datasets | ||||
| GSE13564 | UMBB | PFC | (85) | Human bulk tissue |
| GSE25219 | DNYU | DLPFC | (86) | Human bulk tissue |
| GSE17806 | ----- | Cortical fsPV cells | (48) | Pooled mouse cells |
| Other | ||||
| GSE67835 | ----- | Cortex | (49) | Human single cell |
Datasets analyzed in the current study.
VBBN – Victorian Brain Bank Network; ACOME – Allegheny County Office of the Medical Examiner (Pittsburgh, PA); McLean66 – McLean66 coll ection, Harvard Brain Tissue Resource Center, SMRI (A) – Stanley Medical Research institute, Array collection; SMRI (C) – Stanley Medical Research institute, Consortium collection; PNDRC - Pritzker Neuropsychiatric Disorders Research Consortium; UMBB - National Child Health and Human Development Brain and Tissue Bank for Developmental Disorders at the University of Maryland; DNYU - Department of Neurobiology at Yale University School of Medicine. DLPFC – dorsolateral prefrontal cortex; PFC – prefrontal cortex. NA – un published. Reference indicates the publication that first reported the data.
Details are provided in the supplement.
Figure 1: Changes in astrocyte and fsPV MGPs are consistent across cortical datasets from six cohorts.
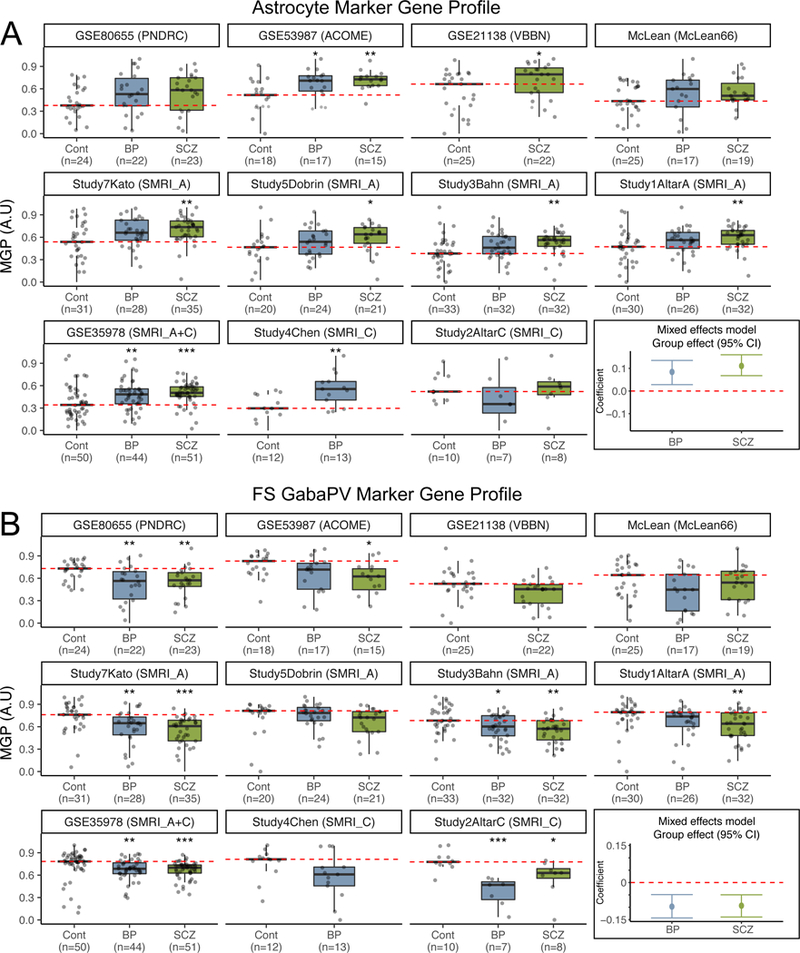
Astrocyte (A) and fsPV (B) MGPs organized by cohort, dataset and diagnostic group. Each point represents a single sample. Red dashed line indicates the median MGP in the control group. The last plot in each of A and B shows the 95% confidence intervals for the group effects based on linear mixed model analysis. * - Wilcoxon ranked sum p for comparison to controls < 0.05, ** - p < 0.01, *** - p < 0.001.
Figure 2: Summary of MGP analysis for all thirteen cell types considered.
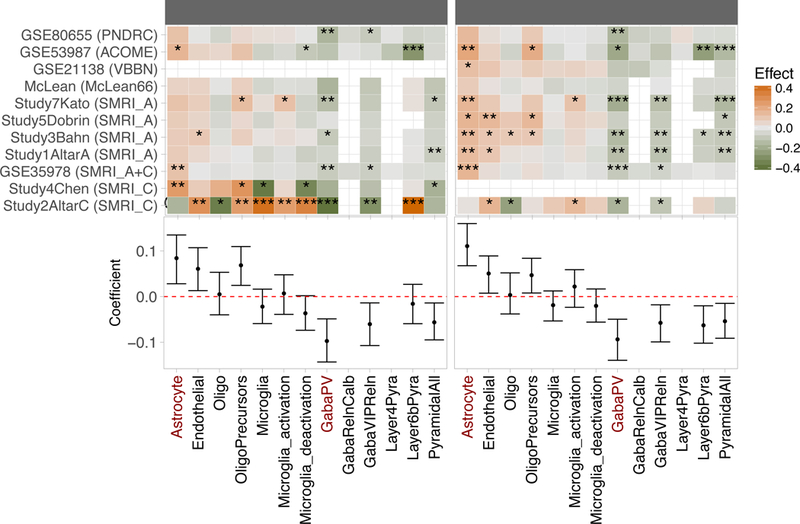
Upper panel: Heatmap summarizing shifts in MGPs estiated for each study separately based on the Wilcoxon signed ranked test as in Figure 1. Gaps indicate missing or insufficient data. Datasets and cohorts are indicated as provided in Table 1. * - Wilcoxon p < 0.05, ** - p < 0.01, - p < 0.001. Lower panel: Coefficients (95%CI) for fitted linear mixed model. Effects were not calculated for MGPs that could not be estimated for the majority of the studies. Cell types included in the analysis are indicated at the bottom of the figure. Astrocyte and fsPV MGPs are highlighted in red. OPC: Oligodendrocyte precursors; Microglia_act: Microglia_activation; Microglia_deact: Microglia_deactivation; Pyr: pyramidal cells. Refer to supplementary table S2 for detailed description of the cell types.
To assess the data in aggregate, for each neocortical cell type we performed a “mega-analysis” of all relevant datasets, by fitting a linear mixed-effects model treating subject and study as random effects, while adjusting for the effects of sex, age, PMI and pH. This analysis confirmed the dataset-specific observations, namely, increase in astrocyte MGPs [effect size (95%CI): BP: 0.08(0.04, 0.14); SCZ: 0.11(0.06, 0.15), Fig. 1] and decrease in fsPV MGPs [BP: −0.1(−0.14, - 0.05); SCZ: −0.09(−0.14, −0.05), Fig. 2]. The mega-analysis additionally suggested a reduction in total microglia MGPs in BP subjects and a change in the activation profile of these cells, in both disorders (Fig. 1–2; supplementary Fig. S3). However, these effects were not consistent across individual datasets (Fig. 2). To further assess the reproducibility of our findings, we performed MGP analysis in independent cohorts of subjects from the CommonMind and the PsychEncode Consortia (two additional data sets; supplementary data). These data corroborated our findings (see supplement).
The remainder of the paper is focused on assessing the interpretation and implication of the most consistent findings, related to fsPV and astrocyte cells.
Consistency between MGPs and cell count data
An obvious question is how well changes in MGPs correspond to changes in cell type proportions. In the case of fsPV cells, for two neocortical datasets we had access to raw cell count data based on the same cohort of subjects (27). from two Brodmann areas (BA) - BA46 and BA9. As shown in supplementary Fig. S1, there was an agreement between MGPs and cell counts both at the group and at the sample level (Spearman’s correlation: 0.33–0.56). For reference, the correlation between the two experimental cell count data sets was 0.73 (supplementary Fig. S1B). In addition, in both hippocampal datasets we observed a decrease in somatostatin positive interneuron (GabaSSTReln) MGPs, with a stronger effect observed in the SCZ group (supplementary Fig. S2A-B), corroborating experimental cell counts in two independent cohorts of subjects (52–54).
The decrease in fsPV MGPs is not likely to represent immaturity
It was previously proposed that immaturity of fsPV interneurons might be involved in the pathophysiology of both disorders (55, 56). This raises the question of whether our observed changes in the fsPV MGP reflect decreased maturation stage (associated with loss of marker expression), rather than lower cell numbers. To be consistent with a change in maturation, genes downregulated during fsPV development should be negatively correlated with the MGP, while those upregulated should be positively correlated. We first confirmed that this pattern is indeed observed in datasets representing development time-courses (Table 1, Fig. 3A-C). In contrast we found no relation between MGP and the fsPV maturation-related genes in any of our psychiatry datasets, (Fig. 3D, supplementary Fig. S5). Thus, our observation of decreased fsPV MGPs in psychiatric patients is more consistent with a change in the proportions of these cells, than a change in their maturation state.
Figure 3: Decreased fsPV MGPs in bipolar disorder and schizophrenia are not likely to represent immature state of these cells.
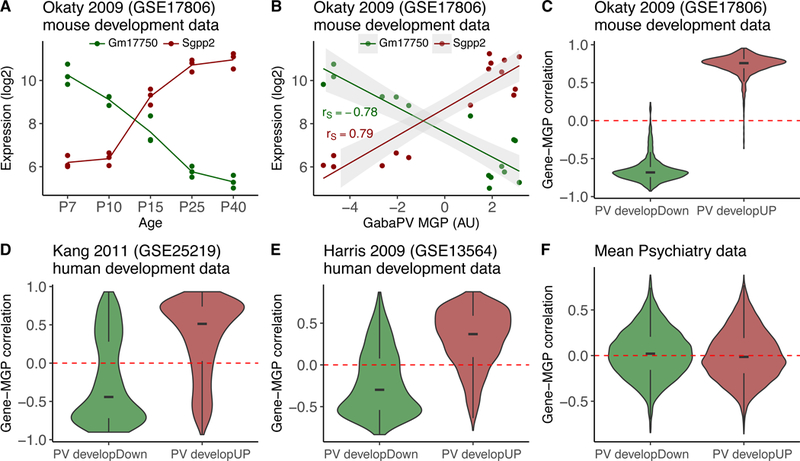
A,B Illustration of the relation between transcriptomic changes related to maturation of fsPV cells and fsPV MGP, in a mouse dataset representing different developmental stages of these cells. (A) Expression levels of Gm17750 (downregulated) and Sgpp2 (upregulated) in five developmental ages of fsPV cells. Data are from GSE178206. (B) Relation between the expression levels in A and the calculated fsPV MGP. The fsPV MGP is positively correlated with Sgpp2 and negatively correlated with Gm17750, as expected (rs: Spearman correlation). C-F Distributions of Spearman correlations with the MGP of all genes downregulated (green; PV developDown) and upregulated (red; PV developUP) during fsPV maturation; dashed red line indicates zero. C. Mouse development data (same source of data in A and B) D. Human cortex development data (prenatal week 8 – 42 years) E. Human cortex development data (ages 2–50) F. Mean Gene-MGP correlations aggregated across the psychiatry datasets analysed. Note that correlations of both up- and down-regulated genes is similarly distributes around zero. Correlation plots for individual studies are shown in supplementary figure S5.
fsPV cells exhibit enriched expression of genes related to mitochondrial function
One of the more consistent findings from SZ and BP transcriptomic studies is enrichment of mitochondria-related GO terms among the downregulated genes (12, 14, 17, 20–22). Because fsPV cells are considered especially metabolically active (57–61), we hypothesized that the expression level of mitochondria-related transcripts is specifically high in this cell type. If this is true, the decreased abundance of fsPV cells in psychiatric patients would be reflected in a decreased level of multiple mitochondria-related genes in the bulk tissue transcriptome.
We tested our hypothesis by performing enrichment analysis on the NeuroExpresso cell type transcriptomes (see supplementary methods). We observed that mitochondria-related GO terms are the only terms significantly enriched among genes overexpressed in fsPV cells (supplementary tables S5–6). GO terms related to myelination and immune response were enriched in oligodendrocyte and microglia cells, respectively, validating our approach (62) (Supplementary tables S5–6). This suggested that the reported enrichment of mitochondrial terms among the downregulated genes in SCZ and BP might be driven by a decrease in the proportion of fsPV cells. We further performed a differential expression analysis with or without inclusion of MGPs as covariates in the model, followed by enrichment analysis of the under-expressed genes (supplementary methods). Without MGP adjustment, mitochondria-related terms were highly enriched among the down-regulated genes in both disorders (Fig. 5A, supplementary data files 2–3). In contrast, none of the mitochondria-related GO terms was enriched after adjusting for MGPs (supplementary Fig. S21, supplementary data file 4).
Increase in Astrocyte MGPs in bipolar disorder and schizophrenia is region specific
We analyzed samples from subcortical regions to examine the cortex specificity of our findings. Out of the five subcortical datasets analyzed (Table 1), an increase in the astrocyte MGP was only observed in thalamic samples (supplementary Fig. S6). This region specificity was observed both for MGPs of region-specific astrocyte marker genes and MGPs of cortical astrocyte marker genes (see Methods, supplementary Fig. S6).
A majority of genes differentially expressed in cortical samples of schizophrenic subjects are correlated with astrocyte or fsPV MGPs.
A final question we wished to address was whether our previously reported changes in expression in SCZ (11) were consistent with our new findings. In Mistry et al. (2013), we used a meta-analysis approach to identify genes differentially expressed in SCZ. Using the cell type-specific expression resources available at the time, we had identified a possible downregulation of neuron-associated genes (11) and in a follow-up report, subtle effects on the coexpression of astrocyte-associated genes (17). Here we consider whether MGP analysis can provide a more complete explanation of these earlier observations. In particular, we hypothesised that changes in the expression of some of the genes reported in Mistry et al. (11) might be better explained by changes in cellular abundance as opposed to global regulatory changes.
To test this hypothesis, we assessed the correlation between genes identified in Mistry et al. with the astrocyte and fsPV MGPs calculated here. We made use of the idea that expression of genes that are enriched in specific cell-types should be correlated with their respective MGPs. For example, expression of PVALB, a marker of fsPV cells should be highly correlated with fSPV MGP (Fig. 4A). Similar relation can be expected for genes that for various reasons were not considered as markers in our analysis, but are enriched in these cells (see Methods and supplementary Fig. S7-S9). As hypothesised, the vast majority of genes over-expressed in Mistry et al. (11) were positively correlated with astrocyte MGPs, while most of the under-expressed genes were positively correlated with fsPV MGPs (Fig. 4F-D, supplementary Fig. S12-S13).
Figure 4: Genes with altered expression in a schizophrenia meta-analysis are highly correlated with astrocyte and fsPV MGPs.
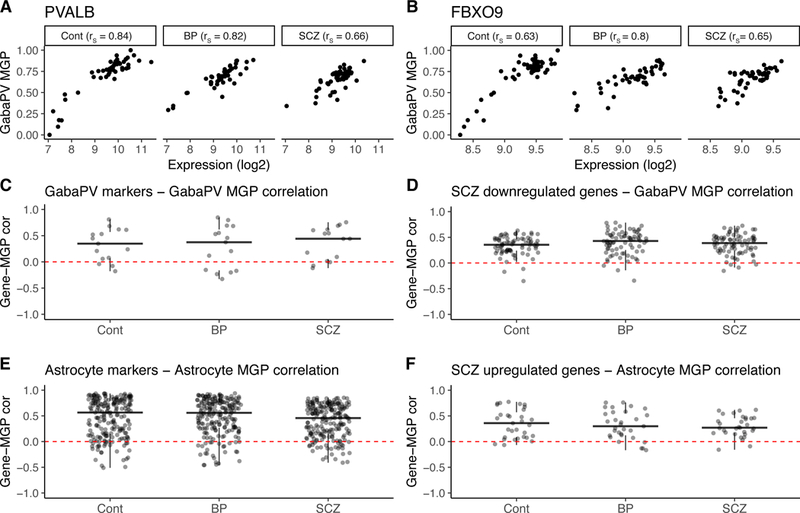
A,B. Examples of relations between expression level of individual genes and fsPV MGPs in a representative dataset (GSE35978). (A) Relation between the expression level of PVALB, a marker of fsPV cells included in MGP calculation and MGP of these cells. As expected, the two measurements are strongly correlated (B) A similar relation is observed for FBXO9, a gene reported by Mistry et al. (11) as downregulated in SCZ (B). rs – Spearman correlation. C-F Correlation of all fsPV and astrocyte markers (C, E) or genes reported in Mistry et al. (D, F) with fsPV (C, D) or astrocyte (E, F) MGPs. Each point represents a single gene. Genes above the red dashed line (indicating zero correlation value) are positively correlated with the MGP indicated on the y axis label. Correlations were calculated for each dataset separately; values plotted are means across the 10 cortical datasets analysed in the current study. Data for each study are shown in supplementary figures S12, S13.
Discussion
Our main contribution in this paper is a synthesis of many years of study of transcriptomes in the brains of individuals with SCZ and BD in terms of cell type-specific effects. We suggest that the most prominent transcriptomic effects observed from neocortical samples of these subjects can be understood as being driven by changes in two cell types (fsPV interneurons and astrocytes), most readily explained by changes in their abundance (decrease and increase, respectively). Our results replicate in numerous datasets representing eight different cohorts of subjects. The robustness of our findings is particularly striking given that these datasets have been extensively analysed in previous studies, with little consensus found among differentially expressed genes. Our analysis also indicates that the changes in astrocyte MGPs are region specific, as they were not observed in datasets from hippocampus, striatum and cerebellum of the same subjects.
It is important to note that alterations in these cell types have been previously suggested based on transcriptomic (17, 18) and non-transcriptomic (24 26, 63, 64) data. However, these reports have been accompanied by numerous other findings and claims, partially fed by the apparent inconsistency of the results. We now make a stronger claim: there is a clear transcriptomic signal indicating cell type-specific changes in SCZ and BD, weakening the alternative interpretations such as a general down-regulation of mitochondrial-associated genes or immaturity of interneurons. This is not to say that there are no caveats to our study, nor a lack of room for additional phenomena to be occurring in these disorders, and our discussion attempts to address some of these.
We stress that MGPs are not calibrated against cellular abundance, and thus should not be directly translated to changes in cellular counts (i.e., a 50% decrease in an MGP is not equivalent to 50% reduction in the number of the corresponding cells). Considering the small changes in expression at the gene level (fold change < 1.5) it is clear that any change in proportions must be fairly small. Indeed, the changes reported from experimental cell counts in (26) and (27) are ~33% and 18%, respectively.
MGPs as surrogates for cellular abundance
The idea that levels of cell type-specific marker genes can be used to infer cellular abundance in bulk samples has been used by numerous studies (32, 35, 38), but it is obviously an indirect measure and could be questioned. We feel it is the most likely explanation for several reasons. First, there is no doubt that transcriptomes in bulk tissue change can reflect cell type proportions; this has been validated extensively by ourselves and others. This does not prove that such changes are present in any particular case, but there are reasons to favour this explanation in our study on the grounds of parsimony. For example, the genes most correlated with astrocyte and fsPV MGPs in our study are highly enriched in human astrocytes and neurons, respectively (supplementary Fig S7-S9). This indicates that MGPs are representing not just the behavior of the selected marker genes, but rather of all genes highly expressed in these cell types. Second, multiple effects observed in our analysis at the MGP level corroborate previous studies:
Cell type-specific effects of age and sex identified in our analysis (supplementary Fig. S4, supplementary table S3) corroborate findings from previous experimental and computational studies (supplementary table S3).
The decrease in fsPV MGPs corroborate cell count studies based on the same cohort of subjects and similar cortical brain region (26, 27).
The decrease in hippocampal SST interneuron MGPs corroborate cell counts studies based on different cohorts of subjects.
While in our opinion cell type proportions are the most likely explanation for our findings, we cannot rule out the scenario in which numerous marker genes are coordinately dysregulated, changing the identity phenotype of the cell. Thus, a more conservative interpretation of MGP changes might be a change in the “functional abundance” of these cells.
Integration with previous findings
As mentioned, our findings are in agreement with reports of alterations in fsPV cells (3, 26, 60) in BP and SCZ. Of note, despite the reports of alterations in fsPV cells in psychiatric disorders, the nature of these alterations remains unclear. It was previously argued that reduced PV immunoreactivity in SCZ indicates reduced expression of the protein rather cellular loss (28). However, a microarray study of isolated fsPV cells did not identify changes in the expression level of parvalbumin or any other marker of these cells in SCZ (65). Rather, the authors reported enrichment in apoptosis- and cell-cycle-related pathways, suggesting that at least in some subjects cellular loss might be occurring (65).
Our observation of enrichment in mitochondria-related GO terms among genes overexpressed in fsPV cells is in line with the high metabolic demand of these cells, making them particularly vulnerable to impairments in mitochondrial respiration (57–61, 66). Interestingly, one of the most consistent observations in BD and SCZ are signs of mitochondrial dysfunction, linked to oxidative stress (3, 60, 63, 67–72), providing a plausible etiology for the observed impairment in fsPV circuits. While this observation is supported by numerous direct measurements such as mitochondrial morphology, metabolites and oxidative stress markers, the term “mitochondrial dysfunction” has also been used to describe the observed downregulation of mitochondria related genes in bulk tissue transcriptomics (discussed in (73)). We note that while oxidative stress and mitochondrial dysfunction are related (namely, oxidative stress can result in damaged mitochondria and aberrant mitochondrial function can induce oxidative stress) (74) to our knowledge direct experimental evidence for oxidative stress-induced downregulation of mitochondrial genes is lacking. Thus, our suggestion that the observed downregulation of mitochondria-related genes is a readout of a decrease in fsPV cells does not contradict studies indicating involvement of oxidative stress and mitochondrial dysfunction in psychiatric disorders. Instead, we are suggesting that the bulk tissue transcriptome is not a clear source of evidence for mitochondrial dysfunction or oxidative stress.
Our findings of increased astrocyte MGPs are in line with some but not all experimental studies of astrocyte marker levels and cell counts (2, 23, 67, 75, 76). We note that many of the studies conflicting with our findings are based on the same single cohort of subjects – the Stanley Consortium cohort (for example (67, 75, 77, 78)) , for which both decreased and increased levels of the astrocyte marker GFAP were reported in different Brodmann areas of BP and SCZ subjects (79). This cohort is represented by three datasets in our analysis (Table 1). Of these three datasets, Study2AltarC is an outlier, exhibiting changes in multiple MGPs, and showing a trend for decreased astrocyte MGP (Fig. 2). While multiple reasons were previously suggested to explain the conflicting results (2, 30), one possibility is that changes in astrocytes are region specific.
Implication of alterations in fsPV and astrocyte MGPs
Our results indicate an emerging consensus pointing to effects specific to cortical fsPV cells and astrocytes in SZ and BP. Therefore, we advise that these cell type-specific changes be carefully considered in future studies. Our results also emphasize the need to move from bulk tissue analyses to targeted analyses of specific cell types in order to unequivocally differentiate between alterations taking place at the tissue level (such as changes in cell type proportions) and alterations occurring inside individual cells.
While we provide a revised and unified interpretation for transcriptomic changes previously reported from BP and SCZ subjects, the clinical implication of our findings remains unclear. First, it remains to be determined whether these are mere consequences of the disorders (e.g. due to medication or lifestyle), rather than factors directly involved in their pathophysiology. Next, the considerable overlaps in the calculated MGPs between controls and affected individuals as well as the overlap between BB and SCZ suggest that alterations in these cells represent endophenotypes shared between subgroups of BP and SCZ subjects, rather than disease-specific phenotypes. Finally, endophenotypes do not necessarily mediate between the disease etiology and phenotype (80) and thus, it is important to differentiate whether alterations in astrocytes and fsPV cells are mediators or biomarkers of BP and SCZ pathology.
Supplementary Material
Acknowledgments
We thank Manuel Belmadani for the pre-processing of RNAseq data and Dr. Galila Agam, Dr. Nikolaus Fortelny, Dr. Sanja Rogic and Fangwen Zhao for their helpful comments on the manuscript. This work was supported by, the UBC bioinformatics graduate training program (BOM), a CIHR post-doctoral fellowship to SJT, NIH grants MH111099 and GM076990 to PP, a NeuroDevNet grant to PP and an NSERC Discovery Grant to PP.
The CommonMind data were generated as part of the CommonMind Consortium supported by funding from Takeda Pharmaceuticals Company Limited, F. Hoffman-La Roche Ltd and NIH grants R01MH085542, R01MH093725, P50MH066392, P50MH080405, R01MH097276, RO1-MH075916, P50M096891, P50MH084053S1, R37MH057881 and R37MH057881S1, HHSN271201300031C, AG02219, AG05138 and MH06692. Brain tissue for the study was obtained from the following brain bank collections: the Mount Sinai NIH Brain and Tissue Repository, the University of Pennsylvania Alzheimer’s Disease Core Center, the University of Pittsburgh NeuroBioBank and Brain and Tissue Repositories and the NIMH Human Brain Collection Core. CMC Leadership: Pamela Sklar, Joseph Buxbaum (Icahn School of Medicine at Mount Sinai), Bernie Devlin, David Lewis (University of Pittsburgh), Raquel Gur, Chang-Gyu Hahn (University of Pennsylvania), Keisuke Hirai, Hiroyoshi Toyoshiba (Takeda Pharmaceuticals Company Limited), Enrico Domenici, Laurent Essioux (F. Hoffman-La Roche Ltd), Lara Mangravite, Mette Peters (Sage Bionetworks), Thomas Lehner, Barbara Lipska (NIMH).
The PsychEncode data were generated as part of the PsychENCODE Consortium, supported by: U01MH103339, U01MH103365, U01MH103392, U01MH103340, U01MH103346, R01MH105472, R01MH094714, R01MH105898, R21MH102791, R21MH105881, R21MH103877, and P50MH106934 awarded to: Schahram Akbarian (Icahn School of Medicine at Mount Sinai), Gregory Crawford (Duke), Stella Dracheva (Icahn School of Medicine at Mount Sinai), Peggy Farnham (USC), Mark Gerstein (Yale), Daniel Geschwind (UCLA), Thomas M. Hyde (LIBD), Andrew Jaffe (LIBD), James A. Knowles (USC), Chunyu Liu (UIC), Dalila Pinto (Icahn School of Medicine at Mount Sinai), Nenad Sestan (Yale), Pamela Sklar (Icahn School of Medicine at Mount Sinai), Matthew State (UCSF), Patrick Sullivan (UNC), Flora Vaccarino (Yale), Sherman Weissman (Yale), Kevin White (UChicago) and Peter Zandi (JHU).
Footnotes
Publisher's Disclaimer: This is a PDF file of an unedited manuscript that has been accepted for publication. As a service to our customers we are providing this early version of the manuscript. The manuscript will undergo copyediting, typesetting, and review of the resulting proof before it is published in its final citable form. Please note that during the production process errors may be discovered which could affect the content, and all legal disclaimers that apply to the journal pertain.
Financial Disclosures
All authors report no biomedical financial interests or potential conflicts of interest.
References
- 1.Scaini G, Rezin GT, Carvalho AF, Streck EL, Berk M, Quevedo J (2016): Mitochondrial dysfunction in bipolar disorder: Evidence, pathophysiology and translational implications. Neurosci Biobehav Rev 68: 694–713. [DOI] [PubMed] [Google Scholar]
- 2.Trépanier MO, Hopperton KE, Mizrahi R, Mechawar N, Bazinet RP (2016): Postmortem evidence of cerebral inflammation in schizophrenia: a systematic review. Mol Psychiatry 21: 1009–1026. [DOI] [PMC free article] [PubMed] [Google Scholar]
- 3.Sullivan EM, O’Donnell P (2012): Inhibitory interneurons, oxidative stress, and schizophrenia. Schizophr Bull 38: 373–376. [DOI] [PMC free article] [PubMed] [Google Scholar]
- 4.Krystal JH, Anticevic A, Yang GJ, Dragoi G, Driesen NR, Wang X-J, Murray JD (2017): Impaired Tuning of Neural Ensembles and the Pathophysiology of Schizophrenia: A Translational and Computational Neuroscience Perspective. Biol Psychiatry, Cortical Excitation-Inhibition Balance and Dysfunction in Psychiatric Disorders 81: 874–885. [DOI] [PMC free article] [PubMed] [Google Scholar]
- 5.Rosenblat JD, Cha DS, Mansur RB, McIntyre RS (2014): Inflamed moods: A review of the interactions between inflammation and mood disorders. Prog Neuropsychopharmacol Biol Psychiatry 53: 23–34. [DOI] [PubMed] [Google Scholar]
- 6.Melo MCA, Abreu RLC, Linhares Neto VB, de Bruin PFC, de Bruin VMS (2017): Chronotype and circadian rhythm in bipolar disorder: A systematic review. Sleep Med Rev 34: 46–58. [DOI] [PubMed] [Google Scholar]
- 7.Steullet P, Cabungcal JH, Monin A, Dwir D, O’Donnell P, Cuenod M, Do KQ (2016): Redox dysregulation, neuroinflammation, and NMDA receptor hypofunction: A “central hub” in schizophrenia pathophysiology? Schizophr Res, Oxidative Stress and Inflammation in Schizophrenia 176: 41–51. [DOI] [PMC free article] [PubMed] [Google Scholar]
- 8.Grace AA (2016): Dysregulation of the dopamine system in the pathophysiology of schizophrenia and depression. Nat Rev Neurosci 17: 524–532. [DOI] [PMC free article] [PubMed] [Google Scholar]
- 9.Fries GR, Li Q, McAlpin B, Rein T, Walss-Bass C, Soares JC, Quevedo J (2016): The role of DNA methylation in the pathophysiology and treatment of bipolar disorder. Neurosci Biobehav Rev 68: 474–488. [DOI] [PMC free article] [PubMed] [Google Scholar]
- 10.Pries L-K, Gülöksüz S, Kenis G (2017): DNA Methsylation in Schizophrenia. Neuroepigenomics Aging Dis, Advances in Experimental Medicine and Biology Springer, Cham, pp 211–236. [DOI] [PubMed] [Google Scholar]
- 11.Mistry M, Gillis J, Pavlidis P (2013): Genome-wide expression profiling of schizophrenia using a large combined cohort. Mol Psychiatry 18: 215–225. [DOI] [PMC free article] [PubMed] [Google Scholar]
- 12.Elashoff M, Higgs BW, Yolken RH, Knable MB, Weis S, Webster MJ, et al. (2007): Meta-analysis of 12 genomic studies in bipolar disorder. J Mol Neurosci MN 31: 221–243. [DOI] [PubMed] [Google Scholar]
- 13.Seifuddin F, Pirooznia M, Judy JT, Goes FS, Potash JB, Zandi PP (2013): Systematic review of genome-wide gene expression studies of bipolar disorder. BMC Psychiatry 13: 213. [DOI] [PMC free article] [PubMed] [Google Scholar]
- 14.Konradi C, Eaton M, MacDonald ML, Walsh J, Benes FM, Heckers S (2004): Molecular evidence for mitochondrial dysfunction in bipolar disorder. Arch Gen Psychiatry 61: 300–308. [DOI] [PubMed] [Google Scholar]
- 15.Torkamani A, Dean B, Schork NJ, Thomas EA (2010): Coexpression network analysis of neural tissue reveals perturbations in developmental processes in schizophrenia. Genome Res 20: 403–412. [DOI] [PMC free article] [PubMed] [Google Scholar]
- 16.Skene NG, Grant SGN (2016): Identification of Vulnerable Cell Types in Major Brain Disorders Using Single Cell Transcriptomes and Expression Weighted Cell Type Enrichment. Neurogenomics 16. [DOI] [PMC free article] [PubMed] [Google Scholar]
- 17.Mistry M, Gillis J, Pavlidis P (2013): Meta-analysis of gene coexpression networks in the post-mortem prefrontal cortex of patients with schizophrenia and unaffected controls. BMC Neurosci 14: 105. [DOI] [PMC free article] [PubMed] [Google Scholar]
- 18.Ramaker RC, Bowling KM, Lasseigne BN, Hagenauer MH, Hardigan AA, Davis NS, et al. (2017): Post-mortem molecular profiling of three psychiatric disorders. Genome Med 9: 72. [DOI] [PMC free article] [PubMed] [Google Scholar]
- 19.Darby MM, Yolken RH, Sabunciyan S (2016): Consistently altered expression of gene sets in postmortem brains of individuals with major psychiatric disorders. Transl Psychiatry 6: e890. [DOI] [PMC free article] [PubMed] [Google Scholar]
- 20.Sun X, Wang J-F, Tseng M, Young LT (2006): Downregulation in components of the mitochondrial electron transport chain in the postmortem frontal cortex of subjects with bipolar disorder. J Psychiatry Neurosci JPN 31: 189–196. [PMC free article] [PubMed] [Google Scholar]
- 21.Iwamoto K, Bundo M, Kato T (2005): Altered expression of mitochondria-related genes in postmortem brains of patients with bipolar disorder or schizophrenia, as revealed by large-scale DNA microarray analysis. Hum Mol Genet 14: 241–253. [DOI] [PubMed] [Google Scholar]
- 22.Shao L, Martin MV, Watson SJ, Schatzberg A, Akil H, Myers RM, et al. (2008): Mitochondrial involvement in psychiatric disorders. Ann Med 40: 281–295. [DOI] [PMC free article] [PubMed] [Google Scholar]
- 23.Cotter DR, Pariante CM, Everall IP (2001): Glial cell abnormalities in major psychiatric disorders: the evidence and implications. Brain Res Bull 55: 585–595. [DOI] [PubMed] [Google Scholar]
- 24.Catts VS, Wong J, Fillman SG, Fung SJ, Weickert CS (2014): Increased expression of astrocyte markers in schizophrenia: Association with neuroinflammation. Aust N Z J Psychiatry 0004867414531078. [DOI] [PubMed]
- 25.Bitanihirwe BK, Lim MP, Woo T-UW (2010): N-methyl-D-aspartate receptor expression in parvalbumin-containing inhibitory neurons in the prefrontal cortex in bipolar disorder. Bipolar Disord 12: 95–101. [DOI] [PMC free article] [PubMed] [Google Scholar]
- 26.Beasley CL, Reynolds GP (1997): Parvalbumin-immunoreactive neurons are reduced in the prefrontal cortex of schizophrenics. Schizophr Res 24: 349–355. [DOI] [PubMed] [Google Scholar]
- 27.Beasley CL, Zhang ZJ, Patten I, Reynolds GP (2002): Selective deficits in prefrontal cortical GABAergic neurons in schizophrenia defined by the presence of calcium-binding proteins. Biol Psychiatry 52: 708–715. [DOI] [PubMed] [Google Scholar]
- 28.Enwright JF, Sanapala S, Foglio A, Berry R, Fish KN, Lewis DA (2016): Reduced Labeling of Parvalbumin Neurons and Perineuronal Nets in the Dorsolateral Prefrontal Cortex of Subjects with Schizophrenia. Neuropsychopharmacology 41: 2206–2214. [DOI] [PMC free article] [PubMed] [Google Scholar]
- 29.Bakhshi K, Chance SA (2015): The neuropathology of schizophrenia: A selective review of past studies and emerging themes in brain structure and cytoarchitecture. Neuroscience 82–102. [DOI] [PubMed]
- 30.Schnieder TP, Dwork AJ (2011): Searching for Neuropathology: Gliosis in Schizophrenia. Biol Psychiatry, Postmortem Studies of Psychosis: Status, Opportunities, and Challenges 69: 134–139. [DOI] [PMC free article] [PubMed] [Google Scholar]
- 31.Konradi C, Sillivan SE, Clay HB (2012): Mitochondria, oligodendrocytes and inflammation in bipolar disorder: evidence from transcriptome studies points to intriguing parallels with multiple sclerosis. Neurobiol Dis 45: 37–47. [DOI] [PMC free article] [PubMed] [Google Scholar]
- 32.Chikina M, Zaslavsky E, Sealfon SC (2015): CellCODE: A robust latent variable approach to differential expression analysis for heterogeneous cell populations. Bioinformatics btv015. [DOI] [PMC free article] [PubMed]
- 33.Westra H-J, Arends D, Esko T, Peters MJ, Schurmann C, Schramm K, et al. (2015): Cell Specific eQTL Analysis without Sorting Cells. PLoS Genet 11: e1005223. [DOI] [PMC free article] [PubMed] [Google Scholar]
- 34.Kuhn A, Thu D, Waldvogel HJ, Faull RLM, Luthi-Carter R (2011): Population-specific expression analysis (PSEA) reveals molecular changes in diseased brain. Nat Methods 8: 945–947. [DOI] [PubMed] [Google Scholar]
- 35.Newman AM, Liu CL, Green MR, Gentles AJ, Feng W, Xu Y, et al. (2015): Robust enumeration of cell subsets from tissue expression profiles. Nat Methods advance online publication. doi: 10.1038/nmeth.3337. [DOI] [PMC free article] [PubMed] [Google Scholar]
- 36.Zuckerman NS, Noam Y, Goldsmith AJ, Lee PP (2013): A Self-Directed Method for Cell-Type Identification and Separation of Gene Expression Microarrays. PLoS Comput Biol 9:e1003189. [DOI] [PMC free article] [PubMed] [Google Scholar]
- 37.Oldham MC, Konopka G, Iwamoto K, Langfelder P, Kato T, Horvath S, Geschwind DH (2008): Functional organization of the transcriptome in human brain. Nat Neurosci 11: 1271–1282. [DOI] [PMC free article] [PubMed] [Google Scholar]
- 38.Lin L, Park JW, Ramachandran S, Zhang Y, Tseng Y-T, Shen S, et al. (2016): Transcriptome sequencing reveals aberrant alternative splicing in Huntington’s disease. Hum Mol Genet 25:3454–3466. [DOI] [PMC free article] [PubMed] [Google Scholar]
- 39.van de Lagemaat LN, Nijhof B, Bosch DGM, Kohansal-Nodehi M, Keerthikumar S, Heimel JA (2014): Age-related decreased inhibitory vs. excitatory gene expression in the adult autistic brain. Front Neurosci 8. doi: 10.3389/fnins.2014.00394. [DOI] [PMC free article] [PubMed] [Google Scholar]
- 40.Mancarci BO, Toker L, Tripathy SJ, Li B, Rocco B, Sibille E, Pavlidis P (2017): Cross-Laboratory Analysis of Brain Cell Type Transcriptomes with Applications to Interpretation of Bulk Tissue Data. eNeuro ENEURO.0212–17.2017. [DOI] [PMC free article] [PubMed]
- 41.R Core Team (2015): R: The R Project for Statistical Computing. R Proj Stat Comput Retrieved February 5, 2016, from https://www.r-project.org/.
- 42.Veldic M, Guidotti A, Maloku E, Davis JM, Costa E (2005): In psychosis, cortical interneurons overexpress DNA-methyltransferase 1. Proc Natl Acad Sci U S A 102: 2152–2157. [DOI] [PMC free article] [PubMed] [Google Scholar]
- 43.Carvalho BS, Irizarry RA (2010): A framework for oligonucleotide microarray preprocessing. Bioinforma Oxf Engl 26: 2363–2367. [DOI] [PMC free article] [PubMed] [Google Scholar]
- 44.Zoubarev A, Hamer KM, Keshav KD, McCarthy EL, Santos JRC, Van Rossum T, et al. (2012): Gemma: a resource for the reuse, sharing and meta-analysis of expression profiling data. Bioinforma Oxf Engl 28: 2272–2273. [DOI] [PMC free article] [PubMed] [Google Scholar]
- 45.Leek JT, Johnson WE, Parker HS, Jaffe AE, Storey JD (2012): The sva package for removing batch effects and other unwanted variation in high-throughput experiments. Bioinforma Oxf Engl 28: 882–883. [DOI] [PMC free article] [PubMed] [Google Scholar]
- 46.Toker L, Feng M, Pavlidis P (2016): Whose sample is it anyway? Widespread misannotation of samples in transcriptomics studies. F1000Research 5. doi: 10.12688/f1000research.9471.2. [DOI] [PMC free article] [PubMed] [Google Scholar]
- 47.NCBI Resource Coordinators (2017): Database Resources of the National Center for Biotechnology Information. Nucleic Acids Res 45: D12–D17. [DOI] [PMC free article] [PubMed] [Google Scholar]
- 48.Okaty BW, Miller MN, Sugino K, Hempel CM, Nelson SB (2009): Transcriptional and electrophysiological maturation of neocortical fast-spiking GABAergic interneurons. J Neurosci Off J Soc Neurosci 29: 7040–7052. [DOI] [PMC free article] [PubMed] [Google Scholar]
- 49.Darmanis S, Sloan SA, Zhang Y, Enge M, Caneda C, Shuer LM, et al. (2015): A survey of human brain transcriptome diversity at the single cell level. Proc Natl Acad Sci 201507125. [DOI] [PMC free article] [PubMed]
- 50.Lee HK, Braynen W, Keshav K, Pavlidis P (2005): ErmineJ: tool for functional analysis of gene expression data sets. BMC Bioinformatics 6: 269. [DOI] [PMC free article] [PubMed] [Google Scholar]
- 51.Gillis J, Mistry M, Pavlidis P (2010): Gene function analysis in complex data sets using ErmineJ. Nat Protoc 5: 1148–1159. [DOI] [PubMed] [Google Scholar]
- 52.Fatemi SH, Earle JA, McMenomy T (2000): Reduction in Reelin immunoreactivity in hippocampus of subjects with schizophrenia, bipolar disorder and major depression. Mol Psychiatry 5: 654–663, 571. [DOI] [PubMed] [Google Scholar]
- 53.Konradi C, Yang CK, Zimmerman EI, Lohmann KM, Gresch P, Pantazopoulos H, et al. (2011): Hippocampal interneurons are abnormal in schizophrenia. Schizophr Res 131: 165–173. [DOI] [PMC free article] [PubMed] [Google Scholar]
- 54.Konradi C, Zimmerman EI, Yang CK, Lohmann KM, Gresch P, Pantazopoulos H, et al. (2011): Hippocampal interneurons in bipolar disorder. Arch Gen Psychiatry 68: 340– 350. [DOI] [PMC free article] [PubMed] [Google Scholar]
- 55.Gandal MJ, Nesbitt AM, McCurdy RM, Alter MD (2012): Measuring the Maturity of the Fast-Spiking Interneuron Transcriptional Program in Autism, Schizophrenia, and Bipolar Disorder. PLoS ONE 7: e41215. [DOI] [PMC free article] [PubMed] [Google Scholar]
- 56.Hagihara H, Ohira K, Takao K, Miyakawa T (2014): Transcriptomic evidence for immaturity of the prefrontal cortex in patients with schizophrenia. Mol Brain 7: 41. [DOI] [PMC free article] [PubMed] [Google Scholar]
- 57.Cabungcal J-H, Steullet P, Kraftsik R, Cuenod M, Do KQ (2013): Early-life insults impair parvalbumin interneurons via oxidative stress: reversal by N-acetylcysteine. Biol Psychiatry 73: 574–582. [DOI] [PubMed] [Google Scholar]
- 58.Cabungcal J-H, Steullet P, Morishita H, Kraftsik R, Cuenod M, Hensch TK, Do KQ (2013): Perineuronal nets protect fast-spiking interneurons against oxidative stress. Proc Natl Acad Sci U S A 110: 9130–9135. [DOI] [PMC free article] [PubMed] [Google Scholar]
- 59.Hasenstaub A, Otte S, Callaway E, Sejnowski TJ (2010): Metabolic cost as a unifying principle governing neuronal biophysics. Proc Natl Acad Sci U S A 107: 12329–12334. [DOI] [PMC free article] [PubMed] [Google Scholar]
- 60.Jiang Z, Cowell RM, Nakazawa K (2013): Convergence of genetic and environmental factors on parvalbumin-positive interneurons in schizophrenia. Front Behav Neurosci 7. doi: 10.3389/fnbeh.2013.00116. [DOI] [PMC free article] [PubMed] [Google Scholar]
- 61.Powell SB, Sejnowski TJ, Behrens MM (2012): Behavioral and neurochemical consequences of cortical oxidative stress on parvalbumin-interneuron maturation in rodent models of schizophrenia. Neuropharmacology 62: 1322–1331. [DOI] [PMC free article] [PubMed] [Google Scholar]
- 62.Jäkel S, Dimou L (2017): Glial Cells and Their Function in the Adult Brain: A Journey through the History of Their Ablation. Front Cell Neurosci 11. doi: 10.3389/fncel.2017.00024. [DOI] [PMC free article] [PubMed] [Google Scholar]
- 63.Lewis DA, Curley AA, Glausier JR, Volk DW (2012): Cortical parvalbumin interneurons and cognitive dysfunction in schizophrenia. Trends Neurosci, Special Issue: Neuropsychiatric Disorders 35: 57–67. [DOI] [PMC free article] [PubMed] [Google Scholar]
- 64.Hashimoto T, Volk DW, Eggan SM, Mirnics K, Pierri JN, Sun Z, et al. (2003): Gene expression deficits in a subclass of GABA neurons in the prefrontal cortex of subjects with schizophrenia. J Neurosci Off J Soc Neurosci 23: 6315–6326. [DOI] [PMC free article] [PubMed] [Google Scholar]
- 65.Pietersen CY, Mauney SA, Kim SS, Passeri E, Lim MP, Rooney RJ, et al. (2014): Molecular Profiles of Parvalbumin-Immunoreactive Neurons in the Superior Temporal Cortex in Schizophrenia. J Neurogenet 28: 70–85. [DOI] [PMC free article] [PubMed] [Google Scholar]
- 66.Steullet P, Cabungcal J-H, Coyle J, Didriksen M, Gill K, Grace AA, et al. (2017): Oxidative stress-driven parvalbumin interneuron impairment as a common mechanism in models of schizophrenia. Mol Psychiatry 22: 936–943. [DOI] [PMC free article] [PubMed] [Google Scholar]
- 67.Prabakaran S, Swatton JE, Ryan MM, Huffaker SJ, Huang JT-J, Griffin JL, et al. (2004): Mitochondrial dysfunction in schizophrenia: evidence for compromised brain metabolism and oxidative stress. Mol Psychiatry 9: 684–697, 643. [DOI] [PubMed] [Google Scholar]
- 68.Salim S (2014): Oxidative stress and psychological disorders. Curr Neuropharmacol 12: 140–147. [DOI] [PMC free article] [PubMed] [Google Scholar]
- 69.Brown NC, Andreazza AC, Young LT (2014): An updated meta-analysis of oxidative stress markers in bipolar disorder. Psychiatry Res 218: 61–68. [DOI] [PubMed] [Google Scholar]
- 70.Flatow J, Buckley P, Miller BJ (2013): Meta-analysis of oxidative stress in schizophrenia. Biol Psychiatry 74: 400–409. [DOI] [PMC free article] [PubMed] [Google Scholar]
- 71.Wang AY, Lohmann KM, Yang CK, Zimmerman EI, Pantazopoulos H, Herring N, et al. (2011): Bipolar disorder type 1 and schizophrenia are accompanied by decreased density of parvalbumin- and somatostatin-positive interneurons in the parahippocampal region. Acta Neuropathol (Berl) 122: 615–626. [DOI] [PMC free article] [PubMed] [Google Scholar]
- 72.Pantazopoulos H, Lange N, Baldessarini RJ, Berretta S (2007): Parvalbumin neurons in the entorhinal cortex of subjects diagnosed with bipolar disorder or schizophrenia. Biol Psychiatry 61: 640–652. [DOI] [PMC free article] [PubMed] [Google Scholar]
- 73.Toker L, Agam G (2015): Mitochondrial dysfunction in psychiatric morbidity: current evidence and therapeutic prospects. Neuropsychiatr Dis Treat 11: 2441–2447. [DOI] [PMC free article] [PubMed] [Google Scholar]
- 74.Reinecke F, Smeitink JAM, van der Westhuizen FH (2009): OXPHOS gene expression and control in mitochondrial disorders. Biochim Biophys Acta BBA - Mol Basis Dis, Mitochondrial Disease 1792: 1113–1121. [DOI] [PubMed] [Google Scholar]
- 75.Knable MB, Torrey EF, Webster MJ, Bartko JJ (2001): Multivariate analysis of prefrontal cortical data from the Stanley Foundation Neuropathology Consortium. Brain Res Bull 55: 651–659. [DOI] [PubMed] [Google Scholar]
- 76.Steffek AE, McCullumsmith RE, Haroutunian V, Meador-Woodruff JH (2008): Cortical expression of glial fibrillary acidic protein and glutamine synthetase is decreased in schizophrenia. Schizophr Res 103: 71–82. [DOI] [PMC free article] [PubMed] [Google Scholar]
- 77.Johnston-Wilson NL, Sims CD, Hofmann J-P, Anderson L, Shore AD, Torrey EF, Yolken RH (2000): Disease-specific alterations in frontal cortex brain proteins in schizophrenia, bipolar disorder, and major depressive disorder. Mol Psychiatry 5: 142–149. [DOI] [PubMed] [Google Scholar]
- 78.Webster MJ, O’Grady J, Kleinman JE, Weickert CS (2005): Glial fibrillary acidic protein mRNA levels in the cingulate cortex of individuals with depression, bipolar disorder and schizophrenia. Neuroscience 133: 453–461. [DOI] [PubMed] [Google Scholar]
- 79.Toro CT, Hallak JEC, Dunham JS, Deakin JFW (2006): Glial fibrillary acidic protein and glutamine synthetase in subregions of prefrontal cortex in schizophrenia and mood disorder. Neurosci Lett 404: 276–281. [DOI] [PubMed] [Google Scholar]
- 80.Kendler KS, Neale MC (2010): Endophenotype: a conceptual analysis. Mol Psychiatry 15: 789–797. [DOI] [PMC free article] [PubMed] [Google Scholar]
- 81.Narayan S, Tang B, Head SR, Gilmartin TJ, Sutcliffe JG, Dean B, Thomas EA (2008): Molecular profiles of schizophrenia in the CNS at different stages of illness. Brain Res 1239: 235–248. [DOI] [PMC free article] [PubMed] [Google Scholar]
- 82.Lanz TA, Joshi JJ, Reinhart V, Johnson K, Grantham LE II, Volfson D (2015): STEP Levels Are Unchanged in Pre-Frontal Cortex and Associative Striatum in Post-Mortem Human Brain Samples from Subjects with Schizophrenia, Bipolar Disorder and Major Depressive Disorder. PLoS ONE 10. doi: 10.1371/journal.pone.0121744. [DOI] [PMC free article] [PubMed] [Google Scholar]
- 83.Chen C, Cheng L, Grennan K, Pibiri F, Zhang C, Badner JA, et al. (2012): Two gene co-expression modules differentiate psychotics and controls. Mol Psychiatry . doi: 10.1038/mp.2012.146. [DOI] [PMC free article] [PubMed] [Google Scholar]
- 84.Ryan MM, Lockstone HE, Huffaker SJ, Wayland MT, Webster MJ, Bahn S (2006): Gene expression analysis of bipolar disorder reveals downregulation of the ubiquitin cycle and alterations in synaptic genes. Mol Psychiatry 11: 965–978. [DOI] [PubMed] [Google Scholar]
- 85.Harris L, Lockstone H, Khaitovich P, Weickert C, Webster M, Bahn S (2009): Gene expression in the prefrontal cortex during adolescence: implications for the onset of schizophrenia. BMC Med Genomics 2: 28. [DOI] [PMC free article] [PubMed] [Google Scholar]
- 86.Kang HJ, Kawasawa YI, Cheng F, Zhu Y, Xu X, Li M, et al. (2011): Spatio-temporal transcriptome of the human brain. Nature 478: 483–489. [DOI] [PMC free article] [PubMed] [Google Scholar]
Associated Data
This section collects any data citations, data availability statements, or supplementary materials included in this article.