

Abstract
Purpose:
Critically ill patients experience significant sleep disruption. In this study of ICU patients with delirium, we evaluated associations between the loss of stage N2 features (K-complexes, sleep spindles), grade of encephalopathy based on electroencephalography (EEG), and intensive care unit (ICU) outcomes. We hypothesized that loss of stage N2 features is associated with more severe grades of encephalopathy and worse ICU outcomes including death.
Materials and Methods:
This was an observational cohort study of 93 medical ICU patients without primary acute brain injury who underwent continuous EEG. Type and severity of critical illness, sedative-hypnotic use, length of stay, modified Rankin Scale at hospital discharge, and death during hospitalization were abstracted from the medical record. EEG was evaluated for grade of encephalopathy and sleep features.
Results:
Patients without K-complexes or without sleep spindles had more severe encephalopathy and higher odds of death. The odds ratio for patients without K-complexes was 18.8 (p=0.046). The odds ratio for patients without sleep spindles was 6.3 (p=0.036).
Conclusions:
Loss of stage N2 features is common and associated with more severe encephalopathy and higher odds of death. The absence of either Stage N2 feature, K complexes or sleep spindles, may have important prognostic value.
Keywords: sleep, critical illness, electroencephalography, polysomnography, encephalopathy, delirium
Introduction
Patients in the intensive care unit (ICU) commonly experience sleep disruption [1, 2]. Sleep disruption during critical illness has been proposed as a major contributor to ICU delirium [3]. ICU delirium is associated with poor cognitive outcomes in ICU survivors and increased mortality [4–6]. Understanding sleep disturbance in the ICU is an important avenue of investigation for delirium prevention and treatment.
Typical sleep features, as identified by polysomnography, are often absent in critically ill patients [2, 7–9], and alternative sleep categories have been proposed [7, 9]. “Atypical sleep” is an important subtype of abnormal sleep that has been identified in about one-third of medical ICU (MICU) patients. Loss of stage N2 features (i.e., K-complexes and sleep spindles) is a hallmark of atypical sleep [2, 7, 8]. Rapid eye movement (REM) sleep and slow wave sleep are also severely diminished, however, this feature is not unique to patients with atypical sleep. The clinical significance of the loss of stage N2 features is not well understood.
Like “delirium,” encephalopathy is a broad term for alteration in mental status. Encephalopathy can be graded according to the degree of change in background electroencephalography (EEG) frequency; background change in EEG frequency can range from mild to severe slowing [10, 11]. Acute toxic-metabolic encephalopathy is common in the MICU and is less well studied than encephalopathies caused by structural brain disease or anoxic injury [12]. Sleep disruption is often considered a clinical symptom of encephalopathy but is not a required part of diagnosis [12, 13]. Sleep architecture, including stage N2 features, is not part of EEG grading of encephalopathy.
Limited data exist regarding the clinical significance of loss of K-complexes or sleep spindles, and their relationship with EEG graded encephalopathy [7, 8, 14, 15]. Previous work has indicated that as many as one third of MICU patients have an absence of these stage N2 sleep features [2]. Of these patients, 44% had clinical evidence of delirium on the day of polysomnography whereas only 18% of patients with N2 sleep features were clinically delirious [2]. In other cohorts, atypical sleep has been seen in patients with and without clinical correlates of delirium and in sedated patients [7, 8, 16]. In a larger study of 142 encephalopathic patients (more than half with acute brain injury), the preservation of K-complexes was associated with more favorable ICU outcomes [17].
Our aims were to evaluate the associations between loss of K-complexes or sleep spindles and (1) grade of encephalopathy, (2) patient factors, and (3) critical illness outcomes in a MICU population. We hypothesized that the loss of K-complexes or sleep spindles is associated with higher degrees of encephalopathy, higher severity of illness, sedative-hypnotic use, and worse ICU outcomes including death.
Materials and Methods
Study Design and Patient Population
This was a retrospective observational cohort study. We selected a sample of consecutive MICU patients who underwent continuous EEG as part of their usual care from November 2013 to January 2016; patients were identified via our institutional continuous EEG repository. The Institutional Review Board approved study activities with a waiver of consent (HIC #1111009342). Study patients had to have at least 12 hours of monitoring which included the overnight period (20:00 to 06:00). For patients with prolonged monitoring, only the first 24 hours of EEG record was evaluated. This investigation focused on critically ill patients at risk for toxic-metabolic encephalopathy, and therefore patients with acute brain injury or advanced dementia diagnosed prior to EEG start were excluded. Primary acute brain injury was defined as one the following within 30 days prior to EEG: anoxic brain injury due to cardiac arrest, stroke or intracranial bleed, central nervous system infection, enlarging intracranial mass, or traumatic brain injury. Advanced dementia was defined as the inability to live independently secondary to cognitive impairment, not alert and oriented to self, or non-verbal and bedbound. Due to the exclusions from brain injury, the reason for continuous EEG was limited to either mental status change or concern for seizure.
Patient Factors
Patient demographics, medical history, medication use, and admitting diagnosis were abstracted from the medical record. The Acute Physiology and Chronic Health Evaluation II (APACHE II) score was abstracted and calculated according to published algorithms [18]. Richmond Agitation Sedation Scale (RASS) scores and mechanical ventilation status were also abstracted. A validated chart review for delirium was used to determine if patients were delirious on the day of EEG; this chart review has a specificity of 85% (95% CI 80–90%) in ICU patients [19, 20]. Psychoactive medications including narcotics, benzodiazepines, propofol, and dexmedetomidine were recorded from the time of MICU admission until EEG discontinuation. The reason for EEG was categorized as either mental status change or concern for seizure. Date and time of hospitalization, MICU admission, MICU discharge, hospital discharge, and EEG start and end were recorded. Death during hospitalization and functional status at discharge were recorded. Functional status was assessed based on chart review of physical therapy discharge documentation and classified according to the modified Rankin Scale (mRS); mRS was then categorized as favorable (0 to 3) or unfavorable (4 to 6) [21].
EEG Scoring
Based on the 10–20 system, a full montage of EEG, right and left electrooculogram, and chin electromyogram leads were applied per standard procedure by certified EEG technologists. A board-certified neurophysiologist (EJG) reviewed all EEGs in 10-second epochs for reactivity, variability, state changes, rhythmic and periodic patterns, electrographic seizures, and EEG background abnormalities. Reactivity was defined as a change from baseline in amplitude or frequency of cerebral activity (appearance of muscle artifact did not qualify as reactive) in response to vocal, tactile, or noxious stimulation, and variability as a spontaneous change in the frequency of background rhythms or amplitude not related to overt stimulation. State changes were defined as spontaneous variation in the frequency of background rhythms or amplitude corresponding to transitions from one state to another. As defined by the American Clinical Neurophysiology Society, periodic discharges, rhythmic delta activity, and electrographic seizures were also scored according to standard criteria [22]. Grade of encephalopathy (i.e., background abnormalities during the patient’s most awake state) were scored according to the following [10, 11]: Grade I (mild): predominant posterior dominant rhythm in the alpha frequency range, regular and reactive, with intermittent theta activity; Grade II (mild-moderate): predominant theta, often reactive, with or without alpha, intermittent delta activity; Grade III (moderate, moderate-severe): widespread delta (reactive or non-reactive), or spindle coma; Grade IV (severe): suppression-burst pattern; alpha, beta or theta coma pattern; diffuse attenuation(<20uV); Grade V: continuous suppression (no definite activity >2uV). Sleep montage EEG utilized a subset of electrodes: F4, C4, O2 (referenced to M1) and F3, C3, O1 (referenced to M2). A board-certified sleep and critical care physician (MPK) reviewed all EEGs in 30-second epochs for sleep stage features based on sleep montage EEG, electrooculogram, and electromyogram leads; American Academy of Sleep Medicine Scoring Manual 2.2 criteria were used [23]. We conducted the EEG review described above exclusively for research purposes; investigators were blinded to patient outcome at the time of EEG review.
Statistical Analysis
Means (standard deviations) and counts (percentages) of continuous and categorical patient factors, respectively, were tabulated for patients with and without K-complexes and for patients with and without sleep spindles. Differences between groups were tested using either t-test or chi-square statistics as appropriate. Electroencephalographic characteristics were also tabulated for patients with and without K-complexes and with and without sleep spindles. The Fisher’s Exact test was used to test for differences between groups in the percentages of participants in each grade of EEG-based encephalopathy. Patient outcomes, including MICU and hospital length of stay, mRS at discharge, and death while hospitalized were also tabulated for patients with and without K-complexes and with and without sleep spindles. Patient outcomes were compared among groups using t-tests for continuous variables and Fisher’s Exact for categorical variables.
A multivariable logistic regression model was fit with a binary variable for death during hospitalization as the outcome, and the primary exposure was a binary indictor of absence of K-complexes. Because there were no deaths among persons with K-complexes, the adjustment for complete separation proposed by Firth was used in fitting the model. An indicator of moderate or severe encephalopathy relative to normal or mild grades served as the exposure of secondary interest. Patients with normal to mild (including “mild to moderate”) were pooled and served as the reference group for moderate and severe (including “moderate to severe”) encephalopathy. Additional covariates included age in ten-year increments, severity of illness (APACHE II score), presence of sepsis (binary variable), and time from hospital admission to EEG in days. Supplemental analyses fit the same multivariable logistic model of death during hospitalization by substituting a binary indicator of absence of sleep spindles for that of K-complexes. Model discrimination was assessed with the C statistic and calibration with the Hosmer-Lemeshow goodness-of-fit statistic. All study data were recorded and managed in REDCap [24]. Analyses were conducted using either STATA version 14 or SAS version 9.4. Statistical significance was defined as a two-tailed p-value < 0.05.
Results
Patient Screening and Enrollment
A total of 268 patients met inclusion criteria; 175 patients with acute primary brain injury or pre-existing advanced dementia were excluded. Anoxic brain injury due to cardiac arrest (n=82) was the most common reason for exclusion. Ninety-three patients were enrolled in the study (Figure 1). EEG indication was categorized as either change in mental status (68%) or concern for seizure (32%).
Figure 1:
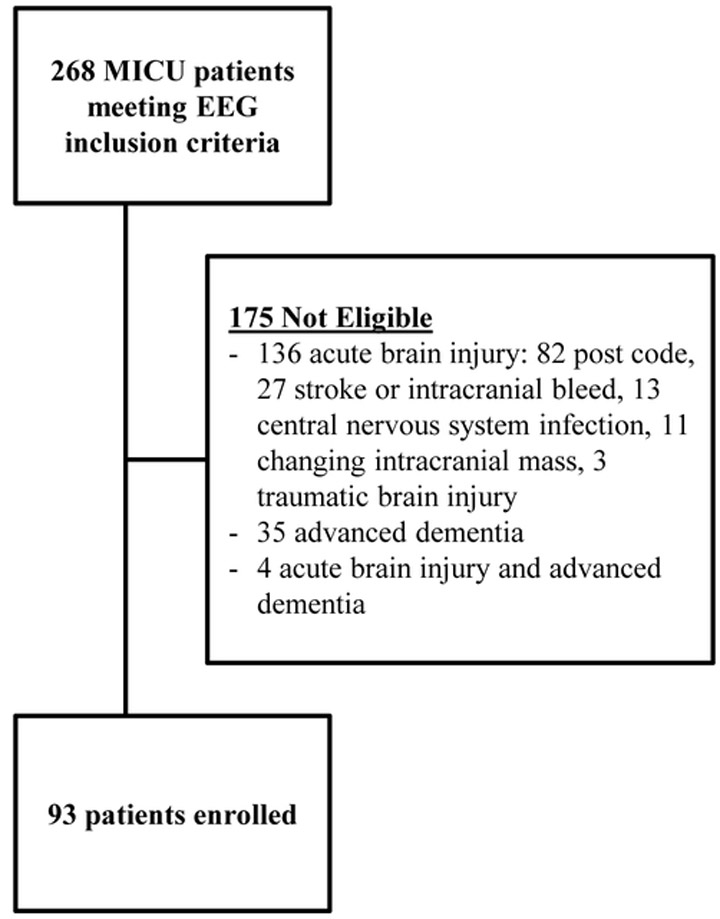
Patient inclusion and exclusion flow diagram. Code indicates cardiac arrest with return of spontaneous circulation; stroke indicates embolic or hemorrhagic cerebrovascular accident; intracranial bleed includes epidural, subdural, subarachnoid, or intracerebral bleeding; central nervous system infection included encephalitis and meningitis. Abbreviations: MICU, medical intensive care unit; EEG, electroencephalography.
Patient Factors
Patient data is presented in Table 1 for the overall cohort and by presence or absence of K-complexes; the same data grouped by presence or absence of sleep spindles are presented in Supplementary Table 1. All patients with K-complexes (n=15) also had sleep spindles. Of the patients with sleep spindles (n=20), most also had K-complexes (n=15), but a small number of patients did not have K-complexes (n=5). REM and slow wave (stage N3) sleep were seen in a single patient.
Table 1:
Patient Characteristics Overall and by K-complex Status
| Patient Characteristics | All Patients N=93 |
K-complex n=15 |
No K-complex n=78 |
|---|---|---|---|
| Age (years): Mean ± SD | 56.2 ± 15.3 | 63.5 ± 16.7* | 54.7 ± 14.7 |
| Female: Count (%) | 45 (48%) | 10 (67%) | 35 (45%) |
| Non-white: Count (%) | 43 (46%) | 6 (40%) | 37 (47%) |
| Septic Shock: Count (%) ¶ | 31 (33%) | 5 (33%) | 26 (33%) |
| Acute Respiratory Failure: Count (%) ¶ | 65 (70%) | 8 (53%) | 57 (73%) |
| APACHE II Score: Mean ± SD | 25.1 ± 8.4 | 23.3 ± 7.5 | 25.5 ± 8.6 |
| History of Seizure: Count (%) | 12 (13%) | 4 (27%) | 8 (10%) |
| Indication for EEG - Mental Status: Count (%) § | 63 (68%) | 7 (47%) | 56 (72%) |
| Days from MICU admission to EEG: Mean ± SD | 2.4 ± 3.4 | 0.9 ± 0.7 | 2.7 ± 3.6 |
| Days from hospital admission to EEG: Mean ± SD | 4.3 ± 6.0 | 1.4 ± 1.1* | 4.8 ± 6.4 |
| RASS on Day of EEG: Mean ± SD | −2.8 ± 1.9 | −1.8 ± 2.4 * | −3.0 ± 1.7 |
| Vasopressors on Day of EEG: Count (%) | 35 (38%) | 4 (27%) | 31 (40%) |
| Narcotics on Day of EEG: Count (%) | 57 (61%) | 8 (53%) | 49 (63%) |
| Benzodiazepine on Day of EEG: Count (%) | 51 (55%) | 7 (47%) | 44 (56%) |
| Propofol on Day of EEG: Count (%) | 27 (29%) | 3 (20%) | 24 (31%) |
| Mechanical Ventilation on Day of EEG: Count (%) | 79 (85%) | 9 (60%) ## | 70 (90%) |
Diagnoses are not exclusive of each other
Indication for EEG was either mental status change or concern for seizure
p < 0.05 for t-test comparing means between groups.
p < 0.005 for chi-squared test comparing frequencies between groups.
Abbreviations: APACHE II, Acute Physiology and Chronic Health Evaluation II; EEG, electroencephalography; MICU, medical intensive care unit; RASS, Richmond Agitation and Sedation Scale; SD, standard deviation
Mean age for all patients (N=93) was 56.2 years, 48% were female, and 46% were non-white. The mean APACHE II score was 25.1. About one-third of patients had septic shock and about two-thirds of patients had acute respiratory failure; these categories were not mutually exclusive. Sedative-hypnotic use was frequent in this cohort, and 42% of patients were prescribed both narcotics and benzodiazepines on the day of EEG. Only one patient received dexmedetomidine; this patient did not have stage N2 features. In our cohort, there are no associations (Fisher’s exact) between RASS score and opiate, benzodiazepine, or propofol use on the day of, day before or 2 days before EEG (data not shown). Patients with K-complexes were older (p=0.04) and less frequently mechanically ventilated versus patients without K-complexes (p=0.003). EEG placement was within 48 hours of hospitalization for 53% of all patients. Patients with K-complexes demonstrated a shorter time to EEG placement from hospital admission (p=0.04). Patients with K-complexes had a higher (better) RASS on the day of EEG (p=0.02). All patients met criteria for delirium per validated chart review during the 24 hours before EEG start.
EEG Findings
Table 2 examines the frequency of grades of encephalopathy for the overall cohort and by presence or absence of K-complexes. Full montage EEG revealed that 84% of patients had moderate, moderate to severe, or severe encephalopathy. Comparison of full montage EEG findings among patients with and without K-complexes demonstrated a statistically significant difference in the frequencies of encephalopathy grade. Patients with stage K-complexes had milder encephalopathy. There are cases of patients with K-complexes having moderate or worse encephalopathy and, conversely, cases of patients without K-complexes features having mild or better encephalopathy. These same patterns are also seen when comparing patients with and without sleep spindles (Supplementary Table 2). There was a higher frequency of state changes among patients with K-complexes versus patients without K-complexes (p=0.04); otherwise, the listed EEG abnormalities did not vary by K-complex status.
Table 2:
Electroencephalographic Characteristics by K-complex Status
| Full Montage EEG Characteristics | Sleep Category based on Sleep Montage EEG | ||
|---|---|---|---|
| All Patients N=93 |
K-complex n=15 |
No K-complex n=78 |
|
| Degree of Encephalopathy: Count (%) | |||
| None | 1 (1%) | 0 (0%) | 1 (1%) |
| Mild | 6 (6%) | 5 (33%) | 1 (1%) |
| Mild to Moderate | 8 (9%) | 2 (13%) | 6 (8%) |
| Moderate | 36 (39%) | 5 (33%) | 31 (40%) |
| Moderate to Severe | 32 (34%) | 3 (20%) | 29 (37%) |
| Severe | 10 (10%) | 0 (0%) | 10 (13%) |
| Fisher’s Exact p=0.001 | |||
| Other EEG Abnormalities: Count (%) | |||
| Periodic Discharges | 28 (30%) | 2 (13%) | 26 (33%) |
| Rhythmic Delta | 25 (27%) | 5 (33%) | 20 (26%) |
| Seizures | 7 (8%) | 0 (0%) | 7 (9%) |
| Reactivity | 68 (73%) | 14 (93%) | 54 (69%) |
| State Changes | 75 (81%) | 15 (100%) # | 60 (77%) |
| Variability | 87 (94%) | 15 (100%) | 72 (92%) |
Columns do not add up to 100% due to rounding.
p < 0.05 for Fisher’s Exact comparing frequencies between groups.
Abbreviations: EEG, electroencephalography
Patient Outcomes
Patient outcomes varied based on the presence of stage N2 features (Table 3, Supplementary Table 3). Mean lengths of stay in the MICU were shorter among patients with K-complexes (5.4 versus 8.7 days, p=0.01) and sleep spindles (5.8 versus 8.8 days, p=0.02). More patients with sleep spindles had a favorable mRS score at discharge versus patients without sleep spindles (40% versus 19%, p=0.05). Similarly, more patients with K-complexes had favorable mRS outcomes at discharge; however, this difference was not statistically significant (40% versus 21%, p=0.1). All patients with K-complexes survived hospitalization; 74% of patients without K-complexes survived hospitalization (p=0.006).
Table 3:
Patient Outcomes by K-Complex Status
| Patient Outcomes | All Patients N=93 |
K-complex n=15 |
No K-complex n=78 |
|---|---|---|---|
| Length of MICU Stay: Days, Mean ± SD | 8.1 ± 6.6 | 5.4 ± 3.6 * | 8.7 ± 6.9 |
| Length of Hospital Stay: Days, Mean ± SD | 19.0 ± 17.4 | 12.6 ± 7.2* | 20.2 ± 18.6 |
| Favorable mRS score (mRS 0-3): Count (%) | 22 (24%) | 6 (40%) | 16 (21%) |
| Death during Hospitalization: Count (%) | 28 (30%) | 0 (0%) # | 28 (36%) |
p < 0.01 for t-test comparing means between groups.
p < 0.01 for Fisher’s Exact comparing frequencies between groups.
Abbreviations: MICU, medical intensive care unit; mRS, modified Rankin Scale; SD, standard deviation
Relative to patients with K-complexes and after controlling for grade of encephalopathy, age, severity of illness, presence of sepsis and time from hospital admission to EEG, the odds ratio of death during hospitalization for patients lacking K-complexes was 18.8 (p=0.046). The multivariable model with absence of K-complexes exhibited good discrimination (C statistic = 77%) and calibration (p-value of Hosmer-Lemeshow statistic > 0.05). In a corresponding multivariable logistic model of death during hospitalization, patients without sleep spindles had an odds ratio of 6.3 (p=0.036) relative to patients with sleep spindles. (Supplementary Table 4). When tested in either multivariable model, neither mechanical ventilation nor depth of sedation were significant predictors of mortality.
Discussion
We enrolled critically ill MICU patients who underwent continuous EEG as part of routine care and who did not have primary acute brain injury or severe dementia; all patients were found to be delirious. In this study, we demonstrated that more than three-quarters of study patients lacked stage N2 features. Patients who lacked these features more frequently exhibited moderate or worse encephalopathy but occasionally had only mild or mild to moderate encephalopathy. Lack of stage N2 features was associated with worse MICU outcomes including higher odds of death and longer stays. A lack of sleep spindles was associated with lower functional outcome scores, and, there was nonsignificant trend in association between lack of K-complexes and functional outcome scores. These findings suggest that that stage N2 features may be a clinically important EEG feature in ICU patients without primary acute brain injury.
Loss of stage N2 features and encephalopathy could represent separate manifestations of brain dysfunction which frequently occur together. These processes likely share important risk factors. Critical illness prognostication with full montage EEG has previously been limited and has only recently focused on patients with acute non-hypoxic brain injury [12, 25]. As mentioned above, Sutter et al. found that the preservation of K-complexes in a mixed population of encephalopathic patients with and without acute brain injury was significantly associated with good outcomes [13, 17]. Others have demonstrated the prognostic importance of sleep elements in a variety of acute brain injury populations including patients with severe traumatic brain injury [26], status epilepticus [27], sub-arachnoid hemorrhage [28], and anoxic brain injury [29]. Our work extends these findings to patients with toxic-metabolic encephalopathy and delirium and further supports the hypothesis that the maintenance of N2 sleep elements may be strongly associated with better patient outcomes.
Patients without stage N2 features were characterized by longer time to EEG placement, suggesting a potential link with sleep deprivation caused by the hospital environment. However, time to EEG placement was quite variable, and more than half of all patients had their EEG within 48 hours of hospitalization. This argues against such a conclusion. The idea that loss of stage N2 features is present relatively early in hospitalization is reinforced by prior work by Roche Campo et al. in which 8 of 27 patients had atypical sleep (i.e., lacking stage N2 features) during the second, third, or fourth night of non-invasive ventilation. Because it was conducted in a cohort undergoing non-invasive ventilation, the work by Roche Campo et al. also suggests that continuous infusion or high doses of sedative-hypnotic medication are not strong factors in the development of atypical sleep. This is similar to our finding that there is no association between stage N2 features and the use of benzodiazepines, narcotics, or propofol on the day of EEG placement.
The fundamental EEG characteristic of atypical sleep is loss of stage N2 features. Both the nomenclature of atypical sleep and the overlap with encephalopathy have been questioned [9, 14, 30]; it is beyond the scope of this study to resolve such issues. We do suggest there is merit in developing a sleep staging paradigm beyond the standards used for healthy adults [15]. Our work here emphasizes that the absence of K-complexes or sleep spindles is significantly associated with death. This suggests that any sleep classification employed during critical illness should include loss of these stage N2 features as a central component.
Because all patients were delirious and had EEG performed as part of routine MICU care, a limitation of this study is that patients with normal mental status and mild encephalopathy were underrepresented. Therefore, these findings are not generalizable to the full spectrum of mental status observed in the MICU, but rather are restricted to MICU patients who experience delirium. Delirium is a major contributor to morbidity and mortality in critically ill patients [31]. In addition, this study cannot establish the timing of loss of stage N2 features. Therefore, we cannot establish causality or clarify the relationship between sleep disruption in the hospital and the onset of loss of N2 sleep architecture. Our multivariable model includes several nonsignificant covariates which, along with a modest sample size, contributed to large confidence intervals. However, we felt that it was important to control for fundamental patient characteristics such as age and severity of illness. Given the relationship between encephalopathy and loss of stage N2 features, we also felt that it was important to control for grade of encephalopathy when modeling death. Because we did not assess end-of-life decision making or alterations in goals of care during hospitalization, we could not assess how changes in goals of care may have impacted mortality. Finally, we were not able to collect mRS at the time of admission which precludes the assessment of the trajectory of functional status for patients in our study. This work sets the stage for a prospective study which would include EEG in critically ill patients representing the full range of normal to severely abnormal brain function.
Conclusions
This study suggests that changes in sleep architecture are associated with but potentially distinct from encephalopathy. Loss of stage N2 features does not appear to be associated with either medication use or severity of illness. Patients with loss of stage N2 features experienced longer lengths of stay and higher odds of death during hospitalization. EEG sleep features may be important prognostic markers for critically ill patients.
Supplementary Material
Table 4:
Logistic Regression Model for Death during Hospitalization by Absence of K-Complex
| Independent Variables | Odds Ratio | Confidence Intervals | p-value |
|---|---|---|---|
| No K-Complex | 18.8 | 1.1 – 337.4 | 0.046 |
| Moderate Encephalopathy | 1.5 | 0.3 – 8.1 | 0.640 |
| Severe Encephalopathy | 2.0 | 0.4 – 10.7 | 0.431 |
| Age (per 10 years) | 1.5 | 1.0 – 2.2 | 0.039 |
| APACHE II | 1.0 | 0.9 – 1.0 | 0.383 |
| Sepsis Present | 1.9 | 0.6 – 5.4 | 0.245 |
| Days from Admission to EEG Start | 1.1 | 1.0 – 1.2 | 0.116 |
Logistic regression was performed for the outcome of death. Patients with K-complexes were the reference group for patients without K-complexes. Patients with normal to mild (including “mild to moderate”) were pooled and served as the reference group for moderate and severe (including “moderate to severe”) encephalopathy. The C statistic for the model was 77% and a p-value of Hosmer-Lemeshow > 0.05.
Abbreviations: APACHE II, Acute Physiology and Chronic Health Evaluation II
Acknowledgements:
We gratefully acknowledge our data abstractor Andrea Benjamin, RN.
Funding Acknowledgements: This work was supported by career development funding to M. P. Knauert and E. J. Gilmore and administrative funding to T.E. Murphy, P. H. Van Ness and L. Han from the Claude D. Pepper Older Americans Independence Center at Yale (P30 AG021342). M.P. Knauert was supported by CTSA grant number KL2 TR000140 from the National Center for Advancing Translational Science. H.K. Yaggi is supported by mentoring funds from the National Heart, Lung and Blood Institute (K24 HL132093). M. A. Pisani is supported by funds from the Patrick and Catherine Weldon Donaghue Medical Research Foundation.
Abbreviations:
- APACHE II
Acute Physiology and Chronic Health Evaluation II
- EEG
Electroencephalography
- ICU
Intensive Care Unit
- MICU
Medical Intensive Care Unit
- mRS
Modified Rankin Scale
- OR
Odds Ratio
- RASS
Richmond Agitation-Sedation Scale
- REM
Rapid Eye Movement
Footnotes
Declarations of interest: None
References
- [1].Elliott R, McKinley S, Cistulli P, Fien M. Characterisation of sleep in intensive care using 24-hour polysomnography: an observational study. Crit Care 17:R46, 2013 [DOI] [PMC free article] [PubMed] [Google Scholar]
- [2].Knauert MP, Yaggi HK, Redeker NS, Murphy TE, Araujo KL, Pisani MA. Feasibility study of unattended polysomnography in medical intensive care unit patients. Heart Lung 43:445–52, 2014 [DOI] [PMC free article] [PubMed] [Google Scholar]
- [3].Weinhouse GL, Schwab RJ, Watson PL, Patil N, Vaccaro B, Pandharipande P, et al. Bench-to-bedside review: delirium in ICU patients - importance of sleep deprivation. Crit Care 13:234, 2009 [DOI] [PMC free article] [PubMed] [Google Scholar]
- [4].Ely EW, Shintani A, Truman B, Speroff T, Gordon SM, Harrell FE, Jr., et al. Delirium as a predictor of mortality in mechanically ventilated patients in the intensive care unit. JAMA 291:1753–62, 2004 [DOI] [PubMed] [Google Scholar]
- [5].Pisani MA, Kong SY, Kasl SV, Murphy TE, Araujo KL, Van Ness PH. Days of delirium are associated with 1-year mortality in an older intensive care unit population. Am J Respir Crit Care Med 180:1092–7, 2009 [DOI] [PMC free article] [PubMed] [Google Scholar]
- [6].Girard TD, Jackson JC, Pandharipande PP, Pun BT, Thompson JL, Shintani AK, et al. Delirium as a predictor of long-term cognitive impairment in survivors of critical illness. Crit Care Med 38:1513–20, 2010 [DOI] [PMC free article] [PubMed] [Google Scholar]
- [7].Cooper AB, Thornley KS, Young GB, Slutsky AS, Stewart TE, Hanly PJ. Sleep in critically ill patients requiring mechanical ventilation. Chest 117:809–18, 2000 [DOI] [PubMed] [Google Scholar]
- [8].Drouot X, Roche-Campo F, Thille AW, Cabello B, Galia F, Margarit L, et al. A new classification for sleep analysis in critically ill patients. Sleep Med 13:7–14, 2012 [DOI] [PubMed] [Google Scholar]
- [9].Watson PL, Pandharipande P, Gehlbach BK, Thompson JL, Shintani AK, Dittus BS, et al. Atypical sleep in ventilated patients: empirical electroencephalography findings and the path toward revised ICU sleep scoring criteria. Crit Care Med 41:1958–67, 2013 [DOI] [PMC free article] [PubMed] [Google Scholar]
- [10].Synek VM. Revised EEG coma scale in diffuse acute head injuries in adults. Clin Exp Neurol 27:99–111, 1990 [PubMed] [Google Scholar]
- [11].Synek VM. Prognostically important EEG coma patterns in diffuse anoxic and traumatic encephalopathies in adults. J Clin Neurophysiol 5:161–74, 1988 [DOI] [PubMed] [Google Scholar]
- [12].Sutter R, Kaplan PW, Valenca M, De Marchis GM. EEG for Diagnosis and Prognosis of Acute Nonhypoxic Encephalopathy: History and Current Evidence. J Clin Neurophysiol 32:456–64, 2015 [DOI] [PubMed] [Google Scholar]
- [13].Sutter R, Kaplan PW. Clinical, Electroencephalographic, and Neuroradiological Outcome Predictors in Acute Nonhypoxic Encephalopathy: A Nine-Year Cohort Study. Clin EEG Neurosci 47:61–8, 2016 [DOI] [PubMed] [Google Scholar]
- [14].Bridoux A, Thille AW, Quentin S, Lode-Kolz K, Stal V, Diaz V, et al. Sleep in ICU: atypical sleep or atypical electroencephalography? Crit Care Med 42:e312–3, 2014 [DOI] [PubMed] [Google Scholar]
- [15].Drouot X, Quentin S. Sleep Neurobiology and Critical Care Illness. Sleep Med Clin 11:105–13, 2016 [DOI] [PubMed] [Google Scholar]
- [16].Roche Campo F, Drouot X, Thille AW, Galia F, Cabello B, d’Ortho MP, et al. Poor sleep quality is associated with late noninvasive ventilation failure in patients with acute hypercapnic respiratory failure. Crit Care Med 38:477–85, 2010 [DOI] [PubMed] [Google Scholar]
- [17].Sutter R, Barnes B, Leyva A, Kaplan PW, Geocadin RG. Electroencephalographic sleep elements and outcome in acute encephalopathic patients: a 4-year cohort study. Eur J Neurol 21:1268–75, 2014 [DOI] [PubMed] [Google Scholar]
- [18].Knaus WA, Draper EA, Wagner DP, Zimmerman JE. APACHE II: a severity of disease classification system. Crit Care Med 13:818–29, 1985 [PubMed] [Google Scholar]
- [19].Inouye SK, Leo-Summers L, Zhang Y, Bogardus ST Jr., Leslie DL, Agostini JV. A chart-based method for identification of delirium: validation compared with interviewer ratings using the confusion assessment method. J Am Geriatr Soc 53:22–8, 2005 [DOI] [PubMed] [Google Scholar]
- [20].Pisani MA, Araujo KL, Van Ness PH, Zhang Y, Ely EW, Inouye SK. A research algorithm to improve detection of delirium in the intensive care unit. Crit Care 10:R121, 2006 [DOI] [PMC free article] [PubMed] [Google Scholar]
- [21].Rankin J Cerebral vascular accidents in patients over the age of 60. II. Prognosis. Scott Med J 2:200–15, 1957 [DOI] [PubMed] [Google Scholar]
- [22].Hirsch LJ, LaRoche SM, Gaspard N, Gerard E, Svoronos A, Herman ST, et al. American Clinical Neurophysiology Society’s Standardized Critical Care EEG Terminology: 2012 version. J Clin Neurophysiol 30:1–27, 2013 [DOI] [PubMed] [Google Scholar]
- [23].Berry RB, Gamaldo CE, Harding SM, Brooks R, Lloyd RM, Vaughn BV, et al. AASM Scoring Manual Version 2.2 Updates: New Chapters for Scoring Infant Sleep Staging and Home Sleep Apnea Testing. Journal of Clinical Sleep Medicine 11:1253–4, 2015 [DOI] [PMC free article] [PubMed] [Google Scholar]
- [24].Harris PA, Taylor R, Thielke R, Payne J, Gonzalez N, Conde JG. Research electronic data capture (REDCap)-A metadata-driven methodology and workflow process for providing translational research informatics support. J Biomed Inform 42:377–81, 2009 [DOI] [PMC free article] [PubMed] [Google Scholar]
- [25].Gilmore EJ, Gaspard N, Choi HA, Cohen E, Burkart KM, Chong DH, et al. Acute brain failure in severe sepsis: a prospective study in the medical intensive care unit utilizing continuous EEG monitoring. Intensive Care Med 41:686–94, 2015 [DOI] [PubMed] [Google Scholar]
- [26].Sandsmark DK, Kumar MA, Woodward CS, Schmitt SE, Park S, Lim MM. Sleep Features on Continuous Electroencephalography Predict Rehabilitation Outcomes After Severe Traumatic Brain Injury. J Head Trauma Rehabil 31:101–7, 2016 [DOI] [PMC free article] [PubMed] [Google Scholar]
- [27].Alvarez V, Drislane FW, Westover MB, Dworetzky BA, Lee JW. Characteristics and role in outcome prediction of continuous EEG after status epilepticus: A prospective observational cohort. Epilepsia 56:933–41, 2015 [DOI] [PMC free article] [PubMed] [Google Scholar]
- [28].Claassen J, Hirsch LJ, Frontera JA, Fernandez A, Schmidt M, Kapinos G, et al. Prognostic significance of continuous EEG monitoring in patients with poor-grade subarachnoid hemorrhage. Neurocrit Care 4:103–12, 2006 [DOI] [PubMed] [Google Scholar]
- [29].Hulihan JF, Jr., Syna DR. Electroencephalographic sleep patterns in post-anoxic stupor and coma. Neurology 44:758–60, 1994 [DOI] [PubMed] [Google Scholar]
- [30].Watson PL, Malow BA, Ely EW. The authors reply. Crit Care Med 42:e313–4, 2014 [DOI] [PubMed] [Google Scholar]
- [31].Jones SF, Pisani MA. ICU delirium: an update. Curr Opin Crit Care 18:146–51, 2012 [DOI] [PubMed] [Google Scholar]
Associated Data
This section collects any data citations, data availability statements, or supplementary materials included in this article.