

Abstract
Transplantation-associated thrombotic microangiopathy (TA-TMA) is a serious complication of hematopoietic stem cell transplantation (HSCT). We characterized the incidence, risk factors, and long-term outcomes associated with TA-TMA by performing a comprehensive review of all adult patients (n=1,990) undergoing allogeneic HSCT at the Dana Farber Cancer Institute/Brigham and Women’s Hospital between 2005 and 2013. Using the City of Hope criteria, we identified 258 (13%) and 508 (26%) patients with “definite” and “probable” TMA, respectively. Mismatched donor transplantation (sub-distribution hazard ratio [sHR]: 1.79, 95% confidence interval [CI] 1.17–2.75, p=0.007), sirolimus-containing graft-versus-host disease prophylaxis (sHR: 1.73, 95%CI 1.29–2.34, p<0.001), myeloablative conditioning (sHR: 1.93, 95%CI 1.38–2.68, p<0.001), and high baseline lactate dehydrogenase (LDH) level (sHR: 1.64, 95%CI 1.26–2.13, p<0.001) were associated with definite TMA. Moreover, positive cytomegalovirus serostatus (sHR: 1.41, 95%CI 1.16–1.71, p<0.001), high and very high disease risk index (sHR: 1.48, 95% CI 1.12–1.96, p=0.007), and high baseline LDH level (sHR: 1.25, 95%CI 1.05–1.49, p=0.011) were associated with probable TMA. In multivariable analyses, definite or probable TMA were each independently associated with higher mortality (HR: 5.24, 95%CI 4.43–6.20; HR: 2.12, 95%CI 1.84–2.44, respectively), and long-term kidney dysfunction (HR: 5.43, 95%CI 4.61–6.40; and HR: 2.20, 95%CI 1.92–2.51, respectively). Definite and probable TMA were also independently associated with greater risk of non-relapse mortality and shorter progression-free survival. Our findings indicate that TA-TMA is common following HSCT and is independently associated with increased risk of death and kidney dysfunction.
Keywords: hematopoietic stem cell transplantation, allogeneic, thrombotic microangiopathies, survival, renal outcome
Introduction
Thrombotic microangiopathy (TMA) is a systemic disorder characterized by microangiopathic hemolytic anemia, thrombocytopenia, and end-organ damage, including renal impairment.1,2 Transplantation-associated TMA (TA-TMA) is well described after allogeneic hematopoietic stem cell transplantation (HSCT), but the reported incidence varies widely, from 0.5 to 76%.3 Of 35 studies, George et al. reported that 28 different definitions were used to diagnose TMA following HSCT.4
TA-TMA represents a major clinical problem after HSCT, as it can often result in irreversible organ damage and death. Specifically, TMA can cause hypertension, cerebrovascular events, alveolar hemorrhage, gastrointestinal ischemia/hemorrhage, and kidney dysfunction, including acute kidney injury, chronic kidney disease (CKD), and end-stage kidney disease (ESKD).5–7 Renal complications are among the most common and severe problems affecting patients with TMA,8 but long-term renal outcomes after TA-TMA have not been well described. A retrospective study of 100 patients who underwent allogeneic HSCT found that TMA was an independent risk factor for CKD. Patients who developed TMA had a 4.3-fold higher risk of CKD compared with patients without TMA.9
To define the incidence, risk factors, long-term renal outcomes, and survival associated with TA-TMA, we performed a large, single-center, retrospective analysis of all adult patients undergoing allogeneic HSCT at Dana Farber Cancer Institute/Brigham and Women’s Hospital.
Materials and methods
Patient population and study data
We performed a retrospective cohort study of all adult patients who underwent allogeneic HSCT at Dana Farber Cancer Institute/Brigham and Women’s Hospital between January 2005 and December 2013. Demographics and transplant data were retrieved for all patients from the BMT data repository of the Dana-Farber Cancer Institute. Electronic medical records for all HSCT patients were reviewed to identify cases of definite or probable TMA occurring within the first 6 months following HSCT. This study was approved by the Institutional Review Boards of the Dana-Farber Cancer Institute/Harvard Cancer Center and Brigham and Women’s Hospital.
We collected the following data for each patient at baseline (before start of transplant conditioning): serum creatinine (SCr), complete blood count, lactate dehydrogenase (LDH) level, presence of proteinuria and other pre-transplant co-morbidities, including hypertension, diabetes mellitus, congestive heart failure, coronary artery disease, cirrhosis, and chronic lung disease. To ascertain TA-TMA cases and determine renal outcomes, we collected the following data by chart review in 2-week increments during the first 6 months after HSCT for all patients: the highest values for LDH and SCr, presence of nucleated red blood cells and schistocytes on peripheral blood smears, and the lowest value for platelets. We also recorded SCr at 12, 18, 24, 30, and 36 months after HSCT.
Definitions and outcomes
We used the City of Hope criteria as published by Shayani et al. to retrospectively ascertain cases of TMA.10 TMA criteria included: SCr increase of ≥ 50% above the baseline value; serum LDH > two times the upper limit of normal; presence of schistocytes or nucleated red blood cells on two consecutive peripheral blood smears; and thrombocytopenia, defined as an absolute platelet count <50 × 109/L or a ≥50% decrease from the baseline value. Patients who met all four criteria were considered to have “definite TMA”. Patients who met three criteria were considered to have “probable TMA”. Patients with fewer than three criteria were considered “no TMA”.
The primary endpoint was overall survival (OS). Secondary endpoints included progression-free survival (PFS), non-relapse mortality (NRM), and renal dysfunction. OS and PFS were previously defined elsewhere.11 NRM was defined as death without recurrent or progressive disease after stem cell infusion. Renal dysfunction was defined as doubling of SCr relative to the baseline value or need for renal replacement therapy (RRT). Kidney dysfunction-free survival was defined as the time from HSCT to death, date of doubling of SCr, or date of initiation of RRT, whichever occurred first. Patients who were alive without doubling of SCr or RRT were censored at the time last seen alive without one of these events for the kidney dysfunction-free survival analysis.
Statistical analysis
Patient baseline characteristics were reported descriptively and compared using Fisher’s exact test, Chi-square test, or Wilcoxon Rank Sum test, as appropriate. The Kaplan-Meier method was used to estimate OS and PFS. The cumulative incidence of NRM and relapse was estimated in the context of competing risks frameworks since NRM and relapse were competing events with one another. In addition, the cumulative incidence of TMA, doubling of SCr, and RRT were estimated in the competing risks framework considering death without the respective event (TMA, doubling of SCr, and RRT) as a competing event. The Log-rank and Gray tests12 were used to compare Kaplan-Meier estimates and estimates of the cumulative incidence of NRM and relapse, respectively.
In addition, for all time-to-event endpoints, multivariable analysis using Cox regression models was performed treating the occurrence of TA-TMA as a time-dependent variable and adjusting for age, donor-recipient gender mismatch, donor type, cell source, GVHD prophylaxis regimen, HSCT-treated disease, disease risk index (DRI), and CMV serostatus. Multivariable models were stratified by conditioning intensity, as the proportional hazards assumption did not hold for conditioning intensity. The incidence of TMA that occurred after relapse was not included in the analysis of time-to-PFS. Landmark analysis at 6 months post-HSCT was also performed which excluded all deaths or relapses occurring within 6 months post-HSCT. To identify potential risk factors for TMA, competing risk regression analysis was performed by treating death without the development of TMA as a competing event. All analyses were performed using SAS 9.3 (SAS Institute Inc., Cary, NC), and R version 3.2.2 (the CRAN project, www.cran.r-project.org). Multiplicity was not considered and the significance level was set to 0.05.
Results
Patient characteristics
Baseline characteristics of the 1,990 patients who underwent allogeneic HSCT from 2005 through 2013 are shown in Table 1. The median age for the entire cohort was 53 years (range 17 to 74 years). There was no difference in median age between patients with and without TMA. None of the baseline comorbidities showed a significant difference between TMA groups. Patients with TMA were more likely to have received myeloablative conditioning, total body irradiation, mismatched HSCT and have high or very high DRI at baseline. In addition, aGVHD prophylaxis with a calcineurin inhibitor (CNI) in combination with sirolimus +/− other immunosuppressants was more common than other prophylactic regimens in patients who developed TMA.
Table 1.
Patient demographics and baseline characteristics
| All (N=1,990) | No TMA (N=1,224) | Definite TMA (N=258) | Probable TMA (N=508) | |
|---|---|---|---|---|
|
| ||||
| N (%) | N (%) | N (%) | N (%) | |
| Age (years), median (range) | 53 (17, 74) | 54 (18, 74) | 52 (18, 73) | 53 (17, 73) |
| Recipient Gender (Male) | 1,154 (58) | 732 (59.8) | 150 (58.1) | 272 (53.5) |
| Donor Gender (Male) | 1,208 (60.7) | 728 (59.5) | 154 (59.7) | 326 (64.2) |
| Female recipient/Male donor | 428 (21.5) | 276 (22.5) | 61 (23.6) | 91 (17.9) |
| Diagnosis | ||||
| AML | 734 (36.9) | 435 (35.5.) | 107 (41.5) | 192 (37.8) |
| ALL | 179 (9) | 96 (7.8) | 34 (13.2) | 49 (9.6) |
| MDS, MPD | 319 (16.1) | 183 (14.9) | 40 (15.6) | 96 (18.9) |
| CLL, SLL, PLL | 161 (8.1) | 115 (9.4) | 14 (5.4) | 32 (6.3) |
| CML | 79 (4) | 52 (4.2) | 12 (4.7) | 15 (3) |
| Hodgkin Disease | 71 (3.6) | 57 (4.7) | 4 (1.6) | 10 (2) |
| NHL | 317 (15.9) | 206 (16.8) | 35 (13.6) | 76 (15) |
| MM | 54 (2.7) | 39 (3.2) | 2 (0.8) | 13 (2.6) |
| Other Diseases | 76 (3.9) | 41 (3.3) | 10 (3.9) | 25 (4) |
| Baseline Comorbidities | ||||
| Hypertension (Yes) | 427 (21.5) | 253 (20.7) | 68 (26.4) | 106 (20.9) |
| Diabetes Mellitus (Yes) | 152 (7.6) | 83 (6.8) | 19 (7.4) | 50 (9.8) |
| Congestive Heart Failure | 25 (1.3) | 12 (1) | 5 (1.9) | 8 (1.6) |
| Coronary Artery Disease (Yes) | 92 (4.6) | 56 (4.6) | 15 (5.8) | 21 (4.1) |
| Cirrhosis (Yes) | 5 (0.3) | 2 (0.2) | 2 (0.8) | 1 (0.2) |
| Chronic Lung Disease (Yes) | 32 (1.6) | 19 (1.6) | 5 (1.9) | 8 (1.6) |
| Proteinuria | ||||
| Positive | 82 (4.3) | 40 (3.3) | 16 (6.2) | 29 (5.7) |
| Unknown | 120 (6) | 88 (7.2) | 11 (4.3) | 21 (4.1) |
| HLA type (A, B, DRB1) | ||||
| Matched unrelated | 990 (49.7) | 599 (48.9) | 122 (47.3) | 269 (53) |
| Matched related | 679 (34.1) | 454 (37.1) | 68 (26.4) | 157 (30.9) |
| Mismatch unrelated | 293 (14.7) | 152 (12.4) | 62 (24) | 79 (15.6) |
| Mismatch related | 28 (1.4) | 19 (1.6) | 6 (2.3) | 3 (0.6) |
| Cell source | ||||
| BM and PBSC* | 1,855 (93.2) | 1,157 | 221 (85.7) | 477 (93.9) |
| Cord blood | 135 (6.8) | 67 (5.5) | 37 (14.3) | 31 (6.1) |
| Conditioning regimen (MAC) | 769 (38.6) | 434 (35.5) | 120 (46.5) | 215 (42.3) |
| TBI contained (No) | 667 (33.5) | 364 (29.7) | 116 (45) | 187 (36.8) |
| Donor-recipient CMV serostatus | ||||
| D−/R− | 657 (33) | 438 (35.8) | 82 (31.8) | 137 (27) |
| D−/R+ | 594 (29.8) | 336 (27.5) | 90 (34.9) | 168 (33.1) |
| D+/R− | 287 (14.4) | 188 (15.4) | 23 (8.9) | 76 (15) |
| D+/R+ | 445 (22.4) | 258 (21.1) | 63 (24.4) | 124 (24.4) |
| Unknown | 7 (0.4) | 4 (0.3) | 0 | 3 (0.6) |
| Disease Risk Index | ||||
| Low | 363 (18.2) | 252 (20.6) | 35 (13.6) | 76 (15) |
| Intermediate | 1030 (51.8) | 646 (52.8) | 135 (52.3) | 249 (49) |
| High | 505 (25.4) | 281 (23) | 69 (26.7) | 155 (30.5) |
| Very high | 80 (4) | 39 (3.2) | 19 (7.4) | 22 (4.3) |
| Unknown | 12 (0.6) | 6 (0.5) | 0 | 6 (1.2) |
| GVHD prophylaxis | ||||
| CNI+/−Other | 76 (3.8) | 49 (4) | 9 (3.5) | 18 (3.5) |
| CNI/MTX | 613 (30.8) | 399 (32.6) | 62 (24) | 152 (29.9) |
| CNI/MTX+Other | 98 (4.9) | 58 (4.7) | 8 (3.1) | 32 (6.3) |
| CNI/Sirolimus+/−Other | 527 (26.5) | 271 (22.1) | 111 (43) | 145 (28.5) |
| CNI/Sirolimus/MTX | 609 (30.6) | 409 (33.4) | 56 (21.7) | 144 (28.3) |
| Other+ | 67 (3.4) | 38 (3.1) | 12 (4.7) | 17 (3.4) |
Includes only BM, only PBMC, and mixed BM and PBMC.
Other GVHD prophylaxis includes mycophenolate mofetil, bortezomib, anti-thymocyte globulin, CD34 selection, CD8 T-cell depletion, corticosteroids, and ex vivo T-cell depletion.
Abbreviations: ALL, acute lymphoblastic leukemia; AML, acute myeloid leukemia; BM, bone marrow; CNI, calcineurin inhibitors; CLL, chronic lymphocytic leukemia; CMV, cytomegalovirus; GVHD, graft-versus-host disease; MAC, myeloablative conditioning; MDS, myelodysplastic syndrome; MM, multiple myeloma; MPD, myeloproliferative disorders; MTX, methotrexate; NHL, Non-Hodgkin lymphoma; PBSC, peripheral blood stem cell; PLL, prolymphocytic leukemia; RIC, reduced-intensity conditioning; SLL, small lymphocytic lymphoma; TBI, total body irradiation.
p-values are not included to avoid misinterpretation of p-values due to large sample size.
Incidence of TMA and time to TMA onset
Of 1,990 patients, 258 (13%) patients met criteria for definite TMA and 508 (26%) patients met criteria for probable TMA. The median time to TMA onset following HSCT was 1.2 months (range, 0.2 to 5.7 months) for definite TMA and 0.7 months (range, 0.2 to 5.7 months) for probable TMA. Among patients with definite and probable TMA, 45% and 70%, respectively, experienced TMA onset within the first month following HSCT (Figure 1A). The incidence rate for TMA varied by year of transplantation (2005 to 2013), ranging from 9.2 to 19% for definite TMA and 18.8 to 30% for probable TMA (Figure 1B). Among the 258 patients with definite TMA, 27 (11%) experienced more than one TMA episode within 6 months of HSCT. Among the 508 patients with probable TMA, 55 (11%) experienced more than one TMA episode. Of the 258 patients with definite TMA, 17 met criteria for thrombocytopenia based on a relative decrease in the platelet count >50% from the baseline value, and 241 patients met criteria based on an absolute decline in the platelet level to <50 × 109/L.
Figure 1. TMA onset and incidence.

(A) Time to TMA onset within first 6 months after HSCT. Most of the patients developed TMA within the first month after transplantation. (B) Figure displays incidence of TMA over the study period. The incidence of definite TMA ranged from 9.2–19% and incidence of probable TMA ranged from 18.8–30%.
We performed a manual chart review to identify those patients who were diagnosed clinically with TMA. Among the 258 patients with definite TMA according to our diagnostic criteria, only 45 patients (17%) were diagnosed with TMA as per their chart. Among those 45 patients, 29 had their calcineurin inhibitor (CNI) therapy withdrawn, and 7 had their CNI therapy withdrawn and therapeutic plasma exchange performed. Two patients had therapeutic plasma exchange alone, 1 patient had both CNI and sirolimus therapy withdrawn, and 3 patients had only sirolimus therapy withdrawn. Among the 3 remaining patients who did not receive an intervention for TMA, 1 patient died immediately after the diagnosis, and the other 2 patients had active GVHD.
Among patients who met criteria for definite or probable TMA, 20% and 40%, respectively, developed TMA prior to absolute neutrophil count engraftment, while 32% and 56%, respectively, developed definite and probable TMA prior to platelet engraftment. Among patients who met our diagnostic criteria for TMA prior to neutrophil engraftment, 9% were diagnosed in real time. Among patients who met our diagnostic criteria for TMA prior to platelet engraftment, 16% were diagnosed by the treating physician. (Table S1)
Risk factors for development of TMA
We performed competing risk regression analyses to identify risk factors for the development of definite and probable TMA. Mismatched donor transplantation (sub-distribution hazard ratio [sHR]: 1.79, 95% confidence interval [CI] 1.17, 2.75, p=0.007), sirolimus-containing aGVHD prophylaxis (sHR: 1.73, 95%CI 1.29, 2.34, p<0.001), myeloablative conditioning (sHR: 1.93, 95%CI 1.38, 2.68, p<0.001), and high baseline LDH level (sHR: 1.64, 95%CI 1.26, 2.13, p<0.001) were associated with higher risk for developing definite TMA. Furthermore, positive CMV serostatus (sHR: 1.41, 95%CI 1.16, 1.71, p<0.001), high and very high disease risk index (sHR: 1.48, 95%CI 1.12, 1.96, p=0.007), and high baseline LDH level (sHR: 1.25, 95%CI 1.05, 1.49, p=0.011) were associated with higher risk for developing probable TMA (Table 2).
Table 2.
Risk factors for development of TMA
| Definite TMA | Probable TMA | |||||||
|---|---|---|---|---|---|---|---|---|
|
| ||||||||
| sHR | 95% CI | p-value | sHR | 95% CI | p-value | |||
| Age | 1.00 | 0.99 | 1.02 | 0.420 | 1.00 | 0.99 | 1.01 | 0.710 |
| Female donor with male recipient vs Other | 1.08 | 0.80 | 1.46 | 0.600 | 0.84 | 0.67 | 1.05 | 0.120 |
| MUD vs MRD | 1.28 | 0.95 | 1.72 | 0.110 | 1.19 | 0.98 | 1.45 | 0.077 |
| MM vs MRD | 1.79 | 1.17 | 2.75 | 0.007 | 1.22 | 0.89 | 1.66 | 0.210 |
| Myeloid vs Other | 1.09 | 0.82 | 1.45 | 0.550 | 0.96 | 0.79 | 1.16 | 0.640 |
| CMV serostatus: (+) vs (−) | 1.07 | 0.82 | 1.38 | 0.620 | 1.41 | 1.16 | 1.71 | <.001 |
| DRI: Intermediate vs Low | 1.24 | 0.86 | 1.81 | 0.250 | 1.15 | 0.90 | 1.49 | 0.270 |
| DRI: High/Very high vs Low | 1.31 | 0.87 | 1.98 | 0.190 | 1.48 | 1.12 | 1.96 | 0.007 |
| PBSC vs BM | 1.11 | 0.63 | 1.94 | 0.730 | 1.05 | 0.73 | 1.49 | 0.800 |
| Cord vs BM | 1.61 | 0.77 | 3.37 | 0.210 | 0.81 | 0.48 | 1.37 | 0.440 |
| Sirolimus-containing GVHD prophylaxis | 1.73 | 1.29 | 2.34 | <.001 | 1.11 | 0.92 | 1.34 | 0.280 |
| MAC vs RIC | 1.93 | 1.38 | 2.68 | <.001 | 1.20 | 0.97 | 1.49 | 0.089 |
| High Baseline LDH+ vs Low | 1.64 | 1.26 | 2.13 | <.001 | 1.25 | 1.05 | 1.49 | 0.010 |
Abbreviations: BM, bone marrow; CMV, cytomegalovirus; DRI, disease risk index; MAC, myeloablative conditioning; MM, related or unrelated HLA mismatched; MRD, matched related donor; MUD, matched unrelated donor; PBSC, peripheral blood stem cell; RIC, reduced-intensity conditioning, sHR: sub-distribution hazard ratio.
Baseline LDH level was dichotomized as high if above median and low if below median.
Impact of TMA on survival, renal and transplant outcomes
The median follow-up time among survivors was 48.2 months (range, 12 to 146 months). Definite TMA was significantly associated with worse OS, PFS, NRM, and kidney dysfunction-free survival. In multivariable analyses, definite and probable TMA were both independently associated with shorter OS: HR: 5.24 (95%CI 4.43, 6.20, p<0.001) for definite versus no TMA and HR: 2.12 (95%CI 1.84, 2.44, p<0.001) for probable versus no TMA. (Table 3). Non-relapse mortality was the cause of death in 54%, 41%, and 35% of patients with definite, probable, and no TMA, respectively. Among patients with definite TMA, causes of death were primary disease (46%), veno-occlusive disease (13%), respiratory failure (12%), GVHD (10%), infection (6%), other causes (12%), and unknown (1%). There was no apparent difference in the frequency of deaths due to GVHD, infection, or other causes between patients with definite, probable, and no TMA. (Figure 2).
Table 3.
Impact of TMA on clinical outcomes of HSCT
| Outcomes | TMA | HR | 95% CI | p-value | |
|---|---|---|---|---|---|
| Overall Survival (OS) | No | Ref | |||
| Probable TMA | 2.12 | 1.84 | 2.44 | <.001 | |
| Definite TMA | 5.24 | 4.43 | 6.20 | <.001 | |
| Progression-free survival (PFS) | No | Ref | |||
| Probable TMA | 1.51 | 1.32 | 1.73 | <.001 | |
| Definite TMA | 3.26 | 2.75 | 3.87 | <.001 | |
| Non-relapse mortality (NRM) | No | Ref | |||
| Probable TMA | 2.62 | 2.05 | 3.35 | <.001 | |
| Definite TMA | 10.44 | 8.03 | 13.57 | <.001 | |
| Kidney dysfunction-free survival* | No | Ref | |||
| Probable TMA | 2.20 | 1.92 | 2.51 | <.001 | |
| Definite TMA | 5.43 | 4.61 | 6.40 | <.001 | |
Abbreviations:
CI, confidence interval; HR, hazard ratio.
Kidney dysfunction: doubling of serum creatinine or renal replacement therapy.
Figure 2. Cause of death according to TMA.

(A) Among patients with definite TMA, 46% of them died because of the primary disease. (B) Among patients with probable TMA, 59% of them died because of the primary disease. (C) Among patients without TMA, 65% of them died because of the primary disease and non-relapse related mortality was lower compared to patients with definite and probable TMA. (D) Among all patients, 61% of them died because of primary disease.
The cumulative incidence of doubling of SCr or need for RRT was calculated for the definite TMA, probable TMA, and no TMA groups. The cumulative incidence of RRT at 6 months post-HSCT was significantly higher in patients with definite TMA (15%) and probable TMA (2%) as compared with patients without TMA (0.16%) (p<0.001). Moreover, patients with definite and probable TMA continued to have a higher cumulative incidence of RRT beyond 6 months post-HSCT. The cumulative incidence of RRT at 2 years post-HSCT was 17% and 3% in patients with definite TMA and probable TMA, respectively, as compared with patients without TMA (0.4%) (p<0.001) (Figure 3A). The cumulative incidence of kidney dysfunction at 6 months post-HSCT was also significantly higher in patients with TMA compared with patients without TMA: 29% in patients with definite TMA, 15% in patients with probable TMA, and 5.6% in patients without TMA (p<0.001). The cumulative incidence of kidney dysfunction at 2 years was 31% in patients with definite TMA, 16% in patients with probable TMA, and 7.4% in patients without TMA (p<0.001) (Figure 3B). These values are not adjusted for the time of TMA onset. Among patients with TMA, 3 patients with definite and 2 patients with probable TMA received kidney transplantation after developing TMA.
Figure 3. Renal outcome according to TMA.

(A) The cumulative incidence of RRT at 6 months was the highest among patients with definite TMA and lowest among patients without TMA (p<0.001). (B) The cumulative incidence of kidney dysfunction at 6 months was the highest among patients with definite TMA and lowest among patients without TMA (p<0.001).
Among the 258 patients with definite TMA, 104 (40%) were also diagnosed with grade II–IV aGVHD: 49 patients developed aGVHD prior to TMA onset and 55 developed aGVHD after TMA onset. In comparison, grade II–IV aGVHD occurred in 32% of patients with probable TMA and 25% of patients without TMA. In multivariable Cox regression analysis of OS treating TMA and aGVHD as time-dependent variables, patients with definite TMA and grade II–IV aGVHD had a 5.93-fold higher risk of death (95%CI 4.69, 7.51, p<0.001) compared with patients without TMA and without grade II–IV aGVHD. Patients with definite TMA without grade II–IV aGVHD had a 4.76-fold higher risk of death (95%CI 3.85, 5.88, p<0.001) compared with patients without TMA and without grade II–IV aGVHD. Additional comparisons between patients with and without TMA and aGVHD are shown in Figure 4.
Figure 4. Hazard ratios for OS according to TMA and Grade II–IV aGVHD.
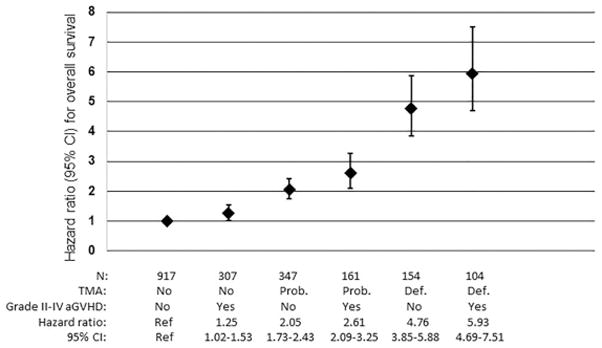
Patients with TMA had higher mortality compared with patients with Grade II–IV aGVHD. Among patients with TMA, patients with definite TMA had higher mortality compared with patients with probable TMA. TMA and Grade II–IV aGVHD showed an additive effect on risk for mortality. Patients with both definite TMA and Grade II–IV aGVHD showed the highest mortality compared with patients without TMA or Grade II–IV aGVHD.
Landmark analysis
Among the 258 patients with definite TMA, only 81 (39.5%) were alive and disease-free at 6 months after HSCT, and among the 508 patients with probable TMA, 304 (59.8%) were alive and disease-free at 6 months after HSCT. In contrast, among patients with “no TMA”, 79% were alive and disease-free at 6 months after HSCT. To assess the long-term outcome for those survived beyond 6 months, we performed a landmark analysis. In the landmark analysis restricted to patients who were alive and disease-free at 6 months after HSCT, patients with definite TMA had the worst OS, PFS, and NRM at 4 years post-HSCT. 4-year OS was 55% (95%CI 44%, 66%) and 62% (95%CI 55%, 67%) for patients with definite and probable TMA, respectively, compared to 74% (95%CI 71%, 77%) in patients without TMA (p<0.001) (Table 4 and Figure 5). The PFS is slightly higher than OS in patients with definite TMA because TMA events that occurred after relapse were not counted towards the PFS. This is also true for patients with probable TMA. The cumulative incidence of NRM was also significantly higher in patients with definite TMA (4-year estimate: 34%, 95%CI 24%, 45%, p<0.001) and probable TMA (4-year estimate: 20%, 95%CI 15%, 25%, p<0.001) compared with patients without TMA (4-year estimate: 11%, 95%CI 9%, 13%) (Table 4). The cumulative incidence of relapse was lower in patients with definite TMA. This is because many patients with definite TMA died early from other causes (non-relapse related mortality) which was a competing event of relapse and thus not many patients were at risk for relapse (Table 4).
Table 4.
Landmark analysis at 6 months after HSCT
| Clinical TMA | N | 4y OS (95% CI) | 4y PFS (95% CI) | 4y NRM (95% CI) | 4y Relapse (95% CI) |
|---|---|---|---|---|---|
| No | 965 | 74% (71%, 77%) | 66% (62%, 69%) | 11% (9%, 13%) | 23% (20%, 26%) |
| Probable | 304 | 62% (55%, 67%) | 59% (52%, 64%) | 20% (15%, 25%) | 22% (17%, 26%) |
| Definite | 81 | 55% (44%, 66%) | 56% (44%, 66%) | 34% (24%, 45%) | 10% (5%, 18%) |
| p-value | |||||
| Probable vs. No TMA | <0.001 | 0.048 | 0.001 | 0.310 | |
| Definite vs. No TMA | <0.001 | 0.010 | <0.001 | 0.009 | |
Abbreviations: NRM, non-relapse mortality; OS, overall survival; PFS, progress-free survival.
Figure 5. Landmark analysis at 6 months post-HSCT.

Numbers under the graphs represent patient number at risk. (A) Landmark analysis for OS at 6 months post-HSCT for patients with no TMA, probable TMA and definite TMA. The No TMA group had the best results for OS and the definite TMA group had the worst results for OS (p<0.001). (B) Patients who developed TMA after relapse were excluded from the analysis. Patients with definite TMA had the worst PFS outcome compared with patients with probable or no TMA (p=0.047). (C) Patients with definite TMA had the highest probability for non-relapse mortality (NRM) (p<0.001). (D) After excluding patients who developed TMA after relapse, the group with definite TMA showed significantly lower risk of developing relapse compared with patients with probable TMA and without TMA (p=0.025).
Prognostic factors of survival after development of TMA
To assess how long patients survived after developing TMA, we estimated the OS from TMA onset among patients who developed TMA. Overall survival was poor for patients with definite TMA. Median survival time after TMA onset was 2.4 months (95%CI 1.4, 3.4 months) for patients with definite TMA and 20 months (95%CI 14.9, 26 months) for patients with probable TMA (p<0.001) (Figure 6A).
Figure 6. Overall survival from onset of TMA: patients with TMA only.

Numbers under the graphs represent patient number at risk. (A) Patients with definite TMA had significantly lower OS after the onset of TMA (p<0.001). (B) Sirolimus-containing aGVHD prophylaxis was associated with better OS in the definite TMA group compared with patients with definite TMA without sirolimus exposure. Sirolimus exposure was not associated with a significant difference in OS for patients with probable TMA. (C) Patients who experienced TMA after relapse showed poorer OS regardless of TMA severity (p<0.001).
We performed multivariable Cox regression analyses to identify predictors of survival in patients who developed TMA. Among patients with definite TMA, female donor with male recipient and mismatched donor transplantation were associated with higher risk for death (HR: 1.55, 95%CI 1.09, 2.20, p=0.015 and HR: 1.69, 95%CI 1.04, 2.76, p=0.034, respectively) (Table 5). However, among patients who developed definite TMA, sirolimus exposure was associated with reduced risk of death (HR: 0.62, 95%CI 0.45, 0.84, p=0.002) compared with no sirolimus exposure. Based on this finding, we investigated further the impact of sirolimus. Among patients with definite TMA, 4-yr OS was 24% in patients with sirolimus exposure and 8% in patients without sirolimus exposure (p<0.001). However, sirolimus exposure was not associated with a significant difference in OS among patients with probable TMA (Figure 6B).
Table 5.
Prognostic factors for overall survival after development of TMA
| Among definite TMA | Among probable TMA | |||||||
|---|---|---|---|---|---|---|---|---|
|
| ||||||||
| HR | 95% CI | p-value | HR | 95% CI | p-value | |||
| Recipient Age | 1.01 | 1.00 | 1.03 | 0.058 | 1.01 | 1.00 | 1.03 | 0.016 |
| Female donor with male recipient vs Other | 1.55 | 1.09 | 2.20 | 0.015 | 1.29 | 0.97 | 1.72 | 0.090 |
| MUD vs MRD | 1.27 | 0.89 | 1.8 | 0.190 | 0.98 | 0.76 | 1.28 | 0.900 |
| MM vs MRD | 1.69 | 1.04 | 2.76 | 0.034 | 0.97 | 0.64 | 1.47 | 0.880 |
| Myeloid vs Other | 0.77 | 0.56 | 1.08 | 0.130 | 1.05 | 0.79 | 1.38 | 0.750 |
| PBSC vs BM | 1.09 | 0.56 | 2.12 | 0.810 | 1.21 | 0.68 | 2.13 | 0.520 |
| Cord blood vs BM | 0.88 | 0.40 | 1.96 | 0.760 | 2.14 | 0.99 | 4.63 | 0.050 |
| MAC vs RIC | 1.42 | 1.00 | 2.02 | 0.050 | 0.98 | 0.73 | 1.31 | 0.890 |
| Sirolimus containing aGVHD prophylaxis vs No | 0.62 | 0.45 | 0.84 | 0.002 | 0.99 | 0.78 | 1.25 | 0.930 |
| DRI: Intermediate vs Low | 1.42 | 0.88 | 2.29 | 0.150 | 2.08 | 1.34 | 3.2 | 0.001 |
| DRI: High/Very high vs Low | 1.67 | 0.96 | 2.9 | 0.070 | 3.65 | 2.28 | 5.84 | <.001 |
| CMV serostatus: (+) vs (−) | 0.9 | 0.7 | 1.3 | 0.950 | 1.1 | 0.8 | 1.4 | 0.390 |
Abbreviations: BM, bone marrow; CMV, cytomegalovirus; DRI, disease risk index; MAC, myeloablative conditioning; MM, related or unrelated HLA mismatched; MRD, matched related donor; MUD, matched unrelated donor; PBSC, peripheral blood stem cell; RIC, reduced-intensity conditioning.
Development of TMA after disease relapse was another factor associated with poor survival. Among 74 patients who experienced TMA after relapse of their underlying hematologic malignancy, 52 cases (70.3%) occurred within a month of relapse. For the analysis of OS from the time of onset of TMA, patients who experienced TMA before relapse had better OS compared with patients who experienced TMA after relapse: 4-yr OS was 21% vs. 0%, respectively, in patients with definite TMA (p<0.001) and 41% vs. 5%, respectively, in patients with probable TMA (p<0.001) (Figure 6C).
Discussion
To our knowledge, this is the largest cohort of HSCT patients to be assessed systematically and characterized for the development of TMA. Amongst 1,990 adult patients transplanted from 2005 through 2013, of whom over 97% received a CNI and 57% received sirolimus with a CNI as GVHD prophylaxis, we identified 258 (13%) cases of definite and 508 (26%) cases of probable TMA according to the City of Hope criteria, for an overall incidence of 39%. This incidence appears to be comparable to that reported by Shayani et al. at the City of Hope, where they observed 30/177 (24%) meeting the same TMA criteria. In a prospective study of 100 children and young adults, the incidence of TMA was reported to be 39% using a different set of diagnostic criteria.13 We also acknowledge that the incidence of TMA at our institution may be higher than that of other centers because of the frequent use of sirolimus at our center. We started to apply our diagnostic criteria from the first two weeks after HSCT. HSCT could cause some of the findings without TMA development. Therefore, TMA development in the early period after transplantation should be interpreted cautiously.
Our analyses confirm that the development of TMA, especially “definite TMA”, is associated with a significant negative impact on OS, PFS, NRM, and kidney dysfunction-free survival. Even among the approximately 40% of definite TMA patients who survived their TMA and were cancer-free 6 months after HSCT, long-term outcomes in these TMA survivors were poor compared with patients without TMA, as demonstrated in our landmark analysis. The association between TMA and decreased OS has also been reported in previous studies of TMA.14
An important goal of our study was to assess the impact of TMA on long-term renal outcomes. To this end, we found that the cumulative incidence of RRT at 2 years was significantly higher in patients with definite and probable TMA compared with patients without TMA. RRT was used for the treatment of both acute and chronic renal dysfunction. Our findings are concordant with previous reports showing that patients with TMA have a higher risk for CKD as compared with patients without TMA.9 The impact of TMA on the kidneys has also been demonstrated in tissue biopsies of deceased patients. Among 314 renal biopsies from autopsies of patients who died after undergoing HSCT, 20% of the biopsies showed evidence of TMA.15 Radiation exposure and CNI use can also cause kidney injury without development of TMA. Although our diagnostic criteria included microangiopathic hemolytic anemia and thrombocytopenia in addition to kidney dysfunction, the impact of those conditions on kidney function should be considered.
A limitation in studying TMA is the lack of consensus on the clinical diagnostic criteria. Tissue biopsy would be ideal to improve the diagnostic yield of TMA, but this is not feasible in real-world practice since these patients are at high risk for bleeding complications. Furthermore, pathological lesions could be missed during biopsy as lesions could be patchy. TMA could also be intermittent: the lesions could occur in certain organs at different time points during the disease course. In our study, we chose to adopt the clinical criteria proposed by Shayani et al. from the City of Hope to categorize patients with definite vs. probable TMA based on the fact that their diagnostic criteria included the most common TMA features reported in the literature (increased LDH level, persistent schistocytes/nucleated RBCs, prolonged or progressive thrombocytopenia, and concurrent renal dysfunction). Consistent with their results, we found that patients with probable TMA had better outcomes compared with patients with definite TMA. However, it is important to note that the outcomes among patients with probable TMA were inferior compared to patients without TMA. These results suggest that even in patients with probable TMA, increased vigilance and earlier intervention should be considered.
As many of the TMA cases in our cohort were retrospectively identified by applying a set of criteria, and not diagnosed as TMA in the chart, we believe that TMA is underdiagnosed in clinical practice. Our findings, especially since cases of “probable TMA” were also associated with poorer outcomes, suggest the importance of raising clinician awareness to the possibility of TMA when patients have elevated LDH, schistocytosis, low platelets, and serum creatinine elevation, and promoting earlier interventions, such as strict blood pressure management and cessation of CNI, sirolimus, or other nephrotoxic drugs, that might improve clinical outcomes.
Another finding from our study was the significant difference in survival among patients who developed TMA in the context of sirolimus use. Patients with definite TMA had very poor OS after TMA onset. However, the patients with definite TMA in our cohort who were concurrently on a sirolimus-containing GVHD regimen had significantly better OS compared to those who were not on sirolimus. Our results thus confirm our previous observation of the effect of sirolimus on a much larger scale.16 The underlying pathophysiology of TMA associated with sirolimus (used in conjunction with CNI) and why it appears to follow a less aggressive course is unclear. In our dataset, patients with sirolimus use had a lower aGVHD rate compared to patients with no sirolimus use. Since TMA and aGVHD is synergistic in poor outcome (Please see Figure 4), we speculate that the lower aGVHD rate with sirolimus might contribute to better survival. Also, it appears that TMA cases in the setting of sirolimus exposure are more likely to resolve upon cessation of the CNI and/or sirolimus.16
In our study group, patients who experienced TMA after relapse showed worse OS compared with patients who experienced TMA before relapse. Interventions to treat relapse could introduce additional risk factors for the development of TMA and death. However, previous relapse history in patients with TMA could still be considered as a risk factor for death despite those additional risk factors.
Our study is limited by its retrospective nature, and by the fact that it is a single institution cohort restricted to mostly Caucasian patients which includes very few patients from other ethnicities who may have greater genetic susceptibilities for higher mortality after developing TMA.17 Retrospective studies carry the possibility of missing data on potential confounders or differential loss to follow up which can bias the study and might result in the over or underdiagnosis of TMA cases. Another limitation is that this study spanned a 9-year period during which changes in clinical practice and the introduction of complement blockade therapies could have affected clinical outcomes. All of our TMA cases were ascertained based on clinical criteria as very few patients had kidney biopsies to confirm their TMA diagnosis. Also, since TMA is a heterogeneous condition, a further characterization of subphenotypes (drug-induced, infection-induced TMA etc.) would be helpful.
In summary, in this large retrospective cohort study of 1,990 consecutive allogeneic transplant patients over a recent 9-year period, we found that TA-TMA was relatively common and that many cases, especially milder cases, were often underdiagnosed. Sirolimus use in conjunction with CNI use is associated with a higher risk for developing TMA, but these sirolimus-associated TMA cases appear to have better outcomes compared with non-sirolimus TMA cases. Future studies are needed to evaluate risk factors for TMA, including genetic variations that might predispose patients to TMA development and potential biomarkers that could aid in early diagnosis. Development of biomarkers that could supplement clinical criteria would represent a major advance toward the accurate diagnosis of patients affected by this condition.
Supplementary Material
Highlights.
TA-TMA is an underdiagnosed condition in adult patients undergoing HSCT.
TA-TMA associated with poor survival and long-term renal outcomes.
Among TMA cases, sirolimus exposure was associated with improved survival.
Acknowledgments
Financial disclosure: Alexion Pharmaceuticals Inc. supported this study through a (un)restricted grant and had no involvement in the development of this manuscript other than providing cursory medical review.
Conflict of interest statement: This study was supported (in part) by a research grant from Alexion Pharmaceuticals, Inc. (R.A.) The remaining authors declare no relevant financial conflicts of interest.
Authorship contribution: M.P. contributed to the study design, performed chart review and data collection, and wrote the manuscript; H.T.K. contributed to the study design, performed the statistical analysis, contributed to the interpretation of the results and writing of the manuscript; F.O. contributed to the study design and performed chart review; O.A.Y, B.C.B and S.K.-W performed chart review and data collection; R.S., J.R., J.H.A., E.A., J.K., P.A. and C.C. provided clinical data; J.M.P and D.E.L. contributed to the study design, provided intellectual advice and support, and critically revised the manuscript; V.T.H. contributed to the study design, maintained the DFCI BMT data repository, provided clinical data, supervised the study and contributed to the writing of the manuscript; R.A. designed the study, contributed to the writing of the manuscript, and supervised the study.
Footnotes
Publisher's Disclaimer: This is a PDF file of an unedited manuscript that has been accepted for publication. As a service to our customers we are providing this early version of the manuscript. The manuscript will undergo copyediting, typesetting, and review of the resulting proof before it is published in its final citable form. Please note that during the production process errors may be discovered which could affect the content, and all legal disclaimers that apply to the journal pertain.
References
- 1.George JN, Nester CM. Syndromes of thrombotic microangiopathy. N Engl J Med. 2014;371(7):654–666. doi: 10.1056/NEJMra1312353. [DOI] [PubMed] [Google Scholar]
- 2.Noris M, Remuzzi G. Atypical hemolytic-uremic syndrome. N Engl J Med. 2009;361(17):1676–1687. doi: 10.1056/NEJMra0902814. [DOI] [PubMed] [Google Scholar]
- 3.Ho VT, Cutler C, Carter S, et al. Blood and marrow transplant clinical trials network toxicity committee consensus summary: thrombotic microangiopathy after hematopoietic stem cell transplantation. Biol Blood Marrow Transplant. 2005;11(8):571–575. doi: 10.1016/j.bbmt.2005.06.001. [DOI] [PubMed] [Google Scholar]
- 4.George JN, Li X, McMinn JR, Terrell DR, Vesely SK, Selby GB. Thrombotic thrombocytopenic purpura-hemolytic uremic syndrome following allogeneic HPC transplantation: a diagnostic dilemma. Transfusion. 2004;44(2):294–304. doi: 10.1111/j.1537-2995.2004.00700.x. [DOI] [PubMed] [Google Scholar]
- 5.Oran B, Donato M, Aleman A, et al. Transplant-associated microangiopathy in patients receiving tacrolimus following allogeneic stem cell transplantation: risk factors and response to treatment. Biol Blood Marrow Transplant. 2007;13(4):469–477. doi: 10.1016/j.bbmt.2006.11.020. [DOI] [PubMed] [Google Scholar]
- 6.Rabinowe SN, Soiffer RJ, Tarbell NJ, et al. Hemolytic-uremic syndrome following bone marrow transplantation in adults for hematologic malignancies. Blood. 1991;77(8):1837–1844. [PubMed] [Google Scholar]
- 7.El-Bietar J, Warren M, Dandoy C, et al. Histologic Features of Intestinal Thrombotic Microangiopathy in Pediatric and Young Adult Patients after Hematopoietic Stem Cell Transplantation. Biol Blood Marrow Transplant. 2015;21(11):1994–2001. doi: 10.1016/j.bbmt.2015.06.016. [DOI] [PMC free article] [PubMed] [Google Scholar]
- 8.Kersting S, Koomans HA, Hene RJ, Verdonck LF. Acute renal failure after allogeneic myeloablative stem cell transplantation: retrospective analysis of incidence, risk factors and survival. Bone Marrow Transplant. 2007;39(6):359–365. doi: 10.1038/sj.bmt.1705599. [DOI] [PubMed] [Google Scholar]
- 9.Glezerman IG, Jhaveri KD, Watson TH, et al. Chronic kidney disease, thrombotic microangiopathy, and hypertension following T cell-depleted hematopoietic stem cell transplantation. Biol Blood Marrow Transplant. 2010;16(7):976–984. doi: 10.1016/j.bbmt.2010.02.006. [DOI] [PMC free article] [PubMed] [Google Scholar]
- 10.Shayani S, Palmer J, Stiller T, et al. Thrombotic microangiopathy associated with sirolimus level after allogeneic hematopoietic cell transplantation with tacrolimus/sirolimus-based graft-versus-host disease prophylaxis. Biol Blood Marrow Transplant. 2013;19(2):298–304. doi: 10.1016/j.bbmt.2012.10.006. [DOI] [PMC free article] [PubMed] [Google Scholar]
- 11.Armand P, Gibson CJ, Cutler C, et al. A disease risk index for patients undergoing allogeneic stem cell transplantation. Blood. 2012;120(4):905–913. doi: 10.1182/blood-2012-03-418202. [DOI] [PMC free article] [PubMed] [Google Scholar]
- 12.RJG A class of K-sample tests for comparing the cumulative incidence of a competing risk. Ann Stat. 1988;16:1140–1154. [Google Scholar]
- 13.Jodele S, Davies SM, Lane A, et al. Diagnostic and risk criteria for HSCT-associated thrombotic microangiopathy: a study in children and young adults. Blood. 2014;124(4):645–653. doi: 10.1182/blood-2014-03-564997. [DOI] [PMC free article] [PubMed] [Google Scholar]
- 14.Willems E, Baron F, Seidel L, Frere P, Fillet G, Beguin Y. Comparison of thrombotic microangiopathy after allogeneic hematopoietic cell transplantation with high-dose or nonmyeloablative conditioning. Bone Marrow Transplant. 2010;45(4):689–693. doi: 10.1038/bmt.2009.230. [DOI] [PubMed] [Google Scholar]
- 15.Changsirikulchai S, Myerson D, Guthrie KA, McDonald GB, Alpers CE, Hingorani SR. Renal thrombotic microangiopathy after hematopoietic cell transplant: role of GVHD in pathogenesis. Clin J Am Soc Nephrol. 2009;4(2):345–353. doi: 10.2215/CJN.02070508. [DOI] [PMC free article] [PubMed] [Google Scholar]
- 16.Cutler C, Henry NL, Magee C, et al. Sirolimus and thrombotic microangiopathy after allogeneic hematopoietic stem cell transplantation. Biol Blood Marrow Transplant. 2005;11(7):551–557. doi: 10.1016/j.bbmt.2005.04.007. [DOI] [PubMed] [Google Scholar]
- 17.Jodele S, Zhang K, Zou F, et al. The genetic fingerprint of susceptibility for transplant-associated thrombotic microangiopathy. Blood. 2016;127(8):989–996. doi: 10.1182/blood-2015-08-663435. [DOI] [PMC free article] [PubMed] [Google Scholar]
Associated Data
This section collects any data citations, data availability statements, or supplementary materials included in this article.