Abstract
Fetal exposure to gestational diabetes mellitus (GDM) predisposes children to future health complications including hypertension and cardiovascular disease. A key mechanism by which these complications occur is through the functional impairment of vascular progenitor cells, including endothelial colony-forming cells (ECFCs). Previously, we showed that fetal ECFCs exposed to GDM have decreased vasculogenic potential and altered gene expression. In this study, we evaluate whether transgelin (TAGLN), which is increased in GDM-exposed ECFCs, contributes to vasculogenic dysfunction. TAGLN is an actin-binding protein involved in the regulation of cytoskeletal rearrangement. We hypothesized that increased TAGLN expression in GDM-exposed fetal ECFCs decreases network formation by impairing cytoskeletal rearrangement resulting in reduced cell migration. To determine if TAGLN is required and/or sufficient to impair ECFC network formation, TAGLN was reduced and overexpressed in ECFCs from GDM and uncomplicated pregnancies, respectively. Decreasing TAGLN expression in GDM-exposed ECFCs improved network formation and stability as well as increased migration. In contrast, overexpressing TAGLN in ECFCs from uncomplicated pregnancies decreased network formation, network stability, migration, and alignment to laminar flow. Overall, these data suggest that increased TAGLN likely contributes to the vasculogenic dysfunction observed in GDM-exposed ECFCs, as it impairs ECFC migration, cell alignment, and network formation. Identifying the molecular mechanisms underlying fetal ECFC dysfunction following GDM exposure is key to ascertain mechanistically the basis for cardiovascular disease predisposition later in life.
Keywords: diabetes, endothelial, migration, progenitor, transgelin, vasculogenesis
INTRODUCTION
Children born to mothers with gestational diabetes mellitus (GDM) are at increased risk for developing chronic health complications including cardiovascular morbidities such as hypertension (2, 5, 7). Unfortunately, the mechanisms underlying the development of these long-term morbidities are unknown. To identify how acute exposure to maternal GDM in utero imparts a predisposition for vascular disease, fetal progenitor cells critical to vascular development are studied. One endothelial progenitor population, endothelial colony-forming cells (ECFCs), is highly proliferative, clonogenic and able to undergo vasculogenesis by forming perfused vessels upon transplantation in vivo (23, 44, 45). Importantly, ECFCs are present in the circulation and in vessel walls and are enriched in umbilical cord blood (22). Thus ECFCs are a possible source by which acute intrauterine exposure in utero may impart long-term vascular effects in the offspring.
Fetal ECFCs display significant functional impairments as a result of exposure to maternal diabetes in utero (3, 21). However, the molecular mechanisms underlying the observed phenotypic differences in number and function are largely unknown. Therefore, recent studies from our lab focused on the identification of differentially expressed genes in ECFCs obtained from diabetic pregnancies (4, 17). A genome-wide microarray analysis conducted on umbilical cord blood-derived ECFCs identified transgelin (TAGLN) as one of the genes significantly increased in fetal ECFCs exposed to GDM.
TAGLN, also known as smooth muscle protein 22α (SM22α), localizes primarily to the cytoplasm near actin filaments. TAGLN aids in the formation of actin bundles via polymerization of globular actin to filamentous actin and promotion of filamentous actin cross linking (12, 16, 19, 40). Thus TAGLN is involved in actin cytoskeletal rearrangement. The ability of cells comprising the vasculature to reorganize their cytoskeleton in response to external stimuli is a critical function. Specifically, endothelial cells can rearrange their cytoskeletons in response to mechanical forces, including exposure to laminar flow, by modulating intracellular signaling pathways and gene expression (6).
When TAGLN was discovered in 1987, it was considered smooth muscle specific (27). Therefore, abundant literature outlines the function of TAGLN in smooth muscle cells. However, despite subsequent identification of TAGLN expression in other cell types, including fibroblasts, mesenchymal, epithelial, and endothelial cells, limited studies have assessed the functional implications of TAGLN expression in those cell populations (26, 36). Therefore, the studies outlined in this article were designed to identify the impact of elevated TAGLN expression in fetal ECFCs obtained from pregnancies complicated by GDM.
MATERIALS AND METHODS
Umbilical cord blood sample acquisition.
Umbilical cord blood samples were collected at the time of birth following written informed consent from the mothers. Samples were obtained from women between 20 and 40 yr of age with uncomplicated pregnancies (UC) or pregnancies complicated with gestational diabetes (GDM). All pregnancies were single gestation. Infants with known chromosomal abnormalities were excluded. Women with preeclampsia or hypertension, women with other illnesses known to affect glucose metabolism, and women taking medications known to affect glucose metabolism were excluded. The Institutional Review Board at the Indiana University School of Medicine approved the protocol.
ECFC cell culture.
ECFCs were isolated from umbilical cord blood samples by the Indiana University Simon Cancer Center Angio BioCore as previously described (3). Eight independent preparations were used for both uncomplicated and gestational diabetes mellitus-exposed samples (UC: n = 8; GDM: n = 8). ECFCs were cultured in EBM2 medium (no. 3156; Lonza, Walkersille, MD) supplemented with EGM2 bullet kit (no. 3162; Lonza) and 10% hyclone fetal bovine serum (FBS; no. SH3007003; ThermoFisher, Waltham, MA). After ECFC colonies reached confluence, cells were detached with trypsin-EDTA (Invitrogen, Grand Island, NY) and frozen in 5% dimethyl sulfoxide (ThermoFisher) in FBS (Atlanta Biologicals, Flowery Branch, GA). ECFC aliquots were thawed, resuspended in endothelial growth media 2 (EGM2; Lonz) plus 10% FBS, and plated on type 1 collagen (Corning, Durham, NC)-coated flasks. ECFCs used in these studies were passaged two to five times.
Quantitative real-time PCR.
ECFCs were plated on collagen-coated cell culture dishes and lysed in Qiazol (Qiagen, Valencia, CA). RNA was obtained using the manufacturer’s instructions and reverse transcribed using the Transcriptor Universal cDNA Master Kit (Roche Applied Sciences, Indianapolis, Indiana). Reverse-transcriptase PCR was performed using a Lightcycler 480 (Roche Applied Sciences). Transcript levels were normalized to hypoxanthine phosphoribosyltransferase (HPRT) using the 2−ΔΔCt method. Studies were performed on samples in duplicate using Lightcycler 480 SYBR Green I Master Mix (Roche Applied Sciences) and the following primers: TAGLN: 5′-GGCAGCAGTGCAGAGGAC-3′ and 5′-TTATGCTCCTGCGCTTTCTT-3′; matrix metalloproteinase 9 (MMP9): 5′-GAACCAATCTCACCGACAGG-3′ and 5′-GCCACCCGAGTGTAACCATA-3′; and HPRT: 5′-CCTTGGTCAGGCAGTATAATCCA-3′ and 5′-GGTCCTTTTCACCAGCAAGCT-3′.
Western blotting.
Whole cell ECFC lysates were collected using radioimmunoprecipitation assay (RIPA) buffer containing mammalian protease inhibitor cocktail and phosphatase inhibitor cocktails 2 and 3 (Sigma-Aldrich, St. Louis, MO). Equal amounts of protein were separated by sodium dodecyl sulfate-polyacrylamide gel electrophoresis in 4–12% Bis-Tris precast gels (Life Technologies, Grand Island, NY). Protein was transferred onto nitrocellulose membrane, and immunoblotting performed with antibodies to TAGLN (1:5,000; ab14106; Abcam, Cambridge, MA), vinculin (1:100,000; VIN-11-5; Sigma-Aldrich), phospho-myosin light chain 2 (MLC2; 1:1,000; no. 3674 THr18/Ser19; Cell Signaling Technology, Danvers, MA), and total MLC2 (1:1,000; MYL12B, ab137063; Abcam). Secondary antibodies conjugated to horseradish peroxidase (goat anti-rabbit, no. 1706515; and goat anti-mouse, no. 1706516) were obtained from Bio-Rad (Hercules, CA), and blots were developed using Clarity Western ECL Substrate (Bio-Rad). Band intensity was quantified using ImageJ (NIH, Bethesda, MD).
siRNA transfections of ECFCs.
ECFCs were plated at 300,000 cells per 100-mm tissue culture dish in EGM2 + 10% FBS the day of transfection. Lipofectamine RNAiMAX (ThermoFisher Scientific) and short interfering RNA (siRNA) mixes were prepared in EBM2 (Lonza), and ECFCs were transfected with either TAGLN-specific (J-003714-08-0002; GE Dharmacon, Lafayette, CO) or a nontargeting control siRNA (D-001210-05-05; GE Dharmacon). The day following transfection, cell medium was changed. Two days posttransfection, cells were passaged and RNA was isolated to confirm knockdown for each transfection. Functional experiments were set up 3 days posttransfection, and additional protein lysates were collected to confirm knockdown.
Generation of lentivirus encoding TAGLN cDNA construct.
The lentiviral vector plasmid (pUC2CL6IPwo), packaging accessory plasmid (pCD/NL2), and envelope plasmid (pVSVG) were generous gifts from Helmut Hanenberg (Heinrich Heine University School of Medicine, Düsseldorf, Germany) (13). The TAGLN cDNA insert was amplified from ECFC-derived cDNA using the following primers: 5′-ATGGCCAACAAGGGTCCTTCC-3′ and 3′-ACTGATGATCTGCCGAGGTCG-5′. The TAGLN insert was then cloned into the pUC2CL6IPwo vector plasmid using the In-Fusion HD Cloning Kit (Takara Bio, Mountain View, CA) and the following primers: 5′-GCGGCCGCAACTCGAGATGGCCAACAAGGTCCT-3′ and 5′-TCTTAAGCTACGATCGGATTGACTACTAGACGGCTCCAGC-3′. Lentiviral particles were produced by transfection of Lenti-X 293T cells (Takara Bio) with either the pUC2CL6IPwo lentiviral vector (empty vector control) or the pUC2CL6IPwo lentiviral vector containing the TAGLN cDNA, in addition to the pCD/NL2 packaging accessory plasmid and the VSVG envelope plasmid using Fugene 6 (Roche Applied Science). All lentiviral vectors contain a puromycin resistance cassette, which enabled a 2-day selection of virally transduced ECFCs. Lentiviral supernatants were collected and filtered through a 0.45-μm asymmetric polyethersulfone filter unit (ThermoFisher). Supernatants were used immediately or stored at −80°C for future use.
Lentiviral transduction of ECFCs.
ECFCs were plated at 250,000 cells per 100-mm tissue culture dish the day before transduction. Lentiviral supernatant was added to each plate in a 1:10–1:50 dilution for a final volume of 6 ml of EGM2 + 10% FBS and incubated overnight. The medium was changed and the cells were incubated for 48 h. Transduced cells were selected in media containing 1 μg/ml puromycin (Life Technologies) for 2 days. Protein lysates were obtained as described, and TAGLN expression levels were confirmed for each transduction by Western blotting.
Matrigel assay.
ECFCs (passage 3–4) were plated at 400,000 cells per 100-mm dish and incubated overnight. The following day, ECFCs were trypsinized (ThermoFisher Scientific), counted on a hemocytometer, and plated at equal densities in EGM2. ECFCs were plated on 10 μl of Matrigel Basement Membrane Matrix lot no. 4209014 (no. 354234; Corning) in 15-well μ-slides (Ibidi, Fitchburg, WI). For single time point experiments, ECFCs were imaged by phase contrast microscopy 10 h postplating. Phase contrast images were obtained using a Spot camera (Spot Imaging Solutions, Sterling Heights, MI) on an Axiovert 35 microscope (Zeiss, Thornwood, NY). The number of closed networks per well was quantified, and average values are reported. For kinetic, multi-time point experiments, the Matrigel slide was placed in a Nikon TiE microscope stage-top incubator to maintain temperature, CO2, and humidity for overnight live cell imaging, similar to our recent studies (38, 39). Images of entire wells were collected with the ORCA-ER every 15 min for 10 h for a total of 40 data points per ECFC sample in each experiment. Kinetic experiments were conducted at the Indiana Center for Biological Microscopy (ICBM, Indianapolis, IN).
Proliferation assays.
ECFCs were plated at a density of 500,000 cells per 100-mm plate followed by one overnight incubation. For mitosis experiments, cells were collected by trypsinization, fixed in 1× Fix/Perm Buffer (421401; Biolegend), washed in Perm/Wash buffer (554723; BD Biosciences), stained with an Alexa 488 Fluor-conjugated antibody against phosphorylated histone H3 (S10) (3465; Cell Signaling Technology) at a dilution of 1:50 in Perm/Wash buffer, and washed in Perm/Wash buffer before analysis. For cell cycle analysis, ECFCs were incubated with bromodeoxyuridine (BrdU) labeling reagent (Invitrogen, Grand Island, NY) for 1 h. Cells were stained, as previously described, using Alexa Fluor 488 mouse anti-BrdU (Invitrogen) and 7-AAD (Life Technologies) (4). At least 10,000 events were recorded by flow cytometry using a FACSCanto II (BD Biosciences). Mitosis and cell cycle phase analyses were conducted using FlowJo Single Cell Analysis Software vX.0.6.
Confocal microscopy.
Confocal images were acquired with a confocal/two-photon Olympus Fluoview FV-1000 MPE system (Olympus America, Central Valley, PA) available at the ICBM using Olympus UPLSAPO ×60, numerical aperture 0.95 water immersion objective.
Time-lapse microscopy.
All time-lapse imaging experiments were conducted on a fully automated Nikon TiE microscope equipped with a ProScan II motorized stage (Prior Scientific, Rockland, MA), xenon lamp source, Lambda LS, and Lambda 10–3 filter wheel controller (Sutter Instruments, Novato, CA), fitted with an ORCA-ER or ORCA-Flash 4.0 (Hamamatsu, Japan) controlled by Elements 4.20 software (Nikon Instruments, Melville, NY). Imaging was performed as previously described (38, 39). Phase contrast images were acquired with a CFI PlanFluor DLL ×10 objective (Nikon Instruments). Multiple images and Z-positions were collected to cover the sample wells and stitched together with the Nikon Elements software as required. For live imaging, the microscope was fitted with a stage top incubator with humidity (75–85%), temperature (37°C) and CO2 regulation (5%; OkoLab, Burlingame, CA).
Kinetic analysis of vasculogenesis.
Phase contrast images were compiled, processed, and analyzed using the FIJI plugin called kinetic analysis of vasculogenesis (KAV) (38, 39). KAV is reliant on the Skeletonize 2D/3D and Analyze Skeleton plugins in FIJI (1). Values for the number of closed networks and the ratio of branches to nodes generated from the software analysis were graphed in Prism (GraphPad, San Diego, CA) and R (version 3.1.1) (33).
Transwell migration assay.
ECFCs were plated on collagen-coated transparent polyethylene terephthalate membranes (24-well, 8.0-µm pore size) (Corning,) in EBM2 and incubated at 37°C for 4 h. The promigratory stimulus was EGM2 + 10% FBS. Nonmigratory cells were removed with cotton swabs, and cells were fixed with ice-cold methanol before being stained with crystal violet. Eight different field images were obtained at ×20 magnification for each sample, and the numbers of migrated cells were quantified. Images were obtained using a Spot camera (Spot Imaging Solutions) on an Axiovert 35 microscope (Zeiss).
Rho kinase inhibitor assay.
During the transwell assay, ECFCs were treated with 0.1 μM Rho kinase inhibitor Y27632 (Tocris, ThermoFisher) just before plating and maintained in media containing the inhibitor for the duration of the 4-h migration assay. Simultaneously, ECFC protein lysates were collected from ECFCs plated on collagen-coated dishes that were treated with 0.1 μM Rho kinase inhibitor Y27632 for 4 h before collection using RIPA buffer.
Laminar flow assay.
ECFCs were plated in confluence on collagen-coated glass slides in EGM2 + 10% FBS. Cells were subjected to laminar flow for 7 h as previously described (30, 31). Following exposure to flow, slides were fixed with 4% paraformaldehyde, quenched with 100 mM glycine, blocked with 3% bovine serum albumin, and permeabilized with 0.5% Triton X-100 in 3% bovine serum albumin. Portions of the slide were incubated with TAGLN primary antibody at a 1:400 dilution (ab14106; Abcam) for 1 h at room temperature. AlexaFluor 568-conjugated goat anti-rabbit secondary antibody (1:400; no. A11011; Life Technologies), NucBlue Fixed Cell Stain Ready Probes reagent (no. R37605, ThermoFisher Scientific), and ActinGreen 488 Ready Probes reagent (no. R37110; ThermoFisher Scientific) were added for 30 min at room temperature. Slides were rinsed with phosphate-buffered saline and mounted with Prolong Diamond Antifade mountant (no. P36970; ThermoFisher Scientific). Images were acquired using a Spot RT XE camera (Spot Imaging Solutions) with a ×40 objective on a Leica DM 4000B microscope (Leica Microsystems, Buffalo Grove, IL). Fluorescence images of F-actin were captured from eight field-matched locations on the slide and analyzed using the FIJI Directionality Plug-in (28, 37a). Mean angle values for each cell were produced by the Directionality Plug-in and used to generate the histograms and statistical analysis of angle means and variance. High-resolution confocal imaging was performed on a Leica SP8 MP microscope using an ×20 objective.
Statistical analysis.
All graphing and statistics were carried out in Prism (GraphPad) and R, a software platform for statistical computing and graphics (version 3.1.1) (33). The graphs represent the means ± SE at each time point. To statistically analyze the differences between the entire kinetic curves, all individual time point data were pooled to produce estimated mean difference curves and the corresponding pointwise 95% confidence intervals as previously described (38, 39). These curves were generated using penalized spline techniques, and the analysis was performed using the MGCV package in R (33, 41). One-way and two-way ANOVA were performed for comparisons of more than two groups, as indicated in the figure legends. Kruskal-Wallis post hoc tests were performed on nonparametric data sets. Paired t-tests were used when two groups were compared in knockdown and overexpression studies. P < 0.05 was considered as statistically significant.
RESULTS
GDM exposure increases TAGLN expression in fetal ECFCs.
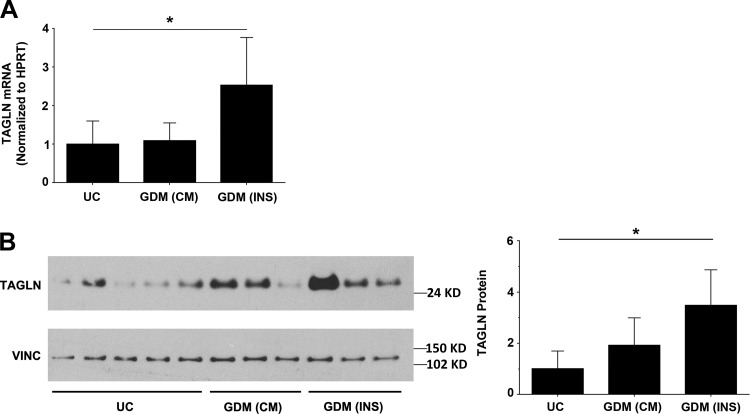
Previously, a microarray analysis was conducted on fetal ECFC samples from UC pregnancies and those complicated by GDM to identify alterations in gene expression following exposure to GDM (4). To verify whether TAGLN is increased in ECFCs from GDM pregnancies, quantitative real time polymerase chain reaction and Western blotting analyses were conducted (Fig. 1, A and B). GDM pregnancies were separated into two groups based on treatment strategy, including conservative management with diet and exercise (CM) or pharmacologic management with insulin therapy (INS). While some heterogeneity in TAGLN levels was evident in GDM-exposed samples, TAGLN was consistently higher in the insulin-treated (INS) group but not in the conservatively managed (CM) patients (Fig. 1, A and B). Therefore, ECFC samples from the insulin-treated group were used in subsequent functional assays.
Fig. 1.
Transgelin (TAGLN) is elevated in endothelial colony-forming cells (ECFCs) from gestational diabetes mellitus (GDM) pregnancies. A: RNA was isolated from ECFCs obtained from uncomplicated (UC), GDM-conservatively managed (CM), and GDM-insulin (INS) controlled pregnancies. Using quantitative real-time polymerase chain reaction, relative amounts of TAGLN mRNA were quantified and normalized to hypoxanthine phosphoribosyltransferase (HPRT). Data were analyzed by one-way ANOVA followed by a Kruskal-Wallis post hoc test. ECFCs from GDM-INS pregnancies had significantly higher levels of TAGLN mRNA compared with samples from UC pregnancies (UC: n = 8; GDM-CM and GDM-INS: n = 4; *P = 0.046). B: representative Western blot is shown using whole cell lysates from UC, GDM-CM, and GDM-INS samples. The membrane was probed with antibodies against TAGLN and vinculin (VINC). Band intensity was quantified using ImageJ, and TAGLN protein levels were normalized using VINC. Data were analyzed by one-way ANOVA followed by a Kruskal-Wallis post hoc test. GDM-INS samples had increased TAGLN compared with UC controls (UC: n = 5; GDM-CM and GDM-INS: n = 3; *P = 0.019).
Reducing TAGLN expression improves migration and network formation in GDM-exposed ECFCs.
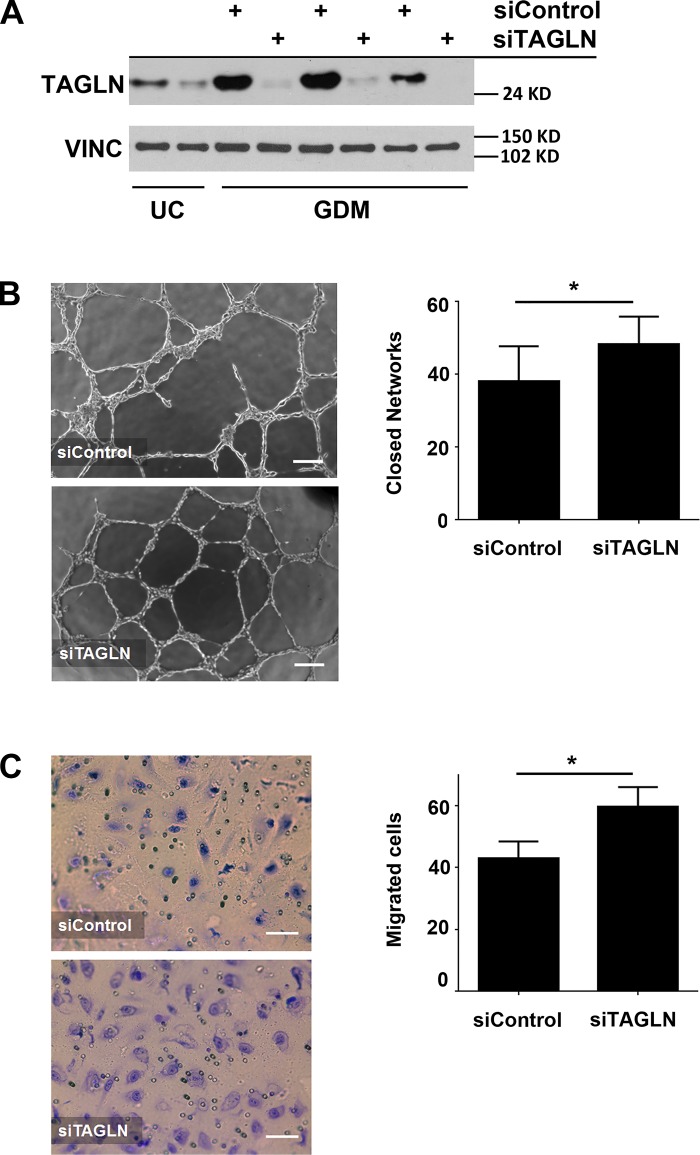
TAGLN is an actin binding protein implicated in regulating cell migration, a critical step in establishing vascular networks (12, 29, 43). Previously, we showed that ECFCs from GDM pregnancies exhibit reduced network formation (3). Therefore, we hypothesized that elevated TAGLN expression in GDM-exposed ECFCs impairs network formation. To test this hypothesis, TAGLN was reduced in ECFCs from GDM pregnancies using siRNA techniques. Representative data from independent siRNA knockdown experiments demonstrated TAGLN reductions of >90% at the protein level (Fig. 2A). Importantly, TAGLN protein levels following knockdown approached protein levels observed in ECFC samples from uncomplicated pregnancies (Fig. 2A). As predicted, siRNA-mediated reduction of TAGLN expression increased the number of closed networks formed by GDM-exposed ECFCs (Fig. 2B). Since migration is a critical component in ECFC network formation, transwell migration assays were conducted to assess ECFC movement. Reducing TAGLN resulted in a greater number of cells migrating towards the promigratory stimulus (Fig. 2C). Together, these results suggest that reducing TAGLN in GDM-exposed ECFCs improves vasculogenic and migratory abilities.
Fig. 2.
Elevated transgelin (TAGLN) in gestational diabetes mellitus (GDM)-exposed endothelial colony-forming cells (ECFCs) contributes to impaired function. A: a representative Western blot is shown using whole cell lysates from ECFCs harvested from uncomplicated controls (UC) and ECFCs from GDM pregnancies treated with either a nonspecific siRNA (siControl) or a TAGLN-specific siRNA (siTAGLN). Membranes were probed for TAGLN and vinculin (VINC). B: phase contrast images of ECFC network formation on Matrigel 10 h postplating following siControl or siTAGLN treatments are illustrated. The numbers of closed networks formed were quantified and graphed (n = 8 transfections; *P = 0.019). C: Transwell migration assays were performed with ECFCs transfected with siControl or siTAGLN. Photomicrographs depict migrated ECFCs stained with crystal violet. The numbers of migrating cells after 4 h were quantified (n = 10 transfections; *P = 0.028).
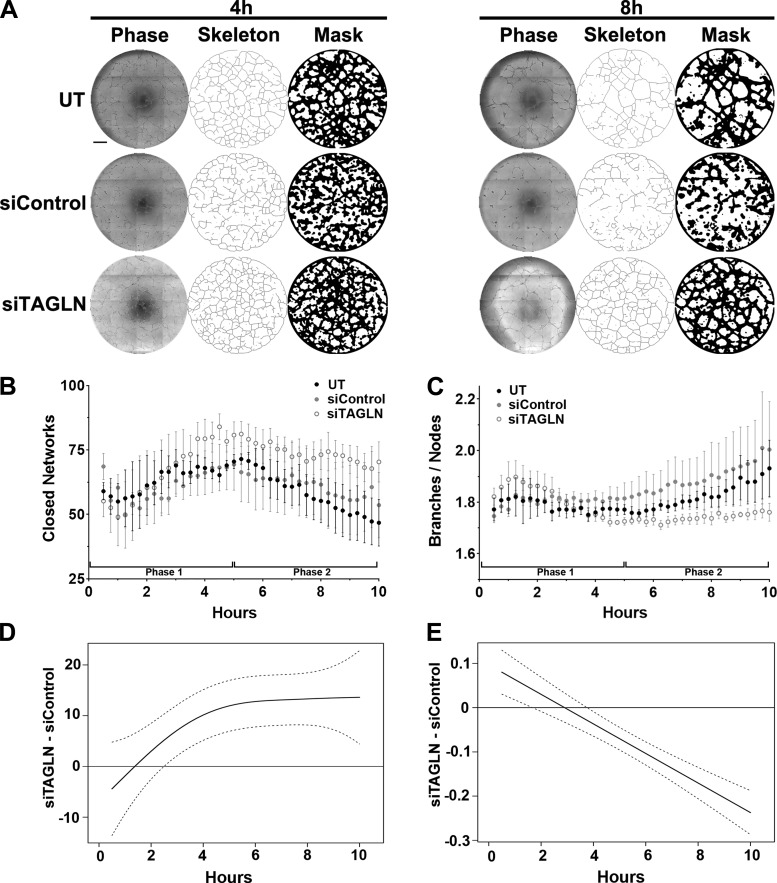
To obtain a kinetic readout of ECFC network formation, KAV methods were applied to quantitate large time-lapse image data sets and provide high-throughput vasculogenic analyses (38, 39). Skeleton and mask renditions of representative network structures enable visual confirmation of the quantitative analysis generated by the software (Fig. 3A). Qualitative differences were not obvious at the early time point (0–4 h); however, differences in network structure were apparent around 8 h postplating. Both untreated GDM (UT) and siControl-treated GDM ECFCs exhibit a clear reduction in the number of closed networks compared with siTAGLN (Fig. 3A). This qualitative observation was confirmed quantitatively using KAV. Similar to previously observed biphasic trends in ECFC network formation kinetics (38, 39), all samples analyzed form an increasing number of closed networks in phase 1 (0–5 h) until network formation peaks at 5 h (Fig. 3B). At 5 h, quantitative differences between treatment groups become evident, as the average number of closed networks in the siTAGLN group peaks at 84 networks, while the UT and siControl groups peak at 71 and 69 networks, respectively (Fig. 3B). Importantly, the numbers of closed networks in the siTAGLN group remain higher throughout the time course compared with the other two groups, with significant differences in closed network number observed primarily in phase 2 (5 h+). This is indicative of increased stability, as networks formed by the siTAGLN-treated ECFCs in phase 1 are being maintained compared with decreased stability observed in the other two groups. A discriminating phenotype identified in previous studies was the ratio of branches to nodes (38), which reflected decreased connectivity in phase 2 (5–10 h) of network formation. Similar to ECFCs from type 2 diabetes mellitus (T2DM) pregnancies, ECFCs from GDM pregnancies (UT and siControl) have an increased ratio of branches to nodes that occurs between 5 and 10 h of formation (Fig. 3C). In contrast, the ratio of branches to nodes in the siTAGLN group was constant during phase 2, further supporting and increase in network stability. Another interesting qualitative observation was decreased variability in the ratio of branches to nodes in the siTAGLN group. The variability in the GDM UT and siControl groups was much larger, which was also previously observed in ECFC samples from T2DM pregnancies (38).
Fig. 3.
Kinetic analysis of vasculogenesis (KAV) identifies altered network formation kinetics following transgelin (TAGLN) knockdown. A: representative phase contrast (left), skeleton (middle), and mask (right) images of endothelial colony-forming cell (ECFC) network formation on Matrigel at 4 and 8 h postplating. ECFCs were obtained from gestational diabetes mellitus (GDM) pregnancies and were untreated (UT) or treated with nonspecific siRNA (siControl) or TAGLN-specific siRNA (siTAGLN). Scale bar, 500 µm. B and C: KAV software quantitated closed networks and the ratio of total branches divided by total nodes for UT (black), siControl (gray), and siTAGLN (white) samples. The data illustrated represent means ± SE of 5 individual transfections for each group. D and E: differences between the mean kinetic curves of the 2 experimental groups for each parameter are shown as solid black lines with the pointwise 95% confidence interval (CI) represented by dotted lines. A significant difference between the curves for a specific time point is detected if the CI of the difference curve does not cross the reference line (y = 0) at that time point.
The difference between siTAGLN and siControl groups was validated statistically using mean kinetic values for the number of closed networks and the ratio of branches to nodes similar to our previous studies (38). This statistical difference, as indicated by the solid black line, is within the pointwise 95% confidence intervals (dotted lines) and greater than zero throughout the duration of the experiment suggesting functional effects of TAGLN on network structure (Fig. 3, D and E). These results confirm the initial Matrigel studies at a single time point in which the numbers of closed networks were quantified manually (Fig. 2). Overall, KAV analysis of GDM-exposed ECFCs following TAGLN knockdown confirmed manually quantified static data (Fig. 2) and provided novel data depicting network kinetics and stability.
Increasing TAGLN in ECFCs from UC pregnancies impairs migration and network formation.
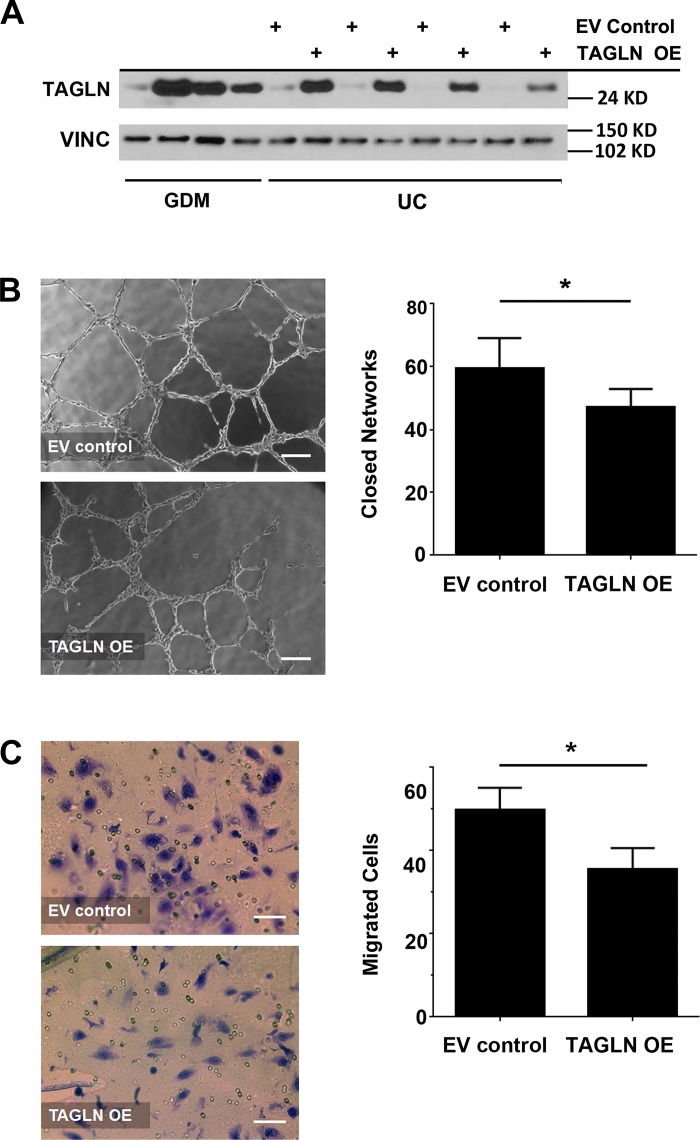
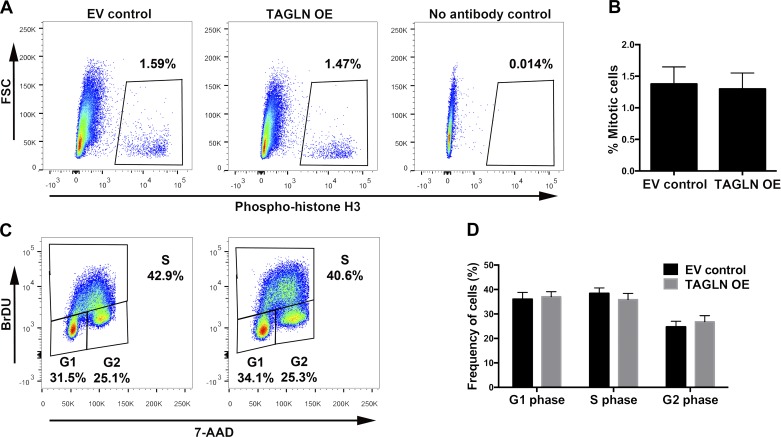
To determine whether increased TAGLN expression was sufficient to reduce vasculogenic function of ECFCs, a lentiviral-mediated approach was used to overexpress TAGLN in ECFCs from uncomplicated pregnancies. ECFCs were transduced with either a control, empty vector-containing lentivirus (EV control) or a virus encoding TAGLN (TAGLN OE). Western blotting confirmed TAGLN overexpression and that TAGLN levels following overexpression were comparable to endogenous levels observed in GDM-exposed ECFCs (Fig. 4A). Following TAGLN overexpression, Matrigel and transwell assays were performed to test ECFC network formation and migration, respectively. Increasing TAGLN expression significantly reduced the number of closed networks formed by ECFCs in Matrigel assays (Fig. 4B). Additionally, higher levels of TAGLN reduced ECFC migration in transwell assays (Fig. 4C). Disrupted network formation and migration may be due to altered proliferation. To assess the effect of TAGLN overexpression on ECFC proliferation, flow cytometry experiments were performed using the proliferation marker phosphorylated histone H3, as well as BrDU/7-AAD to assess cell cycle progression. No differences in proliferation or cell cycle were observed following overexpression of TAGLN in ECFCs (Fig. 5). Therefore, altered proliferation does not account for the differences in network formation and migration observed following TAGLN overexpression.
Fig. 4.
Increasing transgelin (TAGLN) in endothelial colony-forming cells (ECFCs) from uncomplicated (UC) pregnancies is sufficient to impair function. A: representative Western blot is shown using whole cell lysates collected from gestational diabetes mellitus (GDM)-exposed ECFCs and ECFCs from uncomplicated pregnancies transduced with either a control lentivirus (EV control) or a TAGLN-expressing lentivirus (TAGLN OE). Membranes were probed for TAGLN and vinculin (VINC). B: phase contrast images of ECFC network formation on Matrigel following transduction with either EV control or TAGLN OE lentivirus. The numbers of closed networks were quantified 10 h postplating (n = 9 transductions, *P = 0.047). C: Transwell migration assays were performed with ECFCs transduced with EV control or TAGLN OE lentivirus. Photomicrographs depict migrated ECFCs stained with crystal violet 4 h after plating. The numbers of migrating cells after 4 h were quantified (n = 11 transductions, *P = 0.015).
Fig. 5.
Increasing transgelin (TAGLN) in endothelial colony-forming cells (ECFCs) from uncomplicated pregnancies does not alter proliferation. A: representative dot plots are shown for flow cytometric assessment of mitosis using an antibody against phosphorylated histone H3. The percentage of mitotic cells was quantified using freshly stained ECFC samples transduced with either a control lentivirus (EV control) or a TAGLN-expressing lentivirus (TAGLN OE). Staining intensity of phosphorylated histone H3-Alexa 488 is plotted on the x-axis and forward scatter (FSC) values are plotted on the y-axis. B: the mean percentage (±SE) of mitotic cells, determined by positive staining for phosphorylated histone H3, was quantified in EV control and TAGLN OE ECFCs (n = 8, P = 0.20, paired t-test). C: representative dot plots depict ECFC cell cycle distribution following transduction with EV control or TAGLN OE lentivirus. ECFCs were treated with bromodeoxyuridine (BrDU) and stained with 7-AAD (x-axis) and anti-BrDU-Alexa 488 (y-axis). D: the mean percentage (±SE) of ECFCs in G1, S, and G2 phases was quantified in EV control and TAGLN OE ECFCs (n = 8; P = 0.87, two-way ANOVA).
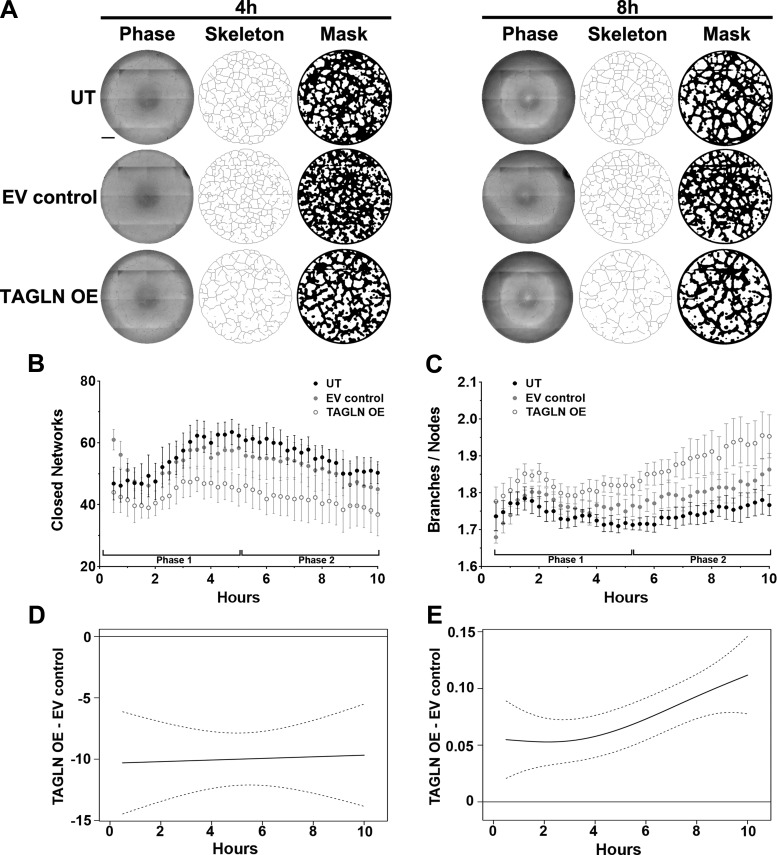
To obtain a comprehensive view of ECFC network formation following TAGLN overexpression, KAV analyses were performed. Qualitative observations of the networks using the skeleton and mask renditions demonstrated differences in network structure (Fig. 6A). These qualitative observations were confirmed quantitatively by KAV (Fig. 6, B and C). ECFCs from uncomplicated pregnancies (UT and EV control) formed equivalent numbers of closed networks, peaking around 65 networks at 5 h. Upon overexpression of TAGLN (TAGLN OE), the number of closed networks peaked earlier (3.5–4 h) and at a lower number compared with controls during phase 1 (0–5 h) (Fig. 6B). In phase 2 (5 h+), structures formed by UT and EV control groups maintained a greater number of closed networks compared with structures formed by ECFCs overexpressing TAGLN (Fig. 6B). In addition, the ratio of branches to nodes increased in phase 2 in the TAGLN OE group, indicative of reduced network connectivity (Fig. 6C). A statistical difference between the TAGLN OE and EV control groups was validated using mean kinetic values for the number of closed networks and the ratio of branches to nodes (Fig. 6, D and E). Overall, these results suggest that increased TAGLN is sufficient to impair network formation of fetal ECFCs.
Fig. 6.
Kinetic analysis of vasculogenesis (KAV) identifies altered network formation kinetics following transgelin (TAGLN) overexpression. A: representative phase contrast, skeleton, and mask images of endothelial colony-forming cell (ECFC) network formation on Matrigel at 4 and 8 h postplating. ECFCs from uncomplicated pregnancies were transduced with TAGLN-containing lentivirus (TAGLN OE). Controls include untreated (UT) and a virus containing an empty vector (EV control). Scale bar, 500 µm. B and C: KAV software quantitated closed networks and the ratio of total branches divided by total nodes for UT control (black), EV control (gray), and TAGLN OE (white) samples. The data illustrated represent the means ± SE of 6 individual transductions for each group. D and E: differences between the mean kinetic curves of the 2 experimental groups for each parameter are shown as solid black lines with the pointwise 95% confidence interval (CI) represented by dotted lines. A significant difference between the curves for a specific time point is detected if the CI of the difference curve does not cross the reference line (y = 0) at that time point.
TAGLN mediates migration via MLC phosphorylation in ECFCs.
Previously, TAGLN was identified as a novel regulator of matrix metalloproteinase 9 (MMP9) (29), a type IV collagenase that cleaves extracellular matrix components to enable cell migration (20). In addition, TAGLN2 was identified as a negative regulator of myosin light chain (MLC) phosphorylation (43), which is involved in actin-myosin interactions required for cytoskeletal rearrangement during migration (8). Therefore, MMP9 expression and phosphorylation of myosin light chain were assessed in GDM-exposed ECFCs to determine if TAGLN regulates cell migration through a conserved mechanism previously identified in other cell types.
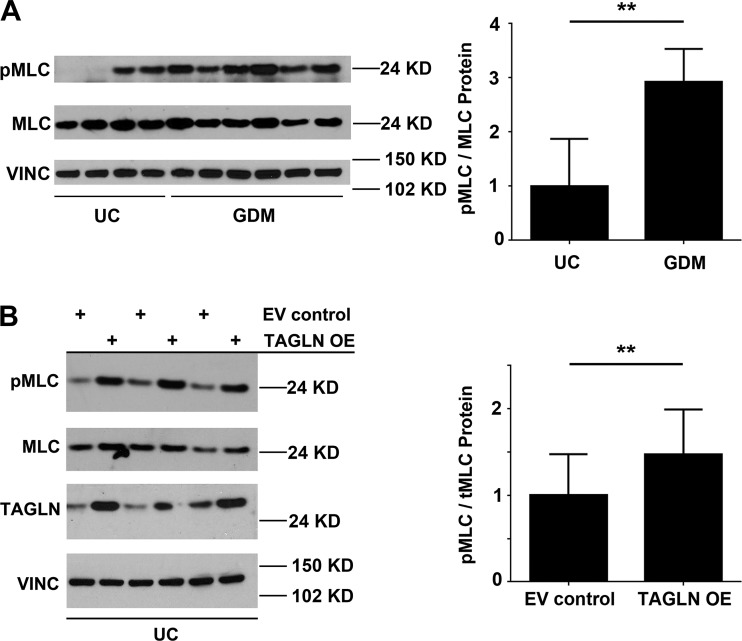
At the transcript level, MMP9 expression was not detectable in ECFC samples from GDM or uncomplicated pregnancies, suggesting that decreased MMP9 is not likely the primary mechanism by which TAGLN reduces ECFC migration (data not shown; UC: n = 6; GDM: n = 8). However, at baseline, ECFC samples from GDM pregnancies exhibited nearly threefold more MLC phosphorylation compared with uncomplicated controls (Fig. 7A). To evaluate whether increased TAGLN promotes myosin light chain phosphorylation, TAGLN was overexpressed in ECFCs from uncomplicated pregnancies. ECFCs from uncomplicated pregnancies overexpressing TAGLN had increased basal MLC phosphorylation compared with EV controls (Fig. 7B). Based on these results, we hypothesized that myosin light chain phosphorylation was a potential mechanism downstream of TAGLN that was altering ECFC vasculogenic function.
Fig. 7.
Myosin light chain (MLC) phosphorylation is increased in endothelial colony-forming cells (ECFCs) with elevated transgelin (TAGLN). A: ECFC whole cell lysates from uncomplicated (UC) or gestational diabetes mellitus (GDM) pregnancies were evaluated for MLC phosphorylation (pMLC) and total MLC (MLC) by Western blotting. Nitrocellulose membranes were probed with antibodies against p-MLC, MLC, and vinculin (VINC). Quantification in ImageJ confirmed increased levels of pMLC relative to MLC in samples from GDM pregnancies (UC: n = 4; GDM: n = 6; **P = 0.003). B: similar Western blotting studies were conducted using whole cell lysates from ECFCs transduced with either a control lentivirus (EV control) or a lentivirus containing TAGLN (TAGLN OE). Quantitation in ImageJ confirmed increased levels of pMLC relative to MLC in TAGLN OE samples (n = 7 transductions; **P = 0.002).
To test our hypothesis, GDM-exposed ECFCs were treated with the Rho kinase inhibitor Y27632. Rho kinase phosphorylates a subunit of the MLC phosphatase complex, rendering it inactive and unable to dephosphorylate MLC. The Y27632 inhibitor blocks Rho kinase activity, which maintains active MLC phosphatase resulting in reduced MLC phosphorylation (35). Guided by previous reports (18, 24) and our optimization studies (data not shown), a concentration of 0.1 μM Y27632 was added just before plating cells in transwells to reduce, but not completely block, MLC phosphorylation in GDM-exposed ECFCs. Inhibitor treatment of ECFCs from uncomplicated pregnancies had no effect on migration (data not shown; UC: n = 3 paired samples), which was expected since ECFCs from uncomplicated pregnancies have minimal MLC phosphorylation. In contrast, GDM-exposed ECFCs treated with Y27632 had increased migration in transwell assays compared with untreated GDM controls (80 ± 24 vs. 96 ± 32 cells; n = 6; P = 0.011). Similarly, Rho kinase inhibition also enhanced migration of ECFCs overexpressing TAGLN (46 ± 13 vs. 60 ± 15; n = 5; P = 0.019). Thus reducing MLC phosphorylation in the presence of elevated TAGLN was sufficient to enhance ECFC migration.
TAGLN regulates ECFC response to laminar flow.
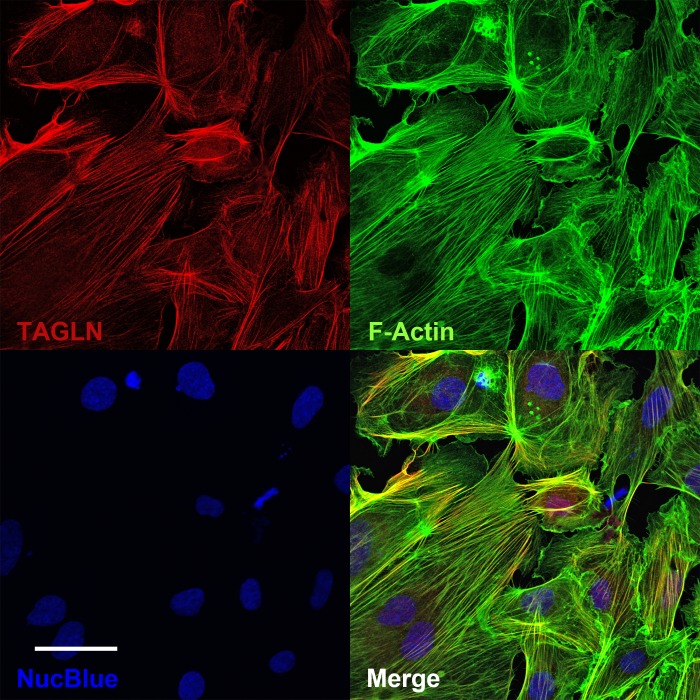
TAGLN contains a conserved actin binding domain which facilitates filamentous actin (F-actin) stabilization (15). Thus we hypothesized that an abundance of TAGLN in ECFCs would increase F-actin stabilization and consequently delay cytoskeletal remodeling involved in cell movement. Previous studies reported colocalization of TAGLN and F-actin using immunofluorescence techniques in vascular smooth muscle cells (16, 19). Therefore, confocal microscopy was used to confirm localization of TAGLN and F-actin in ECFCs. Using confocal microscopy, it was evident that most TAGLN and F-actin colocalize within the cytoplasm of ECFCs (Fig. 8). Following confirmation of colocalization, shear assays were conducted to determine if TAGLN alters the ability of ECFCs to align in response to flow, a conserved endothelial cell phenotype (6).
Fig. 8.
Transgelin (TAGLN) localizes to F-actin in endothelial colony-forming cells (ECFCs). ECFCs from a gestational diabetes mellitus (GDM) pregnancy were plated on type 1 collagen-coated glass slides and stained for TAGLN (red) and F-actin (green). NucBlue was used as a nuclear stain (blue), and all 3 channels were overlaid in the 4th panel (merge). Images were obtained using confocal microscopy. Scale bar, 50 μm.
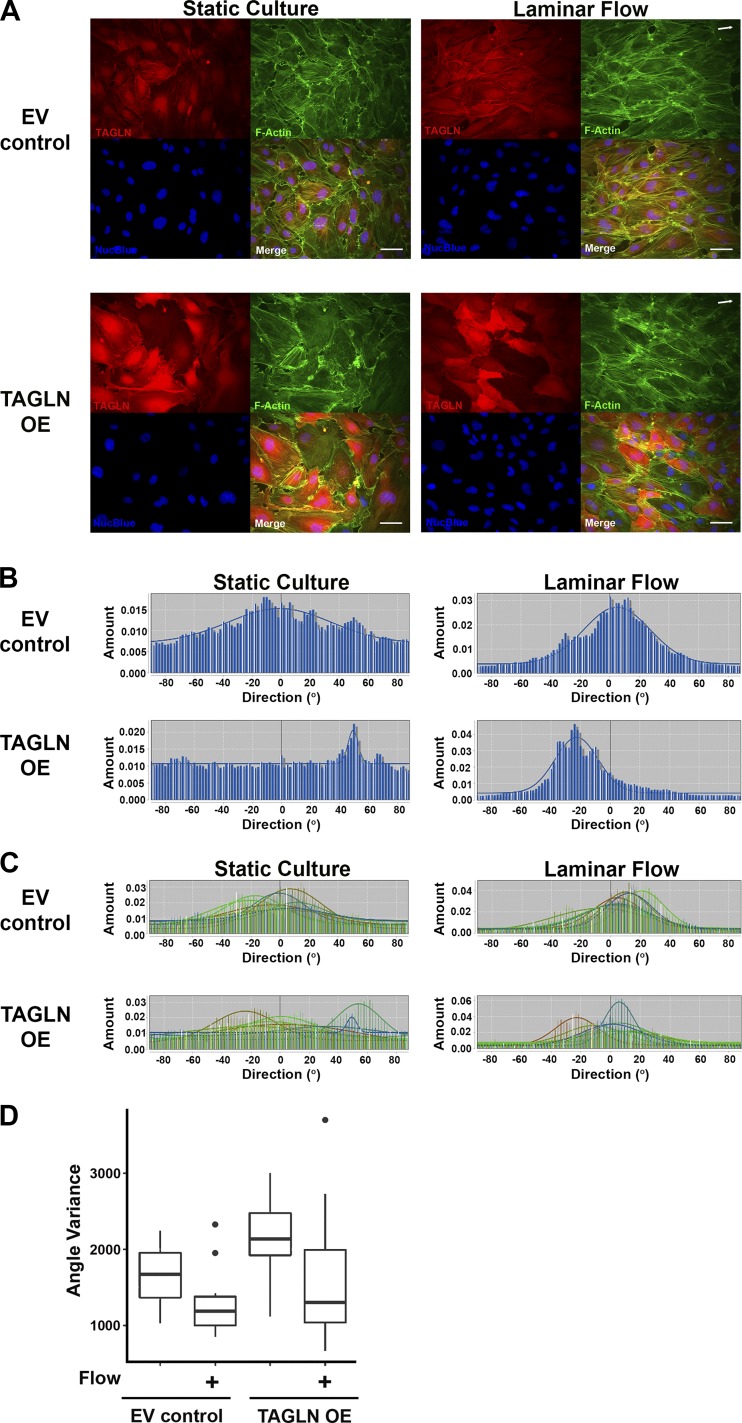
To determine whether ECFCs overexpressing TAGLN align in the direction of laminar flow, paired ECFC samples were maintained in static culture or subjected to 7 h of laminar flow as previously described (30, 31). Based on the direction of flow, efficient cell alignment results in a mean angle slightly greater than zero (Fig. 9A, arrows in panels at right indicate direction of flow). Qualitatively, ECFCs transduced with EV control lentivirus under static culture conditions did not align in a unidirectional manner (Fig. 9A, top left). However, following 7 h of laminar flow, EV control cells exhibited strong alignment as evidenced by near complete unidirectional F-actin alignment (Fig. 9A, top right). In contrast, ECFCs overexpressing TAGLN had less coordinated alignment in static cultures (Fig. 9A, bottom left). Following exposure to laminar flow, ECFC alignment was not consistently in the direction of flow, suggesting greater variability in ECFC cytoskeletal rearrangement (Fig. 9A, bottom right).
Fig. 9.
Transgelin (TAGLN) alters endothelial colony-forming cell (ECFC) alignment and response to laminar flow. A: ECFCs from uncomplicated (UC) pregnancies were transduced with either a control lentivirus (EV control) or a lentivirus containing TAGLN (TAGLN OE). Transduced ECFCs were plated on type 1 collagen-coated glass slides and maintained in static culture or exposed to 7 h of laminar flow using a custom apparatus as previously described (25, 30, 31). Direction of flow is indicated by white arrows in the top right corner of images. Following treatment, ECFCs were fixed and stained for TAGLN (red), F-actin (green), and Nucblue (blue). All 3 channels were overlaid in the merged image. Scale bars, 25 μm. B: ECFC alignment was analyzed with the Directionality Plug-in (FIJI). F-actin fluorescence images were used to generate the single, blue histograms representing angle distribution for ~30 cells in the representative images above. C: histograms representing all images for each group were combined and overlaid. Eight image fields for each treatment group were analyzed. D: three ECFC samples from UC pregnancies were transduced and 4 treatment groups were assessed per sample (i.e., EV control ± Flow and TAGLN OE ± Flow). Data were analyzed by a two-way ANOVA. Exposure to laminar flow reduced angle variance (P = 0.0002). Angle variance was associated with TAGLN expression, with increased variance in the TAGLN OE group compared with the EV control group (P = 0.0009).
Quantitation of cell alignment using the FIJI Directionality Plug-in analysis software supported these qualitative observations. The Directionality software generates a histogram of the mean angles of alignment for all cells in a single image, allowing quantitative analyses to be conducted. Histograms in Fig. 9B depict alignment angles of cells in the Fig. 9A images, which are representative data from three ECFC samples tested. Each histogram includes data from ~30 cells. Histograms with a tall, centralized peak, such as in the EV control group after laminar flow exposure (Fig. 9B, top right histogram), indicates consistent cell alignment. Using this approach, eight images from consistent areas of each slide were analyzed for mean angle of alignment, enabling the evaluation of mean angle variation and distribution of ECFCs over the entire slide. Histogram data for each image were overlaid to produce a single graph, combining data from ~200–250 cells per sample and treatment (Fig. 9C). Following flow treatment, ECFCs transduced with EV control lentivirus aligned in the direction of flow indicated by the nearly complete overlap of histograms near an angle measurement of 10–20° or the approximate angle of flow (Fig. 9C). Conversely, TAGLN-overexpressing cells (TAGLN OE) displayed a high degree of variability in ECFC alignment at baseline and following exposure to 7 h of laminar flow. While ECFCs overexpressing TAGLN seemed to attempt alignment, most histogram peaks were at angles less than or equal to zero, indicating that the cells were unable to align to the same extent as ECFCs transduced with EV control.
To further evaluate for statistical differences in cell alignment between treatment groups, the angle variance, or variability of the cell alignment, was calculated (Fig. 9D). The independent and combinatorial effects of TAGLN overexpression (TAGLN OE) and flow exposure on ECFC alignment were assessed by two-way ANOVA, and the results are summarized in a box and whisker plot (Fig. 9D). Importantly, this measure encompasses all cells within the immunofluorescence images used for analysis, which was on average 200–250 cells per sample and condition. Overall, since cells align in response to flow exposure, the variability in cell alignment decreases (P = 0.0002). In EV control samples, angle variance decreased more abundantly following flow exposure because these cells are able to efficiently respond to and consistently align with the direction of the flow (Fig. 9D). Compared with EV control, ECFCs overexpressing TAGLN display increased angle variance at baseline in the absence of flow exposure. Following flow exposure, TAGLN OE ECFCs display a significant decrease in angle variance in response to flow, indicating an attempt at alignment. However, TAGLN OE ECFCs do not achieve uniform alignment to the same extent as EV control samples in response to flow, as indicated by the large standard deviation in the TAGLN OE group exposed to flow. Thus angle variance is associated with TAGLN expression such that variance is elevated and remains high in response to flow in the TAGLN OE ECFCs compared with the EV control ECFCs (P = 0.0009). Similar to other endothelial cell populations, these data demonstrate that ECFCs are capable of effectively responding to laminar flow by aligning to the direction of the flow. However, TAGLN overexpression alters cell alignment in both basal and flow conditions.
Intrauterine exposure to GDM alters ECFC response to laminar flow.
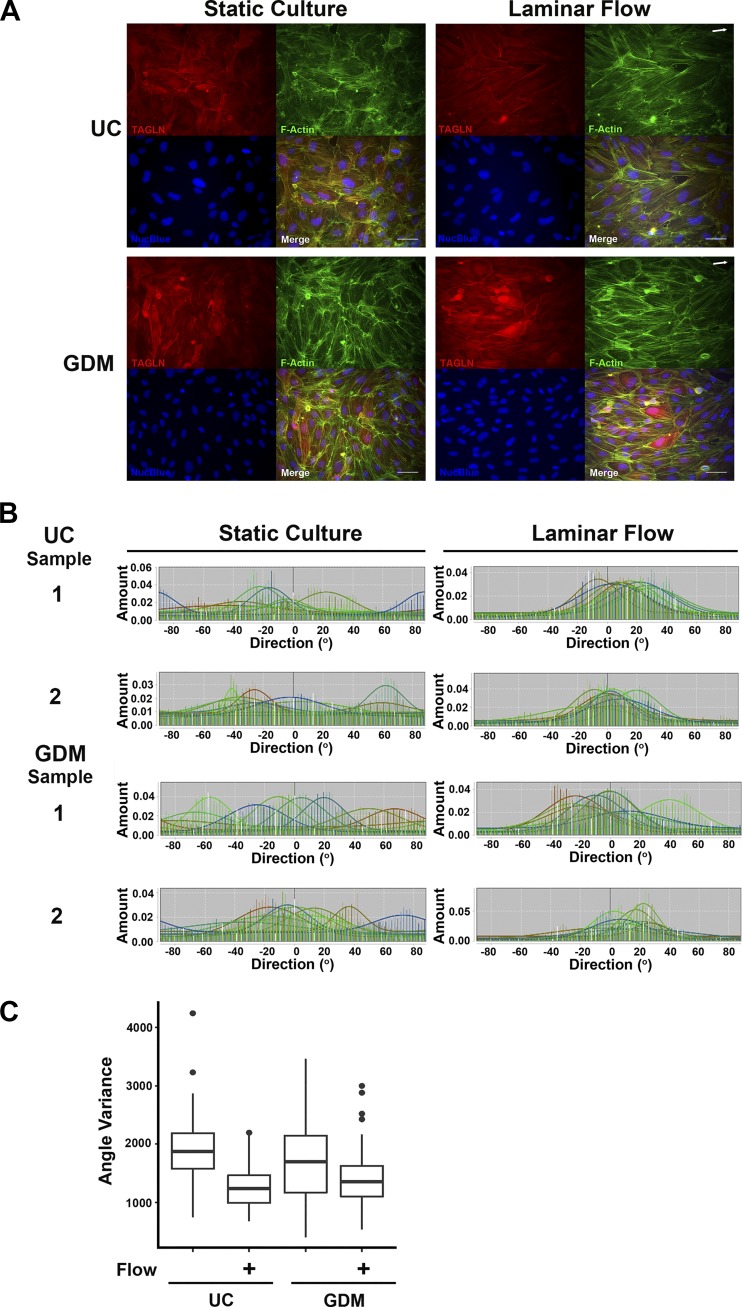
Given that GDM-exposed ECFCs exhibit increased TAGLN expression and ECFCs overexpressing TAGLN exhibit impaired alignment in response to flow, we hypothesized that ECFCs from GDM pregnancies would have altered cell alignment in response to laminar flow. Similar to results from the overexpression studies, ECFCs from UC and GDM-exposed pregnancies exhibit random, uncoordinated alignment under static conditions and conform to unidirectional alignment in the direction of flow (Fig. 10A). To quantitatively assess for differences between experimental groups, mean alignment angles were determined for each cell. Histograms from nine consistent image fields from each sample were generated for these analyses (UC: n = 5; GDM: n = 8). Under static culture conditions, ECFC alignment was not uniform, indicated by nonoverlapping histograms (Fig. 10B). Following exposure to flow, UC and GDM ECFC samples displayed increased alignment, as evidenced by increased histogram overlap and measured mean angles of alignment (P = 0.006). Two-way ANOVA analysis of the mean angle identified a significant interaction between GDM and flow exposure, suggesting a compounding effect of GDM on ECFC function (P = 0.028). In assessment of angle variance, exposure to flow significantly reduced cell alignment variability in UC and GDM ECFC groups (Fig. 10C, P < 0.0001). By two-way ANOVA analysis, the interaction between the effects of GDM and flow exposure was modest for angle variance (P = 0.056). Taken together, these observations suggest that GDM-exposed ECFCs have an altered response to flow, which results in greater variability of cell alignment.
Fig. 10.
Intrauterine exposure to gestational diabetes mellitus (GDM) alters endothelial colony-forming cell (ECFC) response to laminar flow. A: ECFCs from uncomplicated (UC) and GDM pregnancies were plated on type 1 collagen-coated glass slides and were maintained in static culture or exposed to 7 h of laminar flow. White arrows in the top right of image panels indicate flow directionality. Following treatment, ECFCs were fixed and stained for transgelin (TAGLN) (red), F-actin (green), and NucBlue (blue). All 3 channels were overlaid in the merged image. Scale bars, 25 μm. B: ECFC alignment was analyzed with the Directionality Plug-in (FIJI). The F-actin fluorescence images were used to produce the histograms representing the distribution of angles measured within 8 images for each sample, which were combined and overlaid for a total of 200–250 cells analyzed per sample. C: box and whisker plots representing statistical analysis completed to compare angle variance distributions between the 2 groups (UC and GDM) in the presence and absence of flow (UC: n = 5; GDM: n = 8). Data were analyzed by two-way ANOVA. A significant interaction was identified between GDM exposure and laminar flow (P = 0.028). Angle variance was significantly altered by laminar flow exposure (P < 0.0001).
DISCUSSION
Using a genome-wide screen, elevated TAGLN mRNA was identified in fetal ECFCs from pregnancies complicated with GDM. Although TAGLN protein is not abundant in fetal ECFCs, exposure to a GDM environment in utero results in increased TAGLN expression. Interestingly, these findings are consistent with a prior report showing that TAGLN is increased in placentas from GDM pregnancies, although the cell types involved were not examined (34). These authors speculated that increases in TAGLN, along with other genes associated with chronic stress and inflammatory pathways, could link inflammation to GDM-associated insulin resistance. GDM is clearly a multifaceted disease, which results in numerous changes in the developing fetus and infant as a consequence of intrauterine exposure (9, 14, 32, 42).
As a result of intrauterine GDM exposure, ECFCs exhibit vasculogenic dysfunction (3, 21). Reduction of TAGLN in GDM-exposed ECFCs significantly improved initial network formation, ongoing network stabilization, and cell migration, consistent with the hypothesis that TAGLN is mediating, at least in part, deficits in vasculogenesis. Using a complementary approach to overexpress TAGLN in ECFCs from uncomplicated pregnancies, a dramatic decline in migration and closed networks was induced. Taken together these data suggest that aberrant TAGLN expression is sufficient to disrupt ECFC vasculogenesis, providing strong evidence that increased TAGLN in GDM-exposed ECFCs contributes to impairments in network formation and migration.
Members of the transgelin family, including TAGLN, participate in the process of cell migration through regulation of MMP9 expression and MLC phosphorylation (29, 43). In ECFCs, MMP9 transcript was not detectable, making MMP9 an unlikely mechanism responsible for the observed alterations in GDM-exposed ECFCs. On the other hand, MLC phosphorylation was substantially increased in ECFC samples from GDM pregnancies. Similarly, increased TAGLN in control ECFC samples was sufficient to enhance MLC phosphorylation. Although these results are inconsistent with a previous report on TAGLN2 in human umbilical vein endothelial cells (43), the apparent discrepancy may be due to differences in cell types and transgelin genes studied. In fact, opposing functions of TAGLN and TAGLN2 have been observed in cancer cells (11). Our TAGLN overexpression studies demonstrated that reduced MLC phosphorylation, via Rho kinase inhibition, increased ECFC migration. These data suggest that elevated MLC phosphorylation is key for the pathologic vasculogenic phenotypes detected.
Endothelial cells comprising vessel walls are constantly exposed to hemodynamic forces. Therefore, it is critical for endothelial cells to appropriately sense and respond to hemodynamic changes (10). A central feature of vascular homeostasis is the ability of endothelial cells to respond to laminar flow, thereby aligning to flow directionality (37). Given that TAGLN is an actin binding protein involved in regulating cytoskeletal reorganization in other cell types, we tested whether increased TAGLN was sufficient to impair flow-mediated ECFC alignment. Our data demonstrated that overexpressing TAGLN alters ECFC alignment in static and flow conditions. Alterations in alignment under basal conditions were surprising, as ECFC organization varies extensively in static culture. GDM-exposed ECFCs with high endogenous levels of TAGLN also exhibited alterations in ECFC alignment. A significant interaction was identified between GDM and flow exposure. Thus intrauterine exposure to GDM alters the ability of ECFCs to respond appropriately to flow. Importantly, this novel phenotype has not previously been identified in ECFCs and provides new insight into possible molecular mechanisms contributing to chronic vascular complications in offspring of GDM mothers.
Although several studies provide compelling evidence that intrauterine exposure to maternal T2DM and GDM have long-term effects on child health outcomes, the mechanisms responsible are not fully understood. Recently published studies in our laboratory demonstrated that ECFCs from T2DM pregnancies have increased expression of the transcription factor mesenchyme homeobox 2 (MEOX2), which was sufficient to increase ECFC migration and network formation (17). Therefore, increased MEOX2 expression was a compensatory mechanism by which fetal ECFCs from T2DM pregnancies maintain vascular function despite poor intrauterine environments. The identification of a dysregulated molecular mechanism in T2DM-exposed ECFCs prompted additional studies to identify specific molecular mechanisms altered by TAGLN expression in GDM-exposed ECFCs. In contrast to the protective effects of MEOX2 in T2DM-exposed ECFCs, TAGLN expression in ECFCs from GDM pregnancies results in pathologic changes. Therefore, TAGLN expression was not compensatory, but rather detrimental, as it reduced ECFC network formation and migration. The difference between the consequences of elevated MEOX2 and TAGLN in ECFCs could be due to the specific function of each protein, but differences could also be attributable to the severity and duration of the intrauterine diabetic microenvironment from which the cells were derived.
Improving functional assessment of fetal vascular progenitor cells will allow for an understanding of how intrauterine diabetic exposure imparts long-term vascular complications. Currently, limited clinical tools are available to assess severity of diabetic exposure in children from mothers with GDM. Unfortunately, these morbidities often go undiagnosed until children present with disease later in life, at which time the opportunity for prevention has ended. Therefore, more in-depth analyses of ECFC vasculogenesis are needed to identify how and why functional deficits are incurred in utero. The development of a useful, noninvasive platform for assessing severity of exposure at the time of birth would increase the accuracy of health assessments to enable more informed predictions of long-term health outcomes.
GRANTS
This work was supported by National Institutes of Health Grants R01-HL-094725 (to L. S. Haneline), P30-CA-82709 (Indiana University Simon Cancer Center), U10-HD-063094 (to L. S. Haneline), and T32-HL-007910-15 (to K. M. Varberg) and Riley Children’s Foundation (Indianapolis, IN; to L. S. Haneline).
DISCLOSURES
No conflicts of interest, financial or otherwise, are declared by the authors.
AUTHOR CONTRIBUTIONS
K.M.V., R.O.G., E.K.B., and L.S.H. conceived and designed research; K.M.V., R.O.G., and E.K.B. performed experiments; K.M.V., R.O.G., E.K.B., C.C., and L.S.H. analyzed data; K.M.V., R.O.G., E.K.B., C.R.G., and L.S.H. interpreted results of experiments; K.M.V., R.O.G., and C.C. prepared figures; K.M.V. and R.O.G. drafted manuscript; K.M.V., R.O.G., E.K.B., C.C., C.R.G., W.T., and L.S.H. edited and revised manuscript; K.M.V., R.O.G., E.K.B., C.C., C.R.G., W.T., and L.S.H. approved final version of manuscript.
ACKNOWLEDGMENTS
We thank Lucy Miller, Leanne Hernandez, Dr. David Haas, and Brittany Yeley (Indiana University School of Medicine); Dr. Karen Pollok, Julie Mund, Matthew Repass, and Emily Sims (Angio BioCore at the Indiana University Simon Cancer Center); and Dr. Fredrick Pavalko, Rita O’Riley, Seth Winfree, and Dr. Malgorzata Kamocka for excellent technical assistance. We also thank Drs. Maureen Harrington, Edward Srour, Richard Day, and Matthias Clauss (Indiana University School of Medicine) for scholarly discussion as well as Janice Walls (Indiana University School of Medicine) for administrative support. Kinetic time-lapse imaging was performed at the Indiana Center for Biological Microscopy, Indiana University School of Medicine.
REFERENCES
- 1.Arganda-Carreras I, Fernández-González R, Muñoz-Barrutia A, Ortiz-De-Solorzano C. 3D reconstruction of histological sections: application to mammary gland tissue. Microsc Res Tech 73: 1019–1029, 2010. doi: 10.1002/jemt.20829. [DOI] [PubMed] [Google Scholar]
- 2.Barker DJ, Osmond C, Winter PD, Margetts B, Simmonds SJ. Weight in infancy and death from ischaemic heart disease. Lancet 334: 577–580, 1989. doi: 10.1016/S0140-6736(89)90710-1. [DOI] [PubMed] [Google Scholar]
- 3.Blue EK, DiGiuseppe R, Derr-Yellin E, Acosta JC, Pay SL, Hanenberg H, Schellinger MM, Quinney SK, Mund JA, Case J, Haneline LS. Gestational diabetes induces alterations in the function of neonatal endothelial colony-forming cells. Pediatr Res 75: 266–272, 2014. doi: 10.1038/pr.2013.224. [DOI] [PMC free article] [PubMed] [Google Scholar]
- 4.Blue EK, Sheehan BM, Nuss ZV, Boyle FA, Hocutt CM, Gohn CR, Varberg KM, McClintick JN, Haneline LS. Epigenetic regulation of placenta-specific 8 contributes to altered function of endothelial colony-forming cells exposed to intrauterine gestational diabetes mellitus. Diabetes 64: 2664–2675, 2015. doi: 10.2337/db14-1709. [DOI] [PMC free article] [PubMed] [Google Scholar]
- 5.Boney CM, Verma A, Tucker R, Vohr BR. Metabolic syndrome in childhood: association with birth weight, maternal obesity, and gestational diabetes mellitus. Pediatrics 115: e290–e296, 2005. doi: 10.1542/peds.2004-1808. [DOI] [PubMed] [Google Scholar]
- 6.Chien S. Effects of disturbed flow on endothelial cells. Ann Biomed Eng 36: 554–562, 2008. doi: 10.1007/s10439-007-9426-3. [DOI] [PMC free article] [PubMed] [Google Scholar]
- 7.Cho NH, Silverman BL, Rizzo TA, Metzger BE. Correlations between the intrauterine metabolic environment and blood pressure in adolescent offspring of diabetic mothers. J Pediatr 136: 587–592, 2000. doi: 10.1067/mpd.2000.105129. [DOI] [PubMed] [Google Scholar]
- 8.Cooper GM. Actin, Myosin, and Cell Movement (Online). https://www.ncbi.nlm.nih.gov/books/NBK9961/ [20 Apr. 2017].
- 9.Crume TL, Ogden L, Daniels S, Hamman RF, Norris JM, Dabelea D. The impact of in utero exposure to diabetes on childhood body mass index growth trajectories: the EPOCH study. J Pediatr 158: 941–946, 2011. doi: 10.1016/j.jpeds.2010.12.007. [DOI] [PMC free article] [PubMed] [Google Scholar]
- 10.Davies PF. How do vascular endothelial cells respond to flow? Physiology (Bethesda) 4: 22–25, 1989. doi: 10.1152/physiologyonline.1989.4.1.22. [DOI] [Google Scholar]
- 11.Dvorakova M, Nenutil R, Bouchal P. Transgelins, cytoskeletal proteins implicated in different aspects of cancer development. Expert Rev Proteomics 11: 149–165, 2014. doi: 10.1586/14789450.2014.860358. [DOI] [PubMed] [Google Scholar]
- 12.Fu Y, Liu HW, Forsythe SM, Kogut P, McConville JF, Halayko AJ, Camoretti-Mercado B, Solway J. Mutagenesis analysis of human SM22: characterization of actin binding. J Appl Physiol (1985) 89: 1985–1990, 2000. doi: 10.1152/jappl.2000.89.5.1985. [DOI] [PubMed] [Google Scholar]
- 13.Gavvovidis I, Rost I, Trimborn M, Kaiser FJ, Purps J, Wiek C, Hanenberg H, Neitzel H, Schindler D. A novel MCPH1 isoform complements the defective chromosome condensation of human MCPH1-deficient cells. PLoS One 7: e40387, 2012. doi: 10.1371/journal.pone.0040387. [DOI] [PMC free article] [PubMed] [Google Scholar]
- 14.Gillman MW, Rifas-Shiman S, Berkey CS, Field AE, Colditz GA. Maternal gestational diabetes, birth weight, and adolescent obesity. Pediatrics 111: e221–e226, 2003. doi: 10.1542/peds.111.3.e221. [DOI] [PubMed] [Google Scholar]
- 15.Gimona M, Djinovic-Carugo K, Kranewitter WJ, Winder SJ. Functional plasticity of CH domains. FEBS Lett 513: 98–106, 2002. doi: 10.1016/S0014-5793(01)03240-9. [DOI] [PubMed] [Google Scholar]
- 16.Gimona M, Kaverina I, Resch GP, Vignal E, Burgstaller G. Calponin repeats regulate actin filament stability and formation of podosomes in smooth muscle cells. Mol Biol Cell 14: 2482–2491, 2003. doi: 10.1091/mbc.e02-11-0743. [DOI] [PMC free article] [PubMed] [Google Scholar]
- 17.Gohn CR, Blue EK, Sheehan BM, Varberg KM, Haneline LS. Mesenchyme homeobox 2 enhances migration of endothelial colony forming cells exposed to intrauterine diabetes mellitus. J Cell Physiol 232: 1885–1892, 2017. doi: 10.1002/jcp.25734. [DOI] [PMC free article] [PubMed] [Google Scholar]
- 18.Haile Y, Nakhaei-Nejad M, Boakye PA, Baker G, Smith PA, Murray AG, Giuliani F, Jahroudi N. Reprogramming of HUVECs into induced pluripotent stem cells (HiPSCs), generation and characterization of HiPSC-derived neurons and astrocytes. PLoS One 10: e0119617, 2015. doi: 10.1371/journal.pone.0119617. [DOI] [PMC free article] [PubMed] [Google Scholar]
- 19.Han M, Dong LH, Zheng B, Shi JH, Wen JK, Cheng Y. Smooth muscle 22 alpha maintains the differentiated phenotype of vascular smooth muscle cells by inducing filamentous actin bundling. Life Sci 84: 394–401, 2009. doi: 10.1016/j.lfs.2008.11.017. [DOI] [PubMed] [Google Scholar]
- 20.Handsley MM, Edwards DR. Metalloproteinases and their inhibitors in tumor angiogenesis. Int J Cancer 115: 849–860, 2005. doi: 10.1002/ijc.20945. [DOI] [PubMed] [Google Scholar]
- 21.Ingram DA, Lien IZ, Mead LE, Estes M, Prater DN, Derr-Yellin E, DiMeglio LA, Haneline LS. In vitro hyperglycemia or a diabetic intrauterine environment reduces neonatal endothelial colony-forming cell numbers and function. Diabetes 57: 724–731, 2008. doi: 10.2337/db07-1507. [DOI] [PubMed] [Google Scholar]
- 22.Ingram DA, Mead LE, Moore DB, Woodard W, Fenoglio A, Yoder MC. Vessel wall-derived endothelial cells rapidly proliferate because they contain a complete hierarchy of endothelial progenitor cells. Blood 105: 2783–2786, 2005. doi: 10.1182/blood-2004-08-3057. [DOI] [PubMed] [Google Scholar]
- 23.Ingram DA, Mead LE, Tanaka H, Meade V, Fenoglio A, Mortell K, Pollok K, Ferkowicz MJ, Gilley D, Yoder MC. Identification of a novel hierarchy of endothelial progenitor cells using human peripheral and umbilical cord blood. Blood 104: 2752–2760, 2004. doi: 10.1182/blood-2004-04-1396. [DOI] [PubMed] [Google Scholar]
- 24.Ishizaki T, Uehata M, Tamechika I, Keel J, Nonomura K, Maekawa M, Narumiya S. Pharmacological properties of Y-27632, a specific inhibitor of rho-associated kinases. Mol Pharmacol 57: 976–983, 2000. [PubMed] [Google Scholar]
- 25.Jacobs CR, Yellowley CE, Davis BR, Zhou Z, Cimbala JM, Donahue HJ. Differential effect of steady versus oscillating flow on bone cells. J Biomech 31: 969–976, 1998. doi: 10.1016/S0021-9290(98)00114-6. [DOI] [PMC free article] [PubMed] [Google Scholar]
- 26.Lawson D, Harrison M, Shapland C. Fibroblast transgelin and smooth muscle SM22alpha are the same protein, the expression of which is down-regulated in many cell lines. Cell Motil Cytoskeleton 38: 250–257, 1997. doi:. [DOI] [PubMed] [Google Scholar]
- 27.Lees-Miller JP, Heeley DH, Smillie LB, Kay CM. Isolation and characterization of an abundant and novel 22-kDa protein (SM22) from chicken gizzard smooth muscle. J Biol Chem 262: 2988–2993, 1987. [PubMed] [Google Scholar]
- 28.Liu ZQ. Scale space approach to directional analysis of images. Appl Opt 30: 1369–1373, 1991. doi: 10.1364/AO.30.001369. [DOI] [PubMed] [Google Scholar]
- 29.Nair RR, Solway J, Boyd DD. Expression cloning identifies transgelin (SM22) as a novel repressor of 92-kDa type IV collagenase (MMP-9) expression. J Biol Chem 281: 26424–26436, 2006. doi: 10.1074/jbc.M602703200. [DOI] [PubMed] [Google Scholar]
- 30.Norvell SM, Ponik SM, Bowen DK, Gerard R, Pavalko FM. Fluid shear stress induction of COX-2 protein and prostaglandin release in cultured MC3T3-E1 osteoblasts does not require intact microfilaments or microtubules. J Appl Physiol (1985) 96: 957–966, 2004. doi: 10.1152/japplphysiol.00869.2003. [DOI] [PubMed] [Google Scholar]
- 31.Pavalko FM, Gerard RL, Ponik SM, Gallagher PJ, Jin Y, Norvell SM. Fluid shear stress inhibits TNF-α-induced apoptosis in osteoblasts: a role for fluid shear stress-induced activation of PI3-kinase and inhibition of caspase-3. J Cell Physiol 194: 194–205, 2003. doi: 10.1002/jcp.10221. [DOI] [PubMed] [Google Scholar]
- 32.Plagemann A, Harder T, Kohlhoff R, Rohde W, Dörner G. Overweight and obesity in infants of mothers with long-term insulin-dependent diabetes or gestational diabetes. Int J Obes Relat Metab Disord 21: 451–456, 1997. doi: 10.1038/sj.ijo.0800429. [DOI] [PubMed] [Google Scholar]
- 33.R Development Core Team R: A Language and Environment for Statistical Computing.Vienna, Austria: R Foundation for Statistical Computing, 2016. http://www.R-project.org/. [Google Scholar]
- 34.Radaelli T, Varastehpour A, Catalano P, Hauguel-de Mouzon S. Gestational diabetes induces placental genes for chronic stress and inflammatory pathways. Diabetes 52: 2951–2958, 2003. doi: 10.2337/diabetes.52.12.2951. [DOI] [PubMed] [Google Scholar]
- 35.Ramachandran C, Patil RV, Combrink K, Sharif NA, Srinivas SP. Rho-Rho kinase pathway in the actomyosin contraction and cell-matrix adhesion in immortalized human trabecular meshwork cells. Mol Vis 17: 1877–1890, 2011. [PMC free article] [PubMed] [Google Scholar]
- 36.Shapland C, Hsuan JJ, Totty NF, Lawson D. Purification and properties of transgelin: a transformation and shape change sensitive actin-gelling protein. J Cell Biol 121: 1065–1073, 1993. doi: 10.1083/jcb.121.5.1065. [DOI] [PMC free article] [PubMed] [Google Scholar]
- 37.Steward R Jr, Tambe D, Hardin CC, Krishnan R, Fredberg JJ. Fluid shear, intercellular stress, and endothelial cell alignment. Am J Physiol Cell Physiol 308: C657–C664, 2015. doi: 10.1152/ajpcell.00363.2014. [DOI] [PMC free article] [PubMed] [Google Scholar]
- 37a.Tinevez JV. Directionality. Bethesda, MD: ImageJ, National Institutes of Health; https://imagej.net/Directionality [5 Apr. 2017]. [Google Scholar]
- 38.Varberg KM, Winfree S, Chu C, Tu W, Blue EK, Gohn CR, Dunn KW, Haneline LS. Kinetic analyses of vasculogenesis inform mechanistic studies. Am J Physiol Cell Physiol 312: C446–C458, 2017. doi: 10.1152/ajpcell.00367.2016. [DOI] [PMC free article] [PubMed] [Google Scholar]
- 39.Varberg KM, Winfree S, Dunn KW, Haneline LS. Kinetic analysis of vasculogenesis quantifies dynamics of vasculogenesis and angiogenesis in vitro. J Vis Exp 131: e57044, 2018. doi: 10.3791/57044. [DOI] [PMC free article] [PubMed] [Google Scholar]
- 40.Wen J, Shi J, Zheng B, Meng F, Han M. [The molecular mechanisms of SM22alpha in cytoskeleton remodeling of vascular smooth muscle cells]. Zhongguo Ying Yong Sheng Li Xue Za Zhi 24: 393–397, 2008. [PubMed] [Google Scholar]
- 41.Wood SN. Generalized Additive Models: An Introduction With R (Online) Boca Raton, FL: CRC, 2006. https://www.crcpress.com/Generalized-Additive-Models-An-Introduction-with-R/Wood/p/book/9781420010404 [13 Mar. 2017]. [Google Scholar]
- 42.Wright CS, Rifas-Shiman SL, Rich-Edwards JW, Taveras EM, Gillman MW, Oken E. Intrauterine exposure to gestational diabetes, child adiposity, and blood pressure. Am J Hypertens 22: 215–220, 2009. doi: 10.1038/ajh.2008.326. [DOI] [PMC free article] [PubMed] [Google Scholar]
- 43.Xiao Y, Li Y, Han J, Pan Y, Tie L, Li X. Transgelin 2 participates in lovastatin-induced anti-angiogenic effects in endothelial cells through a phosphorylated myosin light chain-related mechanism. PLoS One 7: e46510, 2012. doi: 10.1371/journal.pone.0046510. [DOI] [PMC free article] [PubMed] [Google Scholar]
- 44.Yoder MC. Is endothelium the origin of endothelial progenitor cells? Arterioscler Thromb Vasc Biol 30: 1094–1103, 2010. doi: 10.1161/ATVBAHA.109.191635. [DOI] [PubMed] [Google Scholar]
- 45.Yoder MC, Mead LE, Prater D, Krier TR, Mroueh KN, Li F, Krasich R, Temm CJ, Prchal JT, Ingram DA. Redefining endothelial progenitor cells via clonal analysis and hematopoietic stem/progenitor cell principals. Blood 109: 1801–1809, 2007. doi: 10.1182/blood-2006-08-043471. [DOI] [PMC free article] [PubMed] [Google Scholar]


