

Abstract
Treatment of nonalcoholic fatty liver disease (NAFLD) focuses on the underlying metabolic syndrome, and Roux-en-Y gastric bypass surgery (RYGB) remains one of the most effective options. In rodents and human patients, RYGB induces an increase in the gene and protein expression levels of the M2 isoenzyme of pyruvate kinase (PKM2) in the jejunum. Since PKM2 can be secreted in the circulation, our hypothesis was that the circulating levels of PKM2 increase after RYGB. Our data, however, revealed an unexpected finding and a potential new role of PKM2 for the natural history of metabolic syndrome and NAFLD. Contrary to our initial hypothesis, RYGB-treated patients had decreased PKM2 blood levels compared with a well-matched group of patients with severe obesity before RYGB. Interestingly, PKM2 serum concentration correlated with body mass index before but not after the surgery. This prompted us to evaluate other potential mechanisms and sites of PKM2 regulation by the metabolic syndrome and RYGB. We found that in patients with NAFLD and nonalcoholic steatohepatitis (NASH), the liver had increased PKM2 expression levels, and the enzyme appears to be specifically localized in Kupffer cells. The study of murine models of metabolic syndrome and NASH replicated this pattern of expression, further suggesting a metabolic link between hepatic PKM2 and NAFLD. Therefore, we conclude that PKM2 serum and hepatic levels increase in both metabolic syndrome and NAFLD and decrease after RYGB. Thus, PKM2 may represent a new target for monitoring and treatment of NAFLD.
Keywords: bariatric surgery, nonalcoholic fatty liver disease, nonalcoholic steatohepatitis, obesity, pyruvate kinase isoenzyme M2, steatohepatitis
INTRODUCTION
The interval development of nonalcoholic fatty liver disease (NAFLD) in patients with metabolic syndrome is becoming an important focus of study due to the ever-increasing prevalence of obesity (11, 31). NAFLD encompasses a broad spectrum of liver pathology, from simple or nonalcoholic fatty liver to nonalcoholic steatohepatitis (NASH) (44). The treatment of NAFLD focuses on the underlying metabolic syndrome, and Roux-en-Y gastric bypass surgery (RYGB) is one of the most effective but also most invasive options (41). Most patients initially pursue nonsurgical treatment options, which have variable degrees of success. Monitoring the resolution of NASH and fibrosis in these individuals remains a challenge. There are several new laboratory and imaging modalities being developed to assess the resolution of steatohepatitis, but the current gold standard is a liver biopsy, which is an invasive technique (50). Understanding the molecular mechanisms underlying the pathogenesis of NAFLD will likely aid the development of new screening and monitoring tools and novel treatments. This is important as NASH is associated with increased risk for cirrhosis, portal hypertension, and progression to hepatocellular carcinoma (48).
This report focuses on the potential role of pyruvate kinase isoenzyme M2 (PKM2) in the pathogenesis and monitoring of NAFLD. PKM2 is one of the four isoforms of pyruvate kinase, a central enzyme regulating glycolysis. It is a key component of normal, highly proliferating and cancerous cells (6), but it is not generally expressed in differentiated tissues, including adult muscle, brain, and liver (19). This particular isoform favors cell growth by allowing proliferating cells to direct their substrate utilization toward anabolic or catabolic metabolism depending on their needs. Specifically, PKM2 has a unique ability to divert glycolytic intermediates toward either tricarboxylic acid cycle and oxidation or cellular biosynthetic pathways (52). Several types of cancers are associated with increased circulating PKM2 levels, but whether metabolic syndrome and obesity cause any changes in PKM2 levels is largely unknown.
Our interest in exploring the effects of PKM2 developed because of our recent discovery that PKM2 gene and protein expression levels increase in the jejunum of rodents and human patients that undergo RYGB surgery (45). This is most likely an effort to promote growth of the remodeling intestinal mucosa. Since PKM2 can be secreted in the circulation, our initial hypothesis was that the circulating levels of PKM2 increase after RYGB. Our data, however, revealed an unexpected finding and a potential new role for PKM2, which may be important for the natural history of metabolic syndrome and NAFLD.
MATERIALS AND METHODS
We compared the PKM2 levels in blood samples of patients who underwent RYGB to a well-matched group of pre-RYGB patients with severe obesity. Table 1 shows the patientsʼ demographic information. We examined liver biopsy samples from patients who may have had a biopsy before or at the time of RYGB in order to stage and grade steatosis and steatohepatitis. Additionally, we examined PKM2 levels in liver samples collected from patients with NAFLD, as well as controls (Table 2). The study was approved by the Institutional Review Board of Massachusetts General Hospital and Boston Children’s Hospital, and written, informed consent was obtained from all human subjects.
Table 1.
Patient characteristics
| RYGBd | Controls with Obesity | ||
|---|---|---|---|
| Characteristics | (n = 13) | (n = 14) | P Value |
| Age (mean, SD) | 41.2 (12.4) | 47.2 (13.1) | 0.23 |
| Women, n | 7 | 9 | |
| Current BMIa (mean, SD) | 35.6 (6.9) | 47.6 (12.4) | |
| PreRYGB BMI (mean, SD) | 47.4 (5.5) | N/A | 0.57 |
| Time from RYGB (days; mean, range) | 1528 (56-3208) | N/A | |
| Liver biopsy,b n | 12 | 3 | |
| Steatosis, n | |||
| Grade 0 | 2 | 0 | |
| Grade 1 | 4 | 2 | |
| Grade 2 | 3 | 1 | |
| Grade 3 | 3 | 0 | |
| Steatohepatitis, n | 5 | 0 | |
| Fibrosis,c n | |||
| Stage 0 | 7 | 3 | |
| Stage 1 | 3 | 0 | |
| Stage 2 | 1 | 0 | |
| Stage 3 | 1 | 0 | |
| Stage 4 | 0 | 0 |
We measured serum PKM2 levels in one group of patients who had undergone RYGB and controls with obesity. BMI, body mass index; RYGB, Roux-en-Y gastric bypass surgery; n, number.
Calculated as weight in kilograms divided by height in meters squared.
Grading and staging of liver biopsies based on Brunt Classification of steatosis, steatohepatitis, and fibrosis.
Grading of fibrosis Stage from 0 to 4 (cirrhosis).
Biopsy specimens obtained prior to or at time of surgery.
Table 2.
Patient characteristics
| Controls | NAFLDa | NASHb | ||
|---|---|---|---|---|
| Characteristics | (n = 3) | (n = 4) | (n = 4) | P Value |
| Age (mean, SD) | 43.0 (14.0) | 42.3 (11.4) | 42.8 (9.9) | 0.89 |
| Diabetes | 1 | 2 | 2 | |
| Women | 3 | 4 | 4 | |
| Race | ||||
| Black | 1 | 1 | 1 | |
| White | 2 | 3 | 3 |
We examined hepatic PKM2 expression levels from liver biopsies obtained from three groups of patients. NAFLD, nonalcoholic fatty liver disease, NASH, nonalcoholic steatohepatitis.
NAFLD, no NASH.
NASH with ballooning but without any sign of fibrosis.
Animals.
To determine the difference in gene expression of PKM2 in fatty vs. normal liver, we used three mouse models. First, we examined the methionine and choline-deficient diet model (MCDD), which is a well-studied murine model of NASH (23). To induce nonalcoholic liver steatosis, 5-wk-old male C57BL/6 mice (Jackson Laboratory, Bar Harbor, ME) were placed on MCDD (Research Diets, New Brunswick, NJ) for 4 wk. We also studied the gene expression levels of PKM2 in the leptin-deficient ob/ob mouse and the liver-specific insulin receptor knockout mouse (LIRKO) (4, 15, 30). The animals had access to food and water ad libitum and were maintained on a 12:12-h light-dark cycle (lights on at 7 AM). The experiments were approved by the Institutional Animal Care and Use Committee of Boston Children’s Hospital.
ELISA assay.
Blood samples were collected in EDTA tubes. After centrifugation, the supernatant was removed. A commercially available kit designed specifically to measure PKM2 levels (ScheBo Biotech, Giessen, Germany) was used, and all tests were performed as per manufacturerʼs protocol.
RNA isolation and quantitative real-time PCR reaction.
Total RNA was isolated using the RNeasy Plus universal tissue mini kit (Qiagen, Hilden, Germany). RNA was cleaned using the RNase-Free DNase set (Qiagen), and 1 µg from each sample was converted to cDNA using the SuperScript VILO cDNA synthesis kit (Applied Biosystems). For the detection of the human PKM2 transcript, we used the primers and thermal profile as reported by Yang et al. (55). We used GAPDH and PPIA human-specific primers [as in Refs. (10) and (35), respectively]. Using Primer-BLAST, other human primers were designed and then ordered from Integrated DNA Technologies (Coralville, IA, USA): INOS: 5′-AACCCCAAGGTTGTCTGCATC-3′, 5′-CGTACTGGTCACCACCAACA-3′; and ITGAX: 5′-GAGAGCTCAGACGACAACGG-3′, 5′-AAGTCCAAGGCAAAGAGGGG-3′. For mouse PKM2 transcript detection, we used primers available from PrimerBank MGH-PGA with the ID 359807366c1 (47). Other mouse primers included the following: INOS: 5′-CCTTGGTGAAGGGACTGAGC-3′, 5′-CAACGTTCTCCGTTCTCTTGC-3′; CDC11: 5′-GCAGACACTGAGTGATGCCA-3′, 5′-TCGGAGGTCACCTAGTTGGG-3′; RPS13: 5′-GTCCCCACGTGGCTGAAGTTG-3′, 5′-CCGTGTGAGTCCCTCAGGATTAC-3′; RPL27: 5′-CCTCATGCCCACAAGGTACTC-3′, 5′-CCTCAAACTTGACCTTGGCCTC-3′; and B2M: 5′-CCGGAGAATGGGAAGCCGAAC-3′, 5′-AGACCAGTCCTTGCTGAAGGAC-3′. PCR reaction mixtures were loaded in triplicate into 384-well clear optical reaction plates (ABI PRISM; Applied Biosystems, Foster City, CA), with each well containing: 1 µl of cDNA diluted 20-fold, 250 nM of each primer, Power SYBR Green MasterMix (Applied Biosystems), and nuclease-free water in 10 µl of total volume. Real-time PCR was performed using the ViiA 7 real-time PCR system (Applied Biosystems) under the following conditions: 10 min denaturation at 95°C, followed by 45 cycles of 15 s at 95°C and 60 s at 60°C. Melting curves were performed for each reaction. Cycle threshold (Ct) values of the gene of interest were normalized with 1–3 different reference genes. Relative quantification of gene expression was performed using the comparative Ct method (27, 53).
Immunohistochemistry.
Immunohistochemical staining was performed on human fatty liver and control samples and on MCDD and control mice of the same background (C57BL/6). Animal tissues were immediately collected, and livers were stored in formalin at room temperature for 2 days. Liver samples were transferred to 70% ethanol and kept at 4°C before being sent to the Animal Histology Core (Tufts Medical Center, Boston, MA) for tissue embedding in paraffin wax and sectioning. Histology slides containing liver sections from humans and mice were incubated for 10 min at 60°C and then treated with Trilogy pretreatment solution (Cell Marque, Rocklin, CA) in a pressure cooker (Cuisinart, Stamford, CT) for 5 min. Slides were cooled to room temperature and washed for 5 min twice in distilled water and once in TBS-T (Tris-EDTA, pH 7.6, 0.1% Tween 20). Slides were incubated for 1 h at room temperature in TBS-T with 5% goat serum followed by an overnight incubation at 4°C with the PKM2 primary antibody (Cell Signaling Technology, Danvers, MA). Slides were examined, and pictures were taken using Olympus (Tokyo, Japan) microscope model no. BX43F.
Stastistics and reanalysis of published gene expression data sets.
Nonparametric and parametric tests were used to statistically analyze the data using GraphPad Prism version 7.0 and SPSS Statistics version 24.
We searched the Gene Expression Omnibus (GEO) database (https://www.ncbi.nlm.nih.gov/gds/) for data sets that included gene expression profiles of liver samples collected from human patients who have undergone RYGB. We also searched for gene expression data sets comparing normal vs. metabolic syndrome and NAFLD/NASH. Gene expression data were then extracted, and the expression values of the probes that detect all transcript variants of PKM gene were analyzed.
RESULTS
Serum levels of PKM2 increase in metabolic syndrome and decrease after RYGB.
PKM2 is an enzyme that can be secreted into the blood. Measuring its circulating levels has been suggested as a method to screen, monitor progression, and determine prognosis of cancers (13). We have recently reported that PKM2 gene and protein expression levels are upregulated in the intestine of rodents and human patients after RYGB surgery (45). Thus, our working hypothesis was that this upregulation leads to an increase in the fraction of the enzyme in the blood.
To test this hypothesis, we obtained serum samples from 14 patients who had undergone RYGB surgery. We compared their PKM2 levels to those of a group of individuals with obesity who had a similar profile before weight loss surgery. As seen in Table 1, the presurgery weight, age and sex distribution between the two groups were similar.
In contrast to our hypothesis, we found that there was a 2.6-fold decrease in the serum PKM2 levels following RYGB (48.8 U/ml vs. 18.3 U/ml, P = 0.0002), (Fig. 1A). We noted that the serum PKM2 levels in specimens that were obtained before RYGB correlated with the pre-RYGB BMI of the patients (R2 = 0.456, P = 0.01). Interestingly, there was no correlation between serum PKM2 levels and BMI after RYGB (R2 = 0.09, P = 0.29), (Fig. 1, B and C). This finding suggests that the reduction in PKM2 levels may not necessarily be due to the effects of weight loss or peripheral adiposity itself.
Fig. 1.

Serum M2 isoenzyme of pyruvate kinase (KM2) levels in patients with and without Roux-en-Y gastric bypass surgery (RYGB). A: levels were reduced after RYGB. There was a correlation of serum PKM2 levels with pre-RYGB BMI (B), but not with post-RYGB BMI (C).
PKM2 hepatic expression levels increase in patients with NAFLD.
We were also able to examine the liver biopsy specimens that were collected before surgery in 12 of the 13 patients. There was evidence of steatohepatitis and degrees of liver fibrosis in 10 of the 12 samples. Immunohistochemical staining for PKM2 confirmed that obesity and steatohepatitis were associated with increased expression of PKM2. Interestingly, PKM2 was specifically localized in the Kupffer cells in these specimens (Fig. 2).
Fig. 2.

Hematoxylin-and-eosin (left) and immunohistochemical staining for PKM2 (right) in liver sections derived from human patients with NAFLD showed that PKM2 was specifically localized in the Kupffer cells (as indicated by arrowheads).
To confirm this finding, we examined the transcriptional levels of PKM2 in liver biopsies of a separate cohort of patients with a diagnosis of either steatosis or NASH. As a control group, we used liver biopsies from subjects with a negative diagnosis of NAFLD. The clinical characteristics for this patient cohort are shown in Table 2. Patients with NASH had evidence of hepatocellular injury, such as ballooning, but no signs of fibrosis. The expression of PKM2 was significantly higher in the liver of patients in both the steatosis and NASH groups compared with controls. Although the difference between steatosis and NASH was not statistically significant, we observed a robust trend toward increased PKM2 hepatic expression levels in patients with NASH (Fig. 3A).
Fig. 3.

A: gene expression levels of PKM2 were significantly higher in the liver of patients with steatosis and NASH compared with controls. B: there was a twofold increase in NOS2 transcriptional levels in the liver of patients with NAFLD and NASH. C: reanalysis of data set GSE48452 of the Gene Expression Omnibus (GEO) database repository (1) showed that bariatric surgery induces a decrease in PKM2 levels in patients with NAFLD (P = 0.002). *P < 0.05.
We then hypothesized that Kupffer cells are activated in the liver of patients with NAFLD and NASH. To further explore this hypothesis, we measured the gene expression levels of NOS2 (known also as inducible nitric oxide synthase, or INOS), which is a marker of the classical, proinflammatory M1 type of macrophage activation. This analysis detected a twofold increase in NOS2 transcriptional levels in the liver of patients with NAFLD and NASH (Fig. 3B).
To determine whether RYGB, the most effective treatment of NAFLD/NASH, decreases hepatic gene expression levels of PKM2, we searched for published data sets of hepatic gene expression signatures of patients who had undergone RYGB. We found one data set in the Gene Expression Omnibus (GEO) database repository, and we reanalyzed it to determine the gene expression levels of PKM2. Our analysis showed a robust trend of reduction of PKM2 levels after RYGB (Fig. 3C) (1). However, one drawback of this analysis is that the gene expression platform that was used does not include probes specific to the M2 isoenzyme of PK, but also detects several other transcript variants. For the same reason, the analysis of gene expression data sets that we found in the GEO database did not allow us to definitely rule out the presence of potential extrahepatic sites of PKM2 regulation associated with metabolic syndrome, NAFLD/NASH, and bariatric surgery (2, 3, 7–9, 12, 14, 17, 18, 21, 24, 26, 28, 29, 32–34, 36–40, 42, 46, 49, 54) (Table 3).
Table 3.
Analysis and comparison of gene expression data sets available in the GEO database
| Reference | GEO Number | Platform | Tissue | n/group | FC | P | FDR |
|---|---|---|---|---|---|---|---|
| Post vs. PreRYGB Surgery | |||||||
| 1 | GSE48452 | Affymetrix Human Gene 1.1 ST | Liver | 19, 14 | −1.249 | 0.003 | 0.077 |
| 3 | GSE19790 | Illumina human-6 v2.0 expression beadchip | Whole blood | 11 | −1.128 | 0.472 | 1.000 |
| 18 | GSE32575 | Illumina human-6 v2.0 expression beadchip | Monocytes | 18 | 1.152 | 0.019 | 0.035 |
| 38 | GSE5109 | Affymetrix Human Genome U133 Plus 2.0 | Muscle (vastus lateralis) | 3 | −1.479 | 0.201 | 0.945 |
| 2 | GSE45747 | Illumina Genome Analyzer IIx | Muscle (vastus lateralis) | 5 | −1.157 | 0.668 | 0.808 |
| 17 | GSE29411 | Affymetrix Human Genome U133 Plus 2.0 | Omental and subcutaneous adipose tissue | 10 | 1.190 | 0.598 | 0.893 |
| N/A | GSE72158 | Illumina Human HT-12 V4.0 expression beadchip | Subcutaneous adipose tissue | 42 | −1.364 | 0.000 | 0.000 |
| 37 | GSE53378 | Affymetrix Human Gene 2.0 ST | Subcutaneous adipose tissue | 16 | −1.088 | 0.092 | 0.364 |
| Obesity vs. Normal Body Weight | |||||||
| 36 | GSE48964 | Affymetrix Human Gene 1.0 ST | Adipose tissue stem cells | 3 | 1.052 | 0.492 | 0.787 |
| 24 | GSE2508 | Affymetrix Human Genome U95A to U95E and U95 Version 2 | Subcutaneous adipose tissue | 9, 10 | 1.397 | 4.268 | 0.000 |
| N/A | GSE48521 | Affymetrix Human Genome U133 Plus 2.0 | Amniotic fluid | 8 | 1.164 | 0.501 | 0.989 |
| 21 | GSE10946 | Affymetrix Human Genome U133 Plus 2.0 | Luteinized cumulus cells | 12, 11 | 1.057 | 0.871 | 1.000 |
| 9 | GSE53232 | Affymetrix Human Gene 1.1 ST | Immune cells: peripheral blood mononuclear cells | 60, 68 | 1.045 | 0.012 | 0.316 |
| 42 | GSE45233 | Illumina HumanHT-12 V4.0 expression beadchip | (injured) Meniscus | 4 | −1.108 | 0.618 | 0.935 |
| N/A | GSE73034 | Agilent-014850 Whole Human Genome | Muscle | 21, 7 | 1.158 | 0.117 | 0.597 |
| Microarray 4x44K G4112F | |||||||
| N/A | GSE15524 | CodeLink UniSet Human 20K I Bioarray | Omental and subcutaneous adipose tissue | 21, 7 | −1.267 | 0.440 | 0.961 |
| 34 | GSE2510 | Affymetrix Human Genome U133A and U133B | Primary culture abdominal subcutaneous preadipocytes | 14 | −1.065 | 0.462 | 0.925 |
| 40 | GSE22435 | Affymetrix Human Genome U133 Plus 2.0 | Muscle (rectus abdominis) | 10 | −1.011 | 0.942 | 0.989 |
| 46 | GSE26637 | Affymetrix Human Genome U133 Plus 2.0 | Subcutaneous adipose tissue | 5 | 1.199 | 0.319 | 0.790 |
| 33 | GSE12050 | INSERM-Agilent-012391 Whole Human Genome Oligo Microarray G4112A | Subcutaneous adipose tissue | 9 | −1.059 | 0.486 | 0.624 |
| 49 | GSE29718 | Affymetrix Human Gene 1.0 ST | Subcutaneous and visceral adipose tissue | 10 | 1.114 | 0.350 | 0.961 |
| 8 | GSE60403 | Affymetrix Human Genome U133 Plus 2.0 | Umbilical cord Blood | 8 | 1.037 | 0.783 | 0.966 |
| N/A | GSE73078 | Agilent-039494 SurePrint G3 Human GE v2 8×60K Microarray 039381 | Muscle (vastus lateralis) | 10 | 1.040 | 0.750 | 0.932 |
| 14 | GSE18897 | Affymetrix Human Genome U133 Plus 2.0 | Whole blood | 20 | −1.735 | 0.007 | 0.050 |
| 39 | GSE15653 | Affymetrix Human Genome U133 Plus 2.0 | Liver | 13, 5 | 1.014 | 0.974 | 0.988 |
| 12 | GSE63067 | Affymetrix Human Genome U133 Plus 2.0 | Liver | 9, 7 | 1.046 | 0.676 | 0.941 |
| 28 | GSE37031 | Affymetrix Human Genome U133 Plus 2.0 | Liver | 8, 7 | −1.212 | 0.132 | 0.487 |
| 26 | GSE24807 | GE Healthcare / Amersham Biosciences CodeLink Human Whole Genome Bioarray | Liver | 12, 5 | −1.113 | 0.676 | 0.828 |
Gene expression data sets include the gene expression profile of any available tissue and compare the following groups: 1) obesity vs. normal body weight, 2) pre- vs. post-gastric bypass surgery, and 3) normal liver vs. NAFLD. There was no study with probes specific only for NCBI Reference Sequence NM_002654 (PKM gene transcript variant 1 or PKM2). FC, fold change; P, P value; FDR, false discovery rate.
Pattern of PKM2 regulation in human patients is replicated in murine models of steatosis and NASH.
To determine whether NASH induces PKM2 expression in the liver independently of obesity, we studied three murine models that are known to exhibit different degrees of steatosis and liver damage. We first studied a lean murine model of NASH that does not exhibit obesity or insulin resistance (22, 23, 43). We found that PKM2 expression increased substantially in mice that developed hepatic NASH. Specifically, there was a four-fold increase in PKM2 gene expression levels from liver tissues in MCDD mice when compared with mice on a normal chow diet (Fig. 4A). Additionally, we were able to localize PKM2 expression within the Kupffer cells (Fig. 4B) in a pattern similar to that found in human patients. Markers of M1 macrophages (Inos and Itgax) were also dramatically increased in the liver of MCDD mice, indicating a switch of macrophages toward a proinflammatory phenotype (Fig. 4, C and D).
Fig. 4.

PKM2 expression in the MCDD mouse model of NASH. A: there was a four-fold increase in PKM2 gene expression levels in the liver. B: PKM2 protein expression was also increased in MCDD and PKM2 was localized within the Kupffer cells (top) compared with controls (bottom). C and D: Inos and Itgax were also increased in the liver of MCDD mice. E: PKM2 gene expression levels were increased in the liver of ob/ob (left bar) and LIRKO (right bar) mice. Arrowhead indicates an example of positive staining to PKM2 in Kupffer cells. *P < 0.05.
To further understand the metabolic factors regulating PKM2, we examined leptin-deficient ob/ob mice, a model of the metabolic syndrome, and LIRKO mice, a model in which the hepatocytes show complete insulin resistance, due to a >90% ablation of the insulin receptor. Importantly, ob/ob mice show severe steatosis, whereas LIRKO mice exhibit milder, but progressive liver dysfunction (30). Nonetheless, both ob/ob mice, relative to their lean controls, and LIRKO mice, relative to their littermate controls, showed an increase in PKM2 (Fig. 4E).
DISCUSSION
The major finding of this study is that individuals with severe obesity have very high serum levels of PKM2, which decline significantly after RYGB. In addition, our results show that in human patients and mice with NASH, PKM2 appears to be expressed in the liver and specifically in Kupffer cells (see Fig. 5). This finding is important because PKM2 is not known to be substantially expressed in the liver under normal conditions. On the basis of these findings, our working hypothesis is that Kupffer cells may be the main source of the secreted fraction of PKM2 in these patients, and thus, PKM2 may be a marker that correlates with the presence and reduction of inflammation within the liver. This hypothesis suggests a potential clinical utility of PKM2 levels as a test to monitor the progression or improvement of steatohepatitis. Such a test could guide the decision to promote aggressive treatment to prevent hepatic deterioration.
Fig. 5.
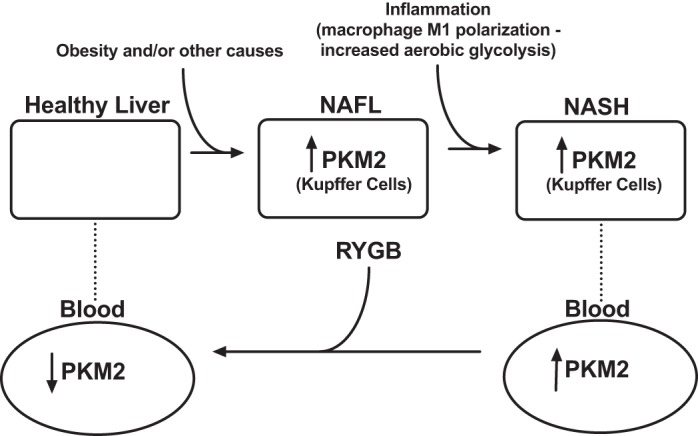
Conceptual diagram about the potential role of PKM2 in the natural history of NAFLD.
Recent studies suggest that Kupffer cells may play a crucial role in the development of steatohepatitis (51). Chemical depletion of these cells has been shown to alleviate hepatocellular damage, while mice lacking TLR4 signaling, which is important for the activation of Kupffer cells, have exhibited less severe hepatic injury and less accumulation of intrahepatic lipids when given the same MCDD diet that we used in our study. Presumably, in our study, Kupffer cells in mice and human patients with NASH augmented their glycolytic activity, as signified by the expression of PKM2 (6). This is consistent with the metabolic profile of M1-activated macrophages, which rely more on glycolysis for their energetic needs. Refocusing cellular metabolism away from an M1 metabolic state may be an effective strategy to suppress Kupffer cells’ proinflammatory activated profile and, thus, successfully alleviate hepatocellular damage and NASH (5, 16).
In our study, the reduction in serum PKM2 levels after RYGB was seen soon after the operation and was robust and long lasting. This effect was observed in patients who had their surgery within 56 days to 10 yr. Although this effect could be due to the reduction in adiposity and BMI, patients did not have a significant BMI reduction at early time points, and the post-RYGB PKM2 levels did not correlate with BMI. Our data in the lean LIRKO and the obese ob/ob mice show that insulin resistance in the hepatocytes is sufficient to drive PKM2 expression in the liver, but to a lesser degree than that observed in MCDD mice. MCDD mice do not have insulin resistance but exhibit significant liver damage similar to that observed in NASH, while ob/ob and LIRKO mice have only steatosis or moderate liver dysfunction. On the basis of these data, it is possible that the improvement in hepatocyte sensitivity and the reduction of hepatic fat content and inflammation that occurs after RYGB mediates the reduction in PKM2 levels. Consistently, the only study available in the GEO database repository with data on the hepatic gene expression profile after gastric bypass surgery showed a robust trend of reduction after RYGB. Nevertheless, the use of published gene expression profile data sets may be limited because the platforms do not use probes specific for the M2 isoenzyme of PK.
Another significant implication of our study is related to the recent proposition to use PKM2 levels as a test to screen for or monitor the progression of cancer. Our study suggests that this may not be possible in individuals with obesity (20, 25, 56). On the basis of our data, we could predict that more than 90% of patients with severe obesity would have PKM2 levels higher than the threshold used to predict cancer.
A limitation of this study is the lack of confirmatory liver biopsies in post-RYGB patients, as this would be too high risk to obtain for research purposes only. In addition, since PKM2 is expressed in several cell types, there are many potential sources that could explain its increased levels in obesity and NAFLD. Further studies would allow us to dissect the relative contribution of different anatomical substrates that may be responsible for the increased PKM2 levels. In addition, future studies could focus on the role of PKM2 in the pathogenesis of NAFLD or its utility as a treatment target and a marker of disease resolution.
GRANTS
This work was supported by R01-DK-108642 (NS), R01-DK-094162 (SBB), the Edward Mallinckrodt, Jr. Foundation (NS) and a Boston Children’s Hospital CHPA award.
DISCLOSURES
No conflicts of interest, financial or otherwise, are declared by the authors.
AUTHOR CONTRIBUTIONS
L.M., N.K.G., N. Saeidi, C.P., and N. Stylopoulos performed experiments; L.M., N.K.G., N. Saeidi, C.P., S.B.B., K.E.C., and N. Stylopoulos analyzed data; L.M., N.K.G., N. Saeidi, S.B.B., K.E.C., and N. Stylopoulos interpreted results of experiments; L.M., N.K.G., and N. Stylopoulos prepared figures; L.M., N.K.G., and N. Stylopoulos drafted manuscript; L.M., N.K.G., C.P., S.B.B., and N. Stylopoulos edited and revised manuscript; L.M., N.K.G., N. Saeidi, C.P., S.B.B., K.E.C., and N. Stylopoulos approved final version of manuscript; S.B.B. and N. Stylopoulos conceived and designed research.
ACKNOWLEDGMENTS
We thank N. Li of Tufts Comparative Pathology Services Core for technical assistance, Dr. Vikram Desphande and Dr. Omer Yilmaz for their help with the with histomorphological studies, and Hannah Whitley for administrative assistance.
REFERENCES
- 1.Ahrens M, Ammerpohl O, von Schönfels W, Kolarova J, Bens S, Itzel T, Teufel A, Herrmann A, Brosch M, Hinrichsen H, Erhart W, Egberts J, Sipos B, Schreiber S, Häsler R, Stickel F, Becker T, Krawczak M, Röcken C, Siebert R, Schafmayer C, Hampe J. DNA methylation analysis in nonalcoholic fatty liver disease suggests distinct disease-specific and remodeling signatures after bariatric surgery. Cell Metab 18: 296–302, 2013. doi: 10.1016/j.cmet.2013.07.004. [DOI] [PubMed] [Google Scholar]
- 2.Barres R, Kirchner H, Rasmussen M, Yan J, Kantor FR, Krook A, Näslund E, Zierath JR. Weight loss after gastric bypass surgery in human obesity remodels promoter methylation. Cell Reports 3: 1020–1027, 2013. [Erratum in Cell Reports 3: 1755, 2013] doi: 10.1016/j.celrep.2013.03.018. [DOI] [PubMed] [Google Scholar]
- 3.Berisha SZ, Serre D, Schauer P, Kashyap SR, Smith JD. Changes in whole blood gene expression in obese subjects with type 2 diabetes following bariatric surgery: a pilot study. PLoS One 6: e16729, 2011. doi: 10.1371/journal.pone.0016729. [DOI] [PMC free article] [PubMed] [Google Scholar]
- 4.Biddinger SB, Hernandez-Ono A, Rask-Madsen C, Haas JT, Alemán JO, Suzuki R, Scapa EF, Agarwal C, Carey MC, Stephanopoulos G, Cohen DE, King GL, Ginsberg HN, Kahn CR. Hepatic insulin resistance is sufficient to produce dyslipidemia and susceptibility to atherosclerosis. Cell Metab 7: 125–134, 2008. doi: 10.1016/j.cmet.2007.11.013. [DOI] [PMC free article] [PubMed] [Google Scholar]
- 5.Cassetta L, Cassol E, Poli G. Macrophage polarization in health and disease. Sci World J 11: 2391–2402, 2011. doi: 10.1100/2011/213962. [DOI] [PMC free article] [PubMed] [Google Scholar]
- 6.Christofk HR, Vander Heiden MG, Harris MH, Ramanathan A, Gerszten RE, Wei R, Fleming MD, Schreiber SL, Cantley LC. The M2 splice isoform of pyruvate kinase is important for cancer metabolism and tumour growth. Nature 452: 230–233, 2008. doi: 10.1038/nature06734. [DOI] [PubMed] [Google Scholar]
- 7.du Plessis J, van Pelt J, Korf H, Mathieu C, van der Schueren B, Lannoo M, Oyen T, Topal B, Fetter G, Nayler S, van der Merwe T, Windmolders P, Van Gaal L, Verrijken A, Hubens G, Gericke M, Cassiman D, Francque S, Nevens F, van der Merwe S. Association of adipose tissue inflammation with histologic severity of nonalcoholic fatty liver disease. Gastroenterology 149: 635–48.e14, 2015. doi: 10.1053/j.gastro.2015.05.044. [DOI] [PubMed] [Google Scholar]
- 8.Edlow AG, Hui L, Wick HC, Fried I, Bianchi DW. Assessing the fetal effects of maternal obesity via transcriptomic analysis of cord blood: a prospective case-control study. BJOG 123: 180–189, 2016. doi: 10.1111/1471-0528.13795. [DOI] [PMC free article] [PubMed] [Google Scholar]
- 9.Esser D, van Dijk SJ, Oosterink E, Lopez S, Müller M, Afman LA. High-fat challenges with different fatty acids affect distinct atherogenic gene expression pathways in immune cells from lean and obese subjects. Mol Nutr Food Res 59: 1563–1572, 2015. doi: 10.1002/mnfr.201400853. [DOI] [PubMed] [Google Scholar]
- 10.Ferreira E, Cronjé MJ. Selection of suitable reference genes for quantitative real-time PCR in apoptosis-induced MCF-7 breast cancer cells. Mol Biotechnol 50: 121–128, 2012. doi: 10.1007/s12033-011-9425-3. [DOI] [PubMed] [Google Scholar]
- 11.Ford ES, Giles WH, Dietz WH. Prevalence of the metabolic syndrome among US adults: findings from the third National Health and Nutrition Examination Survey. JAMA 287: 356–359, 2002. doi: 10.1001/jama.287.3.356. [DOI] [PubMed] [Google Scholar]
- 12.Frades I, Andreasson E, Mato JM, Alexandersson E, Matthiesen R, Martínez-Chantar ML. Integrative genomic signatures of hepatocellular carcinoma derived from nonalcoholic fatty liver disease. PLoS One 10: e0124544, 2015. doi: 10.1371/journal.pone.0124544. [DOI] [PMC free article] [PubMed] [Google Scholar]
- 13.Fung KY, Tabor B, Buckley MJ, Priebe IK, Purins L, Pompeia C, Brierley GV, Lockett T, Gibbs P, Tie J, McMurrick P, Moore J, Ruszkiewicz A, Nice E, Adams TE, Burgess A, Cosgrove LJ. Blood-based protein biomarker panel for the detection of colorectal cancer. PLoS One 10: e0120425, 2015. doi: 10.1371/journal.pone.0120425. [DOI] [PMC free article] [PubMed] [Google Scholar]
- 14.Ghosh S, Dent R, Harper ME, Gorman SA, Stuart JS, McPherson R. Gene expression profiling in whole blood identifies distinct biological pathways associated with obesity. BMC Med Genomics 3: 56, 2010. doi: 10.1186/1755-8794-3-56. [DOI] [PMC free article] [PubMed] [Google Scholar]
- 15.Haas JT, Miao J, Chanda D, Wang Y, Zhao E, Haas ME, Hirschey M, Vaitheesvaran B, Farese RV Jr, Kurland IJ, Graham M, Crooke R, Foufelle F, Biddinger SB. Hepatic insulin signaling is required for obesity-dependent expression of SREBP-1c mRNA but not for feeding-dependent expression. Cell Metab 15: 873–884, 2012. doi: 10.1016/j.cmet.2012.05.002. [DOI] [PMC free article] [PubMed] [Google Scholar]
- 16.Haschemi A, Kosma P, Gille L, Evans CR, Burant CF, Starkl P, Knapp B, Haas R, Schmid JA, Jandl C, Amir S, Lubec G, Park J, Esterbauer H, Bilban M, Brizuela L, Pospisilik JA, Otterbein LE, Wagner O. The sedoheptulose kinase CARKL directs macrophage polarization through control of glucose metabolism. Cell Metab 15: 813–826, 2012. doi: 10.1016/j.cmet.2012.04.023. [DOI] [PMC free article] [PubMed] [Google Scholar]
- 17.Hoggard N, Cruickshank M, Moar KM, Bashir S, Mayer CD. Using gene expression to predict differences in the secretome of human omental vs. subcutaneous adipose tissue. Obesity (Silver Spring) 20: 1158–1167, 2012. doi: 10.1038/oby.2012.14. [DOI] [PubMed] [Google Scholar]
- 18.Hulsmans M, Geeraert B, De Keyzer D, Mertens A, Lannoo M, Vanaudenaerde B, Hoylaerts M, Benhabilès N, Tsatsanis C, Mathieu C, Holvoet P. Interleukin-1 receptor-associated kinase-3 is a key inhibitor of inflammation in obesity and metabolic syndrome. PLoS One 7: e30414, 2012. doi: 10.1371/journal.pone.0030414. [DOI] [PMC free article] [PubMed] [Google Scholar]
- 19.Israelsen WJ, Vander Heiden MG. Pyruvate kinase: function, regulation and role in cancer. Semin Cell Dev Biol 43: 43–51, 2015. doi: 10.1016/j.semcdb.2015.08.004. [DOI] [PMC free article] [PubMed] [Google Scholar]
- 20.Kaura B, Bagga R, Patel FD. Evaluation of the pyruvate kinase isoenzyme tumor (Tu M2-PK) as a tumor marker for cervical carcinoma. J Obstet Gynaecol Res 30: 193–196, 2004. doi: 10.1111/j.1447-0756.2004.00187.x. [DOI] [PubMed] [Google Scholar]
- 21.Kenigsberg S, Bentov Y, Chalifa-Caspi V, Potashnik G, Ofir R, Birk OS. Gene expression microarray profiles of cumulus cells in lean and overweight-obese polycystic ovary syndrome patients. Mol Hum Reprod 15: 89–103, 2009. doi: 10.1093/molehr/gan082. [DOI] [PubMed] [Google Scholar]
- 22.Kirsch R, Clarkson V, Shephard EG, Marais DA, Jaffer MA, Woodburne VE, Kirsch RE, Hall PL. Rodent nutritional model of non-alcoholic steatohepatitis: species, strain and sex difference studies. J Gastroenterol Hepatol 18: 1272–1282, 2003. doi: 10.1046/j.1440-1746.2003.03198.x. [DOI] [PubMed] [Google Scholar]
- 23.Larter CZ, Yeh MM. Animal models of NASH: getting both pathology and metabolic context right. J Gastroenterol Hepatol 23: 1635–1648, 2008. doi: 10.1111/j.1440-1746.2008.05543.x. [DOI] [PubMed] [Google Scholar]
- 24.Lee YH, Nair S, Rousseau E, Allison DB, Page GP, Tataranni PA, Bogardus C, Permana PA. Microarray profiling of isolated abdominal subcutaneous adipocytes from obese vs non-obese Pima Indians: increased expression of inflammation-related genes. Diabetologia 48: 1776–1783, 2005. doi: 10.1007/s00125-005-1867-3. [DOI] [PMC free article] [PubMed] [Google Scholar]
- 25.Li R, Liu J, Xue H, Huang G. Diagnostic value of fecal tumor M2-pyruvate kinase for CRC screening: a systematic review and meta-analysis. Int J Cancer 131: 1837–1845, 2012. doi: 10.1002/ijc.27442. [DOI] [PubMed] [Google Scholar]
- 26.Liu W, Baker SS, Baker RD, Nowak NJ, Zhu L. Upregulation of hemoglobin expression by oxidative stress in hepatocytes and its implication in nonalcoholic steatohepatitis. PLoS One 6: e24363, 2011. doi: 10.1371/journal.pone.0024363. [DOI] [PMC free article] [PubMed] [Google Scholar]
- 27.Livak KJ, Schmittgen TD. Analysis of relative gene expression data using real-time quantitative PCR and the 2(-Delta Delta C(T)) Method. Methods 25: 402–408, 2001. doi: 10.1006/meth.2001.1262. [DOI] [PubMed] [Google Scholar]
- 28.López-Vicario C, González-Périz A, Rius B, Morán-Salvador E, García-Alonso V, Lozano JJ, Bataller R, Cofán M, Kang JX, Arroyo V, Clària J, Titos E. Molecular interplay between Δ5/Δ6 desaturases and long-chain fatty acids in the pathogenesis of non-alcoholic steatohepatitis. Gut 63: 344–355, 2014. doi: 10.1136/gutjnl-2012-303179. [DOI] [PubMed] [Google Scholar]
- 29.MacLaren RE, Cui W, Lu H, Simard S, Cianflone K. Association of adipocyte genes with ASP expression: a microarray analysis of subcutaneous and omental adipose tissue in morbidly obese subjects. BMC Med Genomics 3: 3, 2010. doi: 10.1186/1755-8794-3-3. [DOI] [PMC free article] [PubMed] [Google Scholar]
- 30.Michael MD, Kulkarni RN, Postic C, Previs SF, Shulman GI, Magnuson MA, Kahn CR. Loss of insulin signaling in hepatocytes leads to severe insulin resistance and progressive hepatic dysfunction. Mol Cell 6: 87–97, 2000. doi: 10.1016/S1097-2765(05)00015-8. [DOI] [PubMed] [Google Scholar]
- 31.Mokdad AH, Ford ES, Bowman BA, Dietz WH, Vinicor F, Bales VS, Marks JS. Prevalence of obesity, diabetes, and obesity-related health risk factors, 2001. JAMA 289: 76–79, 2003. doi: 10.1001/jama.289.1.76. [DOI] [PubMed] [Google Scholar]
- 32.Moylan CA, Pang H, Dellinger A, Suzuki A, Garrett ME, Guy CD, Murphy SK, Ashley-Koch AE, Choi SS, Michelotti GA, Hampton DD, Chen Y, Tillmann HL, Hauser MA, Abdelmalek MF, Diehl AM. Hepatic gene expression profiles differentiate presymptomatic patients with mild versus severe nonalcoholic fatty liver disease. Hepatology 59: 471–482, 2014. doi: 10.1002/hep.26661. [DOI] [PMC free article] [PubMed] [Google Scholar]
- 33.Mutch DM, Tordjman J, Pelloux V, Hanczar B, Henegar C, Poitou C, Veyrie N, Zucker JD, Clément K. Needle and surgical biopsy techniques differentially affect adipose tissue gene expression profiles. Am J Clin Nutr 89: 51–57, 2009. doi: 10.3945/ajcn.2008.26802. [DOI] [PubMed] [Google Scholar]
- 34.Nair S, Lee YH, Rousseau E, Cam M, Tataranni PA, Baier LJ, Bogardus C, Permana PA. Increased expression of inflammation-related genes in cultured preadipocytes/stromal vascular cells from obese compared with non-obese Pima Indians. Diabetologia 48: 1784–1788, 2005. doi: 10.1007/s00125-005-1868-2. [DOI] [PMC free article] [PubMed] [Google Scholar]
- 35.Nilsson LM, Abrahamsson A, Sahlin S, Gustafsson U, Angelin B, Parini P, Einarsson C. Bile acids and lipoprotein metabolism: effects of cholestyramine and chenodeoxycholic acid on human hepatic mRNA expression. Biochem Biophys Res Commun 357: 707–711, 2007. doi: 10.1016/j.bbrc.2007.03.196. [DOI] [PubMed] [Google Scholar]
- 36.Oñate B, Vilahur G, Camino-López S, Díez-Caballero A, Ballesta-López C, Ybarra J, Moscatiello F, Herrero J, Badimon L. Stem cells isolated from adipose tissue of obese patients show changes in their transcriptomic profile that indicate loss in stemcellness and increased commitment to an adipocyte-like phenotype. BMC Genomics 14: 625, 2013. doi: 10.1186/1471-2164-14-625. [DOI] [PMC free article] [PubMed] [Google Scholar]
- 37.Ortega FJ, Mercader JM, Moreno-Navarrete JM, Nonell L, Puigdecanet E, Rodriquez-Hermosa JI, Rovira O, Xifra G, Guerra E, Moreno M, Mayas D, Moreno-Castellanos N, Fernández-Formoso JA, Ricart W, Tinahones FJ, Torrents D, Malagón MM, Fernández-Real JM. Surgery-induced weight loss is associated with the downregulation of genes targeted by microRNAs in adipose tissue. J Clin Endocrinol Metab 100: E1467–E1476, 2015. doi: 10.1210/jc.2015-2357. [DOI] [PubMed] [Google Scholar]
- 38.Park JJ, Berggren JR, Hulver MW, Houmard JA, Hoffman EP. GRB14, GPD1, and GDF8 as potential network collaborators in weight loss-induced improvements in insulin action in human skeletal muscle. Physiol Genomics 27: 114–121, 2006. doi: 10.1152/physiolgenomics.00045.2006. [DOI] [PubMed] [Google Scholar]
- 39.Pihlajamäki J, Boes T, Kim EY, Dearie F, Kim BW, Schroeder J, Mun E, Nasser I, Park PJ, Bianco AC, Goldfine AB, Patti ME. Thyroid hormone-related regulation of gene expression in human fatty liver. J Clin Endocrinol Metab 94: 3521–3529, 2009. doi: 10.1210/jc.2009-0212. [DOI] [PMC free article] [PubMed] [Google Scholar]
- 40.Pihlajamäki J, Lerin C, Itkonen P, Boes T, Floss T, Schroeder J, Dearie F, Crunkhorn S, Burak F, Jimenez-Chillaron JC, Kuulasmaa T, Miettinen P, Park PJ, Nasser I, Zhao Z, Zhang Z, Xu Y, Wurst W, Ren H, Morris AJ, Stamm S, Goldfine AB, Laakso M, Patti ME. Expression of the splicing factor gene SFRS10 is reduced in human obesity and contributes to enhanced lipogenesis. Cell Metab 14: 208–218, 2011. doi: 10.1016/j.cmet.2011.06.007. [DOI] [PMC free article] [PubMed] [Google Scholar]
- 41.Rabl C, Campos GM. The impact of bariatric surgery on nonalcoholic steatohepatitis. Semin Liver Dis 32: 80–91, 2012. doi: 10.1055/s-0032-1306428. [DOI] [PubMed] [Google Scholar]
- 42.Rai MF, Patra D, Sandell LJ, Brophy RH. Relationship of gene expression in the injured human meniscus to body mass index: a biologic connection between obesity and osteoarthritis. Arthritis Rheumatol 66: 2152–2164, 2014. doi: 10.1002/art.38643. [DOI] [PMC free article] [PubMed] [Google Scholar]
- 43.Rinella ME, Green RM. The methionine-choline deficient dietary model of steatohepatitis does not exhibit insulin resistance. J Hepatol 40: 47–51, 2004. doi: 10.1016/j.jhep.2003.09.020. [DOI] [PubMed] [Google Scholar]
- 44.Rinella ME, Sanyal AJ. Management of NAFLD: a stage-based approach. Nat Rev Gastroenterol Hepatol 13: 196–205, 2016. doi: 10.1038/nrgastro.2016.3. [DOI] [PubMed] [Google Scholar]
- 45.Saeidi N, Meoli L, Nestoridi E, Gupta NK, Kvas S, Kucharczyk J, Bonab AA, Fischman AJ, Yarmush ML, Stylopoulos N. Reprogramming of intestinal glucose metabolism and glycemic control in rats after gastric bypass. Science 341: 406–410, 2013. doi: 10.1126/science.1235103. [DOI] [PMC free article] [PubMed] [Google Scholar]
- 46.Soronen J, Laurila PP, Naukkarinen J, Surakka I, Ripatti S, Jauhiainen M, Olkkonen VM, Yki-Järvinen H. Adipose tissue gene expression analysis reveals changes in inflammatory, mitochondrial respiratory and lipid metabolic pathways in obese insulin-resistant subjects. BMC Med Genomics 5: 9, 2012. doi: 10.1186/1755-8794-5-9. [DOI] [PMC free article] [PubMed] [Google Scholar]
- 47.Spandidos A, Wang X, Wang H, Seed B. PrimerBank: a resource of human and mouse PCR primer pairs for gene expression detection and quantification. Nucleic Acids Res 38, Suppl_1: D792–D799, 2010. doi: 10.1093/nar/gkp1005. [DOI] [PMC free article] [PubMed] [Google Scholar]
- 48.Starley BQ, Calcagno CJ, Harrison SA. Nonalcoholic fatty liver disease and hepatocellular carcinoma: a weighty connection. Hepatology 51: 1820–1832, 2010. doi: 10.1002/hep.23594. [DOI] [PubMed] [Google Scholar]
- 49.Tam CS, Heilbronn LK, Henegar C, Wong M, Cowell CT, Cowley MJ, Kaplan W, Clément K, Baur LA. An early inflammatory gene profile in visceral adipose tissue in children. Int J Pediatr Obes 6: e360–e363, 2011. doi: 10.3109/17477166.2011.575152. [DOI] [PMC free article] [PubMed] [Google Scholar]
- 50.Torres DM, Williams CD, Harrison SA. Features, diagnosis, and treatment of nonalcoholic fatty liver disease. Clin Gastroenterol Hepatol 10: 837–858, 2012. doi: 10.1016/j.cgh.2012.03.011. [DOI] [PubMed] [Google Scholar]
- 51.Tosello-Trampont AC, Landes SG, Nguyen V, Novobrantseva TI, Hahn YS. Kuppfer cells trigger nonalcoholic steatohepatitis development in diet-induced mouse model through tumor necrosis factor-α production. J Biol Chem 287: 40,161–40,172, 2012. doi: 10.1074/jbc.M112.417014. [DOI] [PMC free article] [PubMed] [Google Scholar]
- 52.Vander Heiden MG, Locasale JW, Swanson KD, Sharfi H, Heffron GJ, Amador-Noguez D, Christofk HR, Wagner G, Rabinowitz JD, Asara JM, Cantley LC. Evidence for an alternative glycolytic pathway in rapidly proliferating cells. Science 329: 1492–1499, 2010. doi: 10.1126/science.1188015. [DOI] [PMC free article] [PubMed] [Google Scholar]
- 53.Vandesompele J, De Preter K, Pattyn F, Poppe B, Van Roy N, De Paepe A, Speleman F. Accurate normalization of real-time quantitative RT-PCR data by geometric averaging of multiple internal control genes. Genome Biol 3: research0034.1, 2002. doi: 10.1186/gb-2002-3-7-research0034. [DOI] [PMC free article] [PubMed] [Google Scholar]
- 54.Wruck W, Kashofer K, Rehman S, Daskalaki A, Berg D, Gralka E, Jozefczuk J, Drews K, Pandey V, Regenbrecht C, Wierling C, Turano P, Korf U, Zatloukal K, Lehrach H, Westerhoff HV, Adjaye J. Multi-omic profiles of human non-alcoholic fatty liver disease tissue highlight heterogenic phenotypes. Sci Data 2: 150068, 2015. doi: 10.1038/sdata.2015.68. [DOI] [PMC free article] [PubMed] [Google Scholar]
- 55.Yang W, Xia Y, Cao Y, Zheng Y, Bu W, Zhang L, You MJ, Koh MY, Cote G, Aldape K, Li Y, Verma IM, Chiao PJ, Lu Z. EGFR-induced and PKCε monoubiquitylation-dependent NF-κB activation upregulates PKM2 expression and promotes tumorigenesis. Mol Cell 48: 771–784, 2012. [Erratum in Mol Cell 69: 347, 2018] doi: 10.1016/j.molcel.2012.09.028. [DOI] [PMC free article] [PubMed] [Google Scholar]
- 56.Zhang B, Chen JY, Chen DD, Wang GB, Shen P. Tumor type M2 pyruvate kinase expression in gastric cancer, colorectal cancer and controls. World J Gastroenterol 10: 1643–1646, 2004. doi: 10.3748/wjg.v10.i11.1643. [DOI] [PMC free article] [PubMed] [Google Scholar]