

Abstract
Hyperinsulinemia, accompanied by reduced first-pass hepatic insulin extraction (FPE) and increased secretion, is a primary response to insulin resistance. Different in vivo methods are used to estimate the clearance of insulin, which is assumed to reflect FPE. We compared two methodologically different but commonly used indirect estimates with directly measured FPE in healthy dogs (n = 9). The indirect methods were 1) metabolic clearance rate of insulin (MCR) during the hyperinsulinemic-euglycemic clamp (EGC), a steady-state method, and 2) fractional clearance rate of insulin (FCR) during the frequently sampled intravenous glucose tolerance test (FSIGT), a dynamic method. MCR was calculated as the ratio of insulin infusion rate to steady-state plasma insulin. FCR was calculated as the exponential decay rate constant of the injected insulin. Directly measured FPE is based on the difference in insulin measurements during intraportal vs. peripheral vein insulin infusions. We found a strong correlation between indirect FCR (min−1) and FPE (%). In contrast, we observed a poor association between MCR (ml·min−1·kg−1) and FPE (%). Our findings in canines suggest that FCR measured during FSIGT can be used to estimate FPE. However, MCR calculated during EGC appears to be a poor surrogate for FPE.
Keywords: hepatic insulin extraction, insulin catabolism, insulin clearance, liver
INTRODUCTION
The astronomical rise of type 2 diabetes in the past decades (7), despite increased education and awareness, requires that robust early intervention measures should be instituted to detect high-risk individuals before the onset of the disease. Insulin resistance, marked by hyperinsulinemia, precedes the development of diabetes (23); thus, more efforts should be focused on the comprehensive understanding of the hyperinsulinemic state. Both increased insulin secretion and reduced insulin clearance contribute to hyperinsulinemic compensation during insulin resistance (22). However, current evidence increasingly supports reduced insulin clearance led by decreased first-pass hepatic insulin extraction (FPE) as a dominant factor during hyperinsulinemic compensation (3, 22). While insulin is cleared by the kidney, muscle, and adipose tissue, it is the liver which metabolizes most, between 50 and 80% (11, 34). The liver’s ability to extract the majority of endogenous insulin lies in the unique FPE, where ~50% of insulin secreted into the portal vein is extracted by the liver before joining the systemic circulation. Thus, the liver, with its FPE, acts as a filter for pancreatic β-cell secretion, regulating how much insulin is allowed into systemic circulation for action on extrahepatic target tissues. Different methods are used as surrogates to estimate the clearance of insulin in vivo, including the hyperinsulinemic-euglycemic clamp (EGC), insulin-modified intravenous glucose tolerance test/frequently sampled intravenous glucose tolerance test (FSIGT) (2), insulin suppression test (IST) (20), and intraperitoneal insulin tolerance test (IITT) (9). These surrogate methods differ; measurement occurs at steady state in EGC and IST vs. the dynamic conditions of FSIGT and IITT; yet it is often assumed that clearance measurements from these protocols are reflective of physiological hepatic insulin catabolism (2).
Importantly, endogenous insulin is secreted into the portal vein and must transit the liver before accessing the general circulation; yet in these surrogate methods insulin is delivered directly into the systemic blood pool. For this reason, extrahepatic tissues, particularly the kidneys, clear a greater proportion of exogenous insulin than endogenous (13). As seen in some type 2 diabetes cases, as renal insufficiency develops, exogenous insulin requirements are drastically reduced or cease entirely (21). Thus, it is imperative that a concise understanding of how these surrogate methods of in vivo insulin clearance measurement correlate with the all-important FPE, which we are able to measure directly. In this study, we compared directly measured FPE with the metabolic clearance rate of insulin (MCR), estimated from the constant-infusion steady-state protocol EGC and fractional clearance rate constant (FCR) from the dynamic plasma insulin protocol FSIGT.
RESEARCH DESIGN AND METHODS
Animals
Nine healthy dogs were housed in individualized kennels in 12:12-h light-dark climate-controlled rooms in the institution’s vivarium. The dogs were inspected daily by a certified veterinary physician to make certain they were in excellent health. Body weight, temperature, and hematocrit were checked before each experiment. Animals were fasted overnight before each experiment. Dogs were studied under the supervision of the Institutional Animal Care and Use Committee.
Diet
Animals were presented daily with weight stabilization food containing a mixture of dry chow (42.4% carbohydrate, 27.7% protein, 29.9% fat, and 2.9% fiber; LabDiet, PMI Nutrition, Brentwood, MO) and a can of Proplan Classic Puppy Chow (10% protein, 7%fat, 1.5% fiber, and 76% moisture; Nestle Purina, St Louis, MO) for gross calories of 3,576 kcal/day. The carbohydrate content of the food was 39.2%, 32.5% from fat and 28.3% from protein. They had unlimited access to water.
Surgeries
Each dog underwent laparotomic surgery whereby a 7-in. french chronic catheter was inserted into the portal vein at ~3.5 cm from the portahepatis and tunneled subcutaneously to a vascular access port (VAP) attached to the iliocostalis lumborum muscle. Dogs were allowed ~2–3 wk to recover from the surgery before the onset of experiments. Patency of the catheter and VAP was maintained by a weekly withdrawal of 3–6 ml of blood when possible, flushing with 20 ml of saline, and locking with 2 ml of Taurolidine-Citrate catheter solution (Access Technologies, Skokie, IL).
Experimental Design
Each dog underwent four randomized experiments, with each separated from the next by a minimum of three recovery days. However, portal insulin infusion and peripheral insulin infusion protocols (PPII) were paired experiments and were always performed one after the other: 1) hyperinsulinemic-euglycemic clamp (EGC), 2) insulin-modified intravenous glucose tolerance test/frequently sampled intravenous glucose tolerance test (FSIGT), 3) portal insulin infusion protocol, and 4) peripheral insulin infusion protocol.
EGC
Eighteen-gauge intracatheters were inserted into the two saphenous veins of the hindlegs and a foreleg cephalic vein and secured in place while dogs were resting in the Pavlov sling. A primed infusion (25 μCi + 0.25 μCi/min) of [3-3H]glucose (PerkinElmer, Waltham, MA) was started at −120 min until the end of the 300-min-long experiment. After 90 min of tracer equilibration, four basal samples were taken at −30, −20, −10, and −1 min. At 0 min, 4.5 pmol·kg−1·min−1 of insulin (Eli Lilly, Indianapolis, IN) was started and continued for the next 180 min, until the end of the experiment to establish hyperinsulinemia. Somatostatin (Bachem, Torrance, CA) infusion at 1.0 μg·kg−1·min−1 was also started and continued from t = 0 min to the end of the experiment to inhibit insulin and glucagon secretion. To maintain euglycemia and stable specific activity in the plasma, 50% dextrose was mixed with [3-3H]glucose tracer (2.0 μCi/g) and infused peripherally at a variable rate (14). Samples were taken every 10 min throughout the experiment from the catheterized cephalic vein, except from 60−120 min, when samples were taken every 15 min. The blood samples were centrifuged, and plasma glucose was immediately read with a glucose analyzer (Yellow Springs Instrument, Yellow Springs, OH). The rest of the plasma samples were frozen until ready to be assayed for insulin. The last 30 min of the experiment were considered the steady state.
FSIGT
While dogs were resting in a Pavlov sling, a saphenous vein was cannulated with an 18-gauge intracatheter and secured in place for frequent blood sampling as well as injection of glucose and insulin. Body temperature and hematocrit were checked, and three basal samples were taken at −20, −10 and −1 min. At t = 0 min, 0.3 g/kg glucose (50% dextrose solution; Phoenix Pharm, St. Joseph, MO) was injected, and blood samples were taken at 2, 3, 4, 5, 6, 8, 10, 12, 14, 16, and 19 min. Insulin (0.03 U/kg) was injected at t = 20 min, and blood samples were subsequently taken at 22, 23, 24, 25, 30, 40, 50, 60, 70, 80, 90, 100, 110, 120, 140, 160, and 180 min. Blood samples for glucose and insulin assays were collected into microtubes coated with lithium-heparin and EDTA at 1 mg/ml blood. Blood collection microtubes for C-peptide assay were lithium-heparin coated, had aprotinin (Sigma-Aldrich, Saint Louis, M)) at ~500 KIU and 1 mg EDTA/ml blood. Blood samples were placed on ice and centrifuged, and the plasma was aliquoted and frozen at −80°C until ready to be assayed for C-peptide.
Paired PPII of Measuring First-Pass Hepatic Insulin Extraction
As previously described (1, 22), in this paired protocol, matched experiments were performed on two different days on each animal with three incremental insulin infusion rates, through the portal vein on one day or peripherally on the other day. At least three days were allowed between the experiments for the animals to recover. The experiments were randomized to avoid order bias.
After three basal samples were taken at −110, −100, and −91 min, somatostatin infusion (1.0 μg·kg−1·min−1) through a saphenous vein was started at −90 min and continued for the entire duration of the experiment (360 min) to suppress insulin and glucagon secretion. At t = 0 min, glucagon (1.3 ng·kg−1·min−1) was replaced through a chronic catheter in the portal vein until the end of the experiment. Insulin was infused at 1.5 pmol·kg−1·min−1 from 0 to 90 min, at 3.0 pmol·kg−1·min−1 from t = 90 to 180 min, and at 4.5 pmol·kg−1·min−1 from t = 180 to 270 min through a saphenous vein during the peripheral infusion protocol. During the portal infusion protocol, insulin was infused at 3.0 pmol·kg−1·min−1 from 0 to 90 min, at 6.0 pmol·kg−1·min−1 from 90 to 180 min, and at 9.0 pmol·kg−1·min−1 from 180 to 270 min through the portal vein. The portal insulin infusion rates were twice those of the peripheral protocol to achieve matching systemic insulin in both experiments. The somatostatin-only infusion period, from t = −90 to 0 min, was considered the 0 pmol·kg−1·min−1 insulin infusion stage. Blood samples were taken every 10 min through a cephalic vein. About 1 ml of sampled blood was collected into a microtube containing lithium-heparin, aprotinin, and EDTA for C-peptide assay. Another 1 ml of blood was collected into microtubes containing lithium-heparin and 1 mg of EDTA for glucose and insulin assay. After centrifugation, plasma glucose was read immediately, and glucose infusion through a saphenous vein was adjusted to maintain euglycemia. The remaining plasma was immediately stored at −20°C for insulin assay. The last 30 min of each 90-min insulin infusion was considered the steady state for that dose. Plasma for C-peptide measurement was stored at −80°C until ready to be assayed.
Assays
Immediately after sampling, plasma glucose was measured by the glucose oxidase method using a YSI 2700 autoanalyzer (Yellow Springs Instrument, Yellow Springs, OH). The coefficient of variation (CV) of repeated glucose readings was <1%. Plasma for insulin measurements was stored at −20°C until time of assay via ELISA kit (ALPCO, Salem, NH). The intra and interassay CVs of insulin were 2.4 ± 0.3% and 2.9 ± 1.3%, respectively. C-peptide was assayed by radioimmunoassay (EMD Millipore, Billerica, MA) with intra-assay and interassay CVs of 3.2 and 6.3%, respectively.
Definition of Terms
MCR (ml/min) is defined as the volume of plasma completely purged (cleared) of insulin per time unit (6, 11). Often, it is normalized by the body weight or surface area; thus, MCR is expressed in milliliters per minute per kilogram or milliliters per minute per square meter.
FCR constant (min−1) is defined as the percentage/fraction of plasma cleared of insulin per unit time; thus, FCR (min−1) = MCR (ml/min)/plasma volume (ml) (6).
First-pass hepatic extraction is the fraction of portal insulin extracted by the liver before joining systemic circulation.
Calculations
MCR of insulin estimated from EGC.
MCR from the EGC was calculated as the ratio of insulin infusion rate to the steady-state plasma insulin concentration, according to the dilution principle (13). Thus:
| (1) |
FCR from FSIGT.
FCR constant k (min−1) was estimated from the plasma insulin concentrations from t = 22 to 80 min with WINSAAM software version 3.0.1 (Kennett Square, PA) according to the equation (2, 26)
| (2) |
where Insulin, is the plasma insulin concentration at sample time t, Insulinbasal is the basal plasma insulin, and Insulinmax is the peak insulin concentration during the FSIGT.
The chosen dynamic range of 22–80 min encompasses the duration that plasma insulin returns to the basal level after the exogenous injection. It also avoids the fluctuations in plasma insulin that could occur at later stages when insulin levels fall below the basal concentrations (2, 26). The underlying assumption in this equation is that the high concentration of the injected insulin suppresses endogenous insulin secretion, on the principle of feedback inhibition (2, 26).
First-pass hepatic insulin extraction from PPII.
Insulin clearance rate, Cl, is calculated as the reciprocal of the slope (m) of the best-fit line of insulin infusion rates (pmol·min−1·kg−1) to steady-state plasma insulin concentrations (pM) from the three-step insulin euglycemic clamp (see Fig. 3B) (6, 22). Thus:
Fig. 3.

Paired portal/peripheral insulin infusion (PPII) clamp for measuring first-pass hepatic insulin extraction. A: insulin profile during the PPII experiments. For portal infusion protocol (○), Insulin 1 = 3.0 pmol·kg−1·min−1, Insulin 2 = 6.0 pmol·kg−1·min−1, and Insulin 3 = 9.0 pmol·kg−1·min−1. For peripheral infusion protocol (■), Insulin 1 = 1.5 pmol·kg−1·min−1, Insulin 2 = 3.0 pmol·kg−1·min−1, and Insulin 3 = 4.5 pmol·kg−1·min−1. One-half the portal infusion rates were used in the peripheral protocol for matching systemic concentrations. B: infusion rate vs. steady-state plasma insulin concentration. Correlation coefficient r for peripheral infusion vs. steady-state concentration (■) was 0.99, and slope, mpe, was 53.1 kg·min−1·l−1. For portal infusion vs. steady-state concentration (○), r = 0.98 and slope, mpo, was 26.7 kg·min−1·l−1. FPE (%) = [1 − (mpo/mpe)] × 100 = 50%; refer to Eq. 6. Each data point is a mean ± SE of n = 9.
| (3) |
Accordingly, intraportally infused insulin clearance rate, Clpo, and peripherally infused insulin clearance rate, Clpe, were calculated from the respective slopes (mpo and mpe) of the plot of the insulin infusion rates vs. steady-state insulin concentrations (Fig. 3B).
The difference between intraportally infused insulin clearance rate and peripherally infused insulin clearance rate gave the first-pass hepatic insulin clearance rate
| (4) |
The assumptions in this estimation are that insulin kinetics were linear within the concentrations studied, and also post-first-pass hepatic insulin clearances were identical in both experiments (12).
First-pass hepatic insulin extraction, then, is the ratio of first-pass insulin clearance rate to the intraportal infusion clearance rate, which can then be expressed as a percentage:
| (5) |
Combining Eqs. 3 and 5 above gives
| (6) |
Statistical Analysis
All data are reported as means ± SE. Spearman’s ranked order correlation was used for the association analysis. Correlations were considered statistically significant when the P value was <0.05.
RESULTS
All dogs were lean (body weight, 27.7 ± 1.1 kg) with appropriate fasting glucose (95.6 ± 0.8 mg/dl) and glucose tolerance [Kg (×10−2), 3.18 ± 0.40 min−1], suggesting no diabetes or metabolic impairment. However, fasting insulin among the animals was highly varied, with a standard deviation of 31.2 pM from a range of 21.9–114.8 pM.
EGC
The plasma insulin concentration remained relatively steady from ~30 min after the start of the insulin infusion until the end of the experiment. The insulin infusion rate of 4.5 pmol/kg/min for 3 h yielded a steady-state concentration of 242.9 ± 26.0 pM during the EGC (Fig. 1A). The mean MCR was 20.5 ± 2.3 ml/min/kg (Table 1) from a range of 12.7–31.3 ml/min/kg. Euglycemia was targeted at ~95 mg/dl (Fig. 1B).
Fig. 1.

A: plasma insulin profile during a hyperinsulinemic-euglycemic clamp (EGC). B: plasma glucose during EGC.
Table 1.
FPE, FCR, and MCR of dogs in the experiments
| Dog No. | FPE, % | FCR, min−1 | MCR, ml·min−1·kg−1 |
|---|---|---|---|
| 1 | 22.37 | 0.417 | 20.03 |
| 2 | 24.33 | 0.362 | 13.89 |
| 3 | 31.82 | 0.421 | 28.00 |
| 4 | 42.49 | 0.429 | 12.71 |
| 5 | 53.02 | 0.495 | 13.65 |
| 6 | 58.95 | 0.564 | 15.99 |
| 7 | 66.05 | 0.597 | 24.06 |
| 8 | 72.05 | 0.550 | 31.27 |
| 9 | 77.17 | 0.497 | 25.00 |
| Mean ± SE | 49.80 ± 6.85 | 0.481 ± 0.026 | 20.51 ± 2.29 |
FPE, first-pass hepatic insulin extraction; FCR, fractional clearance rate; MCR, metabolic clearance rate.
FSIGT
After insulin injection, ~35% of the measured peak insulin was cleared from the plasma within one minute (2173.2 ± 92.5 pM at 22 min to 1423.0 ± 116.2 pM at 23 min; Fig. 2A). Sixty-nine percent (2173.2 ± 92.5 pM at 22 min to 675.2 ± 55.4 pM at 24 min) cleared by two minutes and 74% (2173.2 ± 92.5 pM at 22 min to 564.5 ± 45.8 pM at 25 min) of peak insulin cleared at three minutes (Fig. 2A). At t = 30 min and t = 40 min, 88% (plasma concentration, 256.1 ± 29.4 pM) and 96% (plasma concentration, 92.2 ± 13.5 pM) of peak insulin had been extracted respectively. At t = 50 min, the plasma insulin concentration (51.5 ± 12.9 pM) had returned to fasting levels (51.9 ± 12.0 pM). The mean FCR was 0.48 ± 0.03 min−1, with a range of 0.36−0.60 min−1.
Fig. 2.

A: plasma insulin profile during a frequently sampled intravenous glucose tolerance test (FSIGT). B: plasma glucose during FSIGT.
Insulin secretion determined by C-peptide deconvolution at basal was 1.5 ± 0.2 pmol/kg/min. Two minutes after the glucose bolus, it peaked at 19.2 ± 1.4 pmol/kg/min. At t = 19min, just before the exogenous insulin injection, it had gradually decreased to 4.1 ± 0.8 pmol/kg/min. At t = 22min, two minutes after the exogenous insulin injection, secretion rate was 3.5 ± 1.1 pmol·kg−1·min−1 (15.8% suppression from preexogenous insulin injection). At t = 23 min, insulin secretion had been suppressed by 47.9% to 2.2 pmol·kg−1·min−1 and 71.5% at t = 24 min to 1.2 pmol·kg−1·min−1. At t = 40 min, the immediate preexogenous injection insulin secretion rate had been suppressed by 82.8% to 0.7 ± 0.3 pmol·kg−1·min−1, and at t = 60 min it had been suppressed by 94.8% to 0.2 ± 0.1 pmol·kg−1·min−1.
PPII
The portal infusion of 3.0, 6.0, and 9.0 pmol·kg−1·min−1 yielded average steady-state plasma insulin concentrations of 75.6 ± 14.4, 150.7 ± 22.6, and 268.6 ± 36.7 pM respectively (Fig. 3A). During the peripheral infusion protocol, the respective rates of 1.5, 3.0, and 4.5 pmol·kg−1·min−1 resulted in corresponding plasma insulin concentrations of 96.9 ± 9.1, 169.3 ± 13.9, and 263.9 ± 19.7 pM (Fig. 3A). However, despite constant peripheral somatostatin infusion, endogenous insulin secretion was not completely suppressed in most of the dogs (6/9). There was an average of 70% relative suppression before the insulin infusions (Fig. 4). The three dogs with complete inhibition of insulin secretion before the insulin infusions had FPEs of 31.8%, 66.1%, and 77.2%. There was no relationship between the residual insulin secretions and FPE. The linear correlation coefficient r of the least square regression line of insulin infusion rate vs. corresponding steady-state plasma insulin concentration was 0.98 and 0.99 for the portal and peripheral infusion protocols, respectively, indicative of linear insulin kinetics within these concentrations (Fig. 3B). There was a surprisingly large range of FPE among the animals, from 22.4% to 77.2% (Table 1).
Fig. 4.
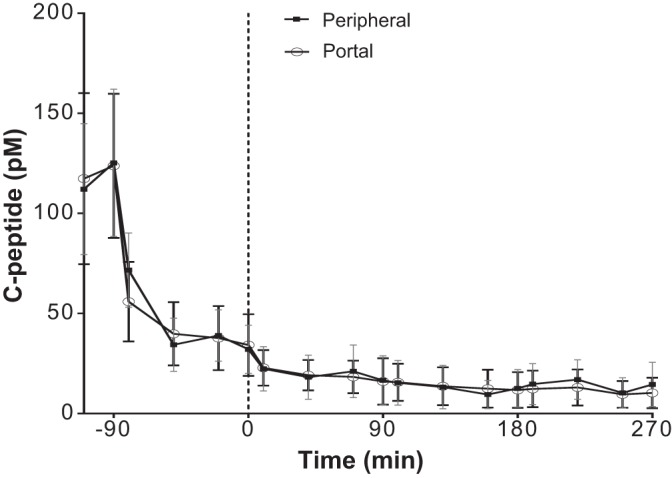
C-peptide profile during the paired portal/peripheral insulin infusion experiments.
Correlations
A significant positive correlation between FPE (%) and FCR (min−1) was found (rs = 0.83, P = 0.005; Fig. 5B), but the association between FPE (%) and MCR (ml·kg−1·min−1) was not significant (rs = 0.42, P = 0.26; Fig. 5A). MCR (ml·kg−1·min−1) and FCR (min−1) were also poorly correlated (rs = 0.28, P = 0.46; Fig. 5C).
Fig. 5.

Correlation analysis between first-pass hepatic insulin extraction (FPE), metabolic clearance rate (MCR), and fractional clearance rate (FCR). A: FPE vs. MCR; rs = 0.42, P = 0.26. B: FPE vs. FCR; rs = 0.83, P = 0.005. C: FCR vs. MCR; rs = 0.28, P = 0.46.
DISCUSSION
Insulin clearance is a major component regulating insulin levels in the body and can be an important aspect of hyperinsulinemic compensation and the progression to diabetes. However, methods of estimating clearance have so far not been adequately compared. In addition, there are large interindividual variations in the contribution of various organs to insulin clearance rates (31, 32). The major organs of insulin metabolism are liver, which is estimated to extract between 50 and 80% of total insulin (11), and kidney, reported to be responsible for ~25% of endogenous insulin clearance (16) and about one-third of peripherally infused insulin (13, 36). Muscle has an extraction fraction of 6.2% (39) and, with other peripheral insulin-sensitive tissues, accounts for ~13% of total insulin clearance (5). Liver insulin extraction is therefore thought to be the primary method of regulating insulin clearance. The fenestrated endothelial lining of hepatic capillaries allows immediate access to liver’s parenchymal cells (4); thus, insulin clearance can begin promptly. In hepatocytes, carcinoembryonic antigen-related cell adhesion molecule-1 (CEACAM1), a transmembrane substrate of the insulin receptor, facilitates the internalization of the bound insulin, thereby enhancing its eventual degradation in the endosome-lysosomal pathway (28).
Here, we compared various methods of estimated insulin clearance in vivo with a direct measure of FPE, and we demonstrated that FCR from FSIGT, but not MCR from EGC, may be used as a reasonably accurate surrogate measure of first-pass hepatic insulin extraction.
FPE is calculated from paired intraportal and peripheral infusions and therefore provides a direct measure of the hepatic extraction of insulin. FCR calculated from the FSIGT correlated well with FPE and also demonstrated that 88% of the peak insulin is cleared within 8 min. Thus, when exposed to a bolus of insulin, FSIGT results demonstrate a rapid clearance of insulin, consistent with hepatic insulin extraction. Insulin secretion was not completely suppressed by the exogenous insulin in FSIGT, as measured by deconvolution of the C-peptide data. However, the low levels of endogenous insulin production account for only a small amount of the plasma insulin present and as such would not substantially alter the calculation of FCR. Even at the peak secretion after the insulin bolus, we observed only ~96 pmol/min of extra secreted insulin, contributing to less than 1.5% of the total plasma insulin level.
The MCR rates calculated from the EGC do not correlate well with FPE. There may be a variety of factors contributing to this lack of correlation, including increased clearance by nonhepatic tissues during clamps or a saturation of the insulin clearance system in the clamp setting. Also, glucagon was not replaced during the EGC, whereas with PPII, glucagon was replaced. Glucagon and somatostatin infusions have been suggested to cooperate to suppress hepatic insulin extraction (18), which will then impact on the association between MCR and FPE. Nonetheless, these results suggest that MCR calculated during clamps should be considered with caution, as MCR from clamps may not be a good index of hepatic insulin clearance.
Saturation of Insulin Clearance During Clamp?
Some studies in dogs (27) and humans (15, 40) report a reduction in MCR at steady state from basal during euglycemic clamp even at physiological insulin concentration conditions, denoting saturation of the insulin system. Possible saturation and/or downregulation of the expression of insulin receptors were suggested to be the reasons for the reduced MCR (27). However, several studies (1, 13, 38, 42) have reported linearity of insulin kinetics within physiological concentrations. In dogs, Stevenson et. al. (42) documented linearity of insulin kinetics up to 660 pM of systemic concentrations. In humans, Sacca et al. (38) reported that the kinetics of insulin were linear within the explored range of 198–630 pM. Importantly, we did not observe any saturation of the insulin system in the range of insulin infusions (1.5–9 pmol·kg−1·min−1) used, yielding venous concentrations of 22.8–406.1 pM (Fig. 3A) in either the portal or peripheral infusion protocols. The correlation coefficients r = 0.98 and r = 0.99 between insulin infusion rates and plasma insulin of the respective portal and peripheral infusion protocols signify linear insulin kinetics in the concentrations studied (Fig. 3B). We can thus assume linear insulin kinetics during the 4.5 pmol·kg−1·min−1 insulin infusion EGC, yielding steady-state plasma concentrations of 242.9 ± 26.0 pM (Fig. 1A) in the same cohort of dogs. It can then be concluded that the dissociation between MCR during EGC and FPE is not due to saturation of the insulin system.
Extrahepatic Tissues
Peripheral insulin infusion studies that utilized the hepatic vein catheterization (13, 38) have supported the dominance (~60%) of the splanchnic bed (liver + mesenteries + spleen) in extracting insulin. Often, the liver is credited with almost all of this extraction (13), yet Ishida et al. (17) demonstrated that extrahepatic splanchnic extraction accounted for about one-third of total splanchnic extraction when insulin is infused peripherally and sampled from the hepatic vein in conscious normal dogs. Thus the liver, while the primary organ of insulin clearance, might not be overly dominant during the hours-long hyperinsulinemic-euglycemic clamp.
In muscle and adipose tissues, there is a substantial delay in the access of insulin into the interstitium from plasma (37) due to the intact endothelial barrier of their capillaries (19), unlike in the liver (4). This was demonstrated in dogs (37), where insulin was measured in leg and hepatic duct lymph (representing the interstitial and hepatic access, respectively) following an injection of insulin. Insulin concentration reached a plateau ~20 min later in the leg lymph than in the hepatic duct lymph. Also, the maximum insulin concentration in the leg lymph was about one-half that of hepatic duct lymph. Besides that, skeletal muscles and peripheral adipose tissues account for only ~13% of insulin clearance (5). Thus, it is plausible that the contribution of muscle and adipose tissue to the FCR, at least in the first 10 min after the insulin injection, during which ~90% of peak plasma insulin was cleared, was inconsequential.
Sustained high plasma insulin stimulates vasodilation and increases functional muscle capillary density and blood flow (10). These factors should make the muscle more amenable to insulin access during the EGC and possibly increase the extraction of insulin. However, Steil et al. (41) reported a similar insulin clearance rate in the dog hindlimb lymph at both basal and hyperinsulinemic conditions. This makes it unlikely that the muscle increased its fractional extraction of insulin during the current EGC experiments.
Fractional extraction of insulin by the kidneys varies from 12 to 50% (8, 13, 36). The kidneys extract more peripherally administered insulin than endogenous insulin (8, 16, 36, 43), partly due to the absence of first-pass hepatic insulin extraction. Renal extraction fraction increased with increasing insulin doses in the hyperinsulinemic clamp in healthy human subjects to a point where extrasplanchnic insulin extraction accounted for more insulin removal than splanchnic extraction (13). While the insulin concentrations in that study (13) were up to ~30 times higher than those of the current study, it indicates that the kidneys have the potential to remove higher amounts of peripherally infused insulin. The wide range (22–77%) of hepatic insulin extraction in normal healthy dogs is noteworthy. Considering this wide range of FPE, perhaps the animals with low FPE have high extrahepatic insulin clearance, which fosters the dissociation between FPE and clearance calculated from the hours-long EGC.
The kidney is estimated to be responsible for ~80% of extrasplanchnic insulin clearance (13) and is likely responsible for changes in extrahepatic insulin clearance during the EGC, if any, considering that muscle and adipose tissue fractional insulin uptakes are not altered during EGC (10, 41). Renal insulin extraction occurs through two pathways: insulin receptor-mediated peritubular reabsorption (35) and a multiligand endocytic receptor, megalin, in the luminal cells of the proximal convoluted tubule (PCT) after glomerular filtration (30). Megalin has a low binding affinity, but ~1,000 times more capacity for insulin than the insulin receptor (30), which makes it unsaturable at concentration even far beyond physiological insulin levels (29). Insulin’s uptake in the PCT of the kidney is upregulated with increasing insulin concentrations (24). Thus, it is possible that the high-capacity megalin and the feed-forward process in the PCT enable the kidneys to extract relatively more insulin during the hours-long hyperinsulinemic clamp. However, the higher-affinity insulin receptor-mediated peritubular reabsorption may dominate in the dynamic FSIGT, in which there is only fleeting hyperinsulinemia.
Limitations of PPII
PPII assumes a complete inhibition of insulin secretion. However, plasma insulin C-peptide data (Fig. 4) during the PPII showed that for most of the dogs (6/9) insulin secretion was not completely suppressed during the somatostatin-only infusion phase, before the start of the insulin infusions. Nevertheless, insulin secretion indicated by C-peptide concentrations during the peripheral and portal infusions were similar, which offsets any bias in the calculation of the FPE.
FPE is calculated on the basis of steady-state concentrations with no recourse to insulin kinetics. It has been suggested that the pulsatility of insulin secretion with the changing portal vein concentrations regulates FPE (25). PPII also assumes that blood flow rates and insulin extraction by the different extrahepatic tissues remain consistent during both portal and peripheral infusion protocols, which was not verified. Insulin has hemodynamic properties and affects the blood flow rate (10). In acknowledging this possibility, the attempt was made to match the systemic concentrations of insulin during the PPII protocols. It is estimated that the liver extracts ~50% of portal insulin (33); thus, two times the peripheral rates was infused intraportally for matching systemic insulin levels. It is important to note that such a study in healthy dogs may not reflect conditions in prediabetic or diabetic states, and much more so in humans.
Several studies (3, 22) have shown that a principal mechanism of the hyperinsulinemic compensation of the insulin resistance is reduced insulin clearance, led by decreased FPE. Thus, there is a need to have a relatively simple but accurate method of estimating hepatic insulin extraction in vivo. Here, we have demonstrated for the first time that FCR from FSIGT but not MCR from EGC, could be used as a surrogate for first-pass hepatic insulin extraction. MCR could reflect insulin clearance from extrahepatic sources, possibly the kidneys.
GRANTS
National Institute of Diabetes and Digestive and Kidney Disease research grants DK-27619 and DK-29867 to R. N. Bergman supported this study. R. N. Bergman is also supported by Astra Zeneca and GI Dynamics.
DISCLOSURES
No conflicts of interest, financial or otherwise, are declared by the authors.
AUTHOR CONTRIBUTIONS
I.A.-B., S.P.K., and R.N.B. conceived and designed research; I.A.-B., R.L.P., O.O.W., and M.B. performed experiments; I.A.-B., S.P.K., and F.P. analyzed data; I.A.-B., S.P.K., C.M.K., and R.N.B. interpreted results of experiments; I.A.-B. prepared figures; I.A.-B. drafted manuscript; I.A.-B., R.L.P., S.P.K., C.M.K., M.K., and R.N.B. edited and revised manuscript; I.A.-B., R.L.P., S.P.K., O.O.W., C.M.K., M.K., F.P., and R.N.B. approved final version of manuscript.
ACKNOWLEDGMENTS
We thank Adrian Glenn, Hernan C. Rios, and Edgardo M. Paredes for help with the surgeries on the animals. Also, we thank Hasmik Mkrtchyan for helping with maintenance of the animals. Special thanks to Rita Thomas for assaying the plasma insulin and c-peptides.
Some parts of this work were presented as abstracts at the 75th Scientific Sessions of the American Diabetes Association, Boston, MA, 2015; The Obesity Society Conference, Los Angeles, CA, 2015; and at the Endocrinology Society meeting, San Diego, CA, 2015.
REFERENCES
- 1.Ader M, Bergman RN. Peripheral effects of insulin dominate suppression of fasting hepatic glucose production. Am J Physiol Endocrinol Metab 258: E1020–E1032, 1990. [DOI] [PubMed] [Google Scholar]
- 2.Ader M, Stefanovski D, Kim SP, Richey JM, Ionut V, Catalano KJ, Hucking K, Ellmerer M, Van Citters G, Hsu IR, Chiu JD, Woolcott OO, Harrison LN, Zheng D, Lottati M, Kolka CM, Mooradian V, Dittmann J, Yae S, Liu H, Castro AV, Kabir M, Bergman RN. Hepatic insulin clearance is the primary determinant of insulin sensitivity in the normal dog. Obesity (Silver Spring) 22: 1238–1245, 2014. doi: 10.1002/oby.20625. [DOI] [PMC free article] [PubMed] [Google Scholar]
- 3.Bonora E, Zavaroni I, Coscelli C, Butturini U. Decreased hepatic insulin extraction in subjects with mild glucose intolerance. Metabolism 32: 438–446, 1983. doi: 10.1016/0026-0495(83)90004-5. [DOI] [PubMed] [Google Scholar]
- 4.Braet F, Wisse E. Structural and functional aspects of liver sinusoidal endothelial cell fenestrae: a review. Comp Hepatol 1: 1, 2002. doi: 10.1186/1476-5926-1-1. [DOI] [PMC free article] [PubMed] [Google Scholar]
- 5.Butterfield WJH, Garret CJ, Whichelow MJ. Peripheral hormone action: studies on the clearance and effect 131I-iodoinsulin on the peripheral tissues of normal, acromegalic and diabetic subjects. Clin Sci (Oxford) 24: 331–340, 1963. [Google Scholar]
- 6.Castillo MJ, Scheen AJ, Letiexhe MR, Lefèbvre PJ. How to measure insulin clearance. Diabetes Metab Rev 10: 119–150, 1994. doi: 10.1002/dmr.5610100205. [DOI] [PubMed] [Google Scholar]
- 7.CDC Chronic Disease Prevention and Health Promotion: Diabetes. https://www.cdc.gov/chronicdisease/resources/publications/aag/diabetes.htm, 2016.
- 8.Chamberlain MJ, Stimmler L. The renal handling of insulin. J Clin Invest 46: 911–919, 1967. doi: 10.1172/JCI105597. [DOI] [PMC free article] [PubMed] [Google Scholar]
- 9.Costa-Júnior JM, Ferreira SM, Protzek AO, Santos GJ, Cappelli AP, Silveira LR, Zoppi C, de Oliveira CA, Boschero AC, Carneiro EM, Rezende LF. Endurance training inhibits insulin clearance and IDE expression in Swiss mice. PLoS One 10: e0118809, 2015. doi: 10.1371/journal.pone.0118809. [DOI] [PMC free article] [PubMed] [Google Scholar]
- 10.Eggleston EM, Jahn LA, Barrett EJ. Hyperinsulinemia rapidly increases human muscle microvascular perfusion but fails to increase muscle insulin clearance: evidence that a saturable process mediates muscle insulin uptake. Diabetes 56: 2958–2963, 2007. doi: 10.2337/db07-0670. [DOI] [PubMed] [Google Scholar]
- 11.Ferrannini E, Cobelli C. The kinetics of insulin in man. I. General aspects. Diabetes Metab Rev 3: 335–363, 1987. doi: 10.1002/dmr.5610030201. [DOI] [PubMed] [Google Scholar]
- 12.Ferrannini E, Cobelli C. The kinetics of insulin in man. II. Role of the liver. Diabetes Metab Rev 3: 365–397, 1987. doi: 10.1002/dmr.5610030202. [DOI] [PubMed] [Google Scholar]
- 13.Ferrannini E, Wahren J, Faber OK, Felig P, Binder C, DeFronzo RA. Splanchnic and renal metabolism of insulin in human subjects: a dose-response study. Am J Physiol Endocrinol Metab 244: E517–E527, 1983. doi: 10.1152/ajpendo.1983.244.6.E517. [DOI] [PubMed] [Google Scholar]
- 14.Finegood DT, Bergman RN, Vranic M. Estimation of endogenous glucose production during hyperinsulinemic-euglycemic glucose clamps. Comparison of unlabeled and labeled exogenous glucose infusates. Diabetes 36: 914–924, 1987. doi: 10.2337/diab.36.8.914. [DOI] [PubMed] [Google Scholar]
- 15.Fugleberg S, Kølendorf K, Thorsteinsson B, Bliddal H, Lund B, Bojsen F. The relationship between plasma concentration and plasma disappearance rate of immunoreactive insulin in normal subjects. Diabetologia 22: 437–440, 1982. doi: 10.1007/BF00282586. [DOI] [PubMed] [Google Scholar]
- 16.Hammerman MR. Interaction of insulin with the renal proximal tubular cell. Am J Physiol Renal Physiol 249: F1–F11, 1985. doi: 10.1152/ajprenal.1985.249.1.F1. [DOI] [PubMed] [Google Scholar]
- 17.Ishida T, Chap Z, Chou J, Lewis RM, Hartley CJ, Entman ML, Field JB. Hepatic extraction of exogenous insulin in depancreatized conscious dogs. Am J Physiol Endocrinol Metab 246: E369–E379, 1984. doi: 10.1152/ajpendo.1984.246.4.E369. [DOI] [PubMed] [Google Scholar]
- 18.Ishida T, Röjdmark S, Bloom G, Chou MC, Field JB. The effect of somatostatin on the hepatic extraction of insulin and glucagon in the anesthetized dog. Endocrinology 106: 220–230, 1980. doi: 10.1210/endo-106-1-220. [DOI] [PubMed] [Google Scholar]
- 19.Jansson PA, Fowelin JP, von Schenck HP, Smith UP, Lönnroth PN. Measurement by microdialysis of the insulin concentration in subcutaneous interstitial fluid. Importance of the endothelial barrier for insulin. Diabetes 42: 1469–1473, 1993. doi: 10.2337/diab.42.10.1469. [DOI] [PubMed] [Google Scholar]
- 20.Jones CN, Pei D, Staris P, Polonsky KS, Chen YD, Reaven GM. Alterations in the glucose-stimulated insulin secretory dose-response curve and in insulin clearance in nondiabetic insulin-resistant individuals. J Clin Endocrinol Metab 82: 1834–1838, 1997. doi: 10.1210/jcem.82.6.3979. [DOI] [PubMed] [Google Scholar]
- 21.Kalantar-Zadeh K, Derose SF, Nicholas S, Benner D, Sharma K, Kovesdy CP. Burnt-out diabetes: impact of chronic kidney disease progression on the natural course of diabetes mellitus. J Ren Nutr 19: 33–37, 2009. doi: 10.1053/j.jrn.2008.11.012. [DOI] [PMC free article] [PubMed] [Google Scholar]
- 22.Kim SP, Ellmerer M, Kirkman EL, Bergman RN. Beta-cell “rest” accompanies reduced first-pass hepatic insulin extraction in the insulin-resistant, fat-fed canine model. Am J Physiol Endocrinol Metab 292: E1581–E1589, 2007. doi: 10.1152/ajpendo.00351.2006. [DOI] [PubMed] [Google Scholar]
- 23.Kim SP, Ellmerer M, Van Citters GW, Bergman RN. Primacy of hepatic insulin resistance in the development of the metabolic syndrome induced by an isocaloric moderate-fat diet in the dog. Diabetes 52: 2453–2460, 2003. doi: 10.2337/diabetes.52.10.2453. [DOI] [PubMed] [Google Scholar]
- 24.Kolman P, Pica A, Carvou N, Boyde A, Cockcroft S, Loesch A, Pizzey A, Simeoni M, Capasso G, Unwin RJ. Insulin uptake across the luminal membrane of the rat proximal tubule in vivo and in vitro. Am J Physiol Renal Physiol 296: F1227–F1237, 2009. doi: 10.1152/ajprenal.90351.2008. [DOI] [PMC free article] [PubMed] [Google Scholar]
- 25.Meier JJ, Veldhuis JD, Butler PC. Pulsatile insulin secretion dictates systemic insulin delivery by regulating hepatic insulin extraction in humans. Diabetes 54: 1649–1656, 2005. doi: 10.2337/diabetes.54.6.1649. [DOI] [PubMed] [Google Scholar]
- 26.Mittelman SD, Van Citters GW, Kim SP, Davis DA, Dea MK, Hamilton-Wessler M, Bergman RN. Longitudinal compensation for fat-induced insulin resistance includes reduced insulin clearance and enhanced beta-cell response. Diabetes 49: 2116–2125, 2000. doi: 10.2337/diabetes.49.12.2116. [DOI] [PubMed] [Google Scholar]
- 27.Morishima T, Bradshaw C, Radziuk J. Measurement using tracers of steady-state turnover and metabolic clearance of insulin in dogs. Am J Physiol Endocrinol Metab 248: E203–E208, 1985. doi: 10.1152/ajpendo.1985.248.2.E203. [DOI] [PubMed] [Google Scholar]
- 28.Najjar SM. Regulation of insulin action by CEACAM1. Trends Endocrinol Metab 13: 240–245, 2002. doi: 10.1016/S1043-2760(02)00608-2. [DOI] [PubMed] [Google Scholar]
- 29.Nielsen S, Nielsen JT, Christensen EI. Luminal and basolateral uptake of insulin in isolated, perfused, proximal tubules. Am J Physiol Renal Physiol 253: F857–F867, 1987. doi: 10.1152/ajprenal.1987.253.5.F857. [DOI] [PubMed] [Google Scholar]
- 30.Orlando RA, Rader K, Authier F, Yamazaki H, Posner BI, Bergeron JJ, Farquhar MG. Megalin is an endocytic receptor for insulin. J Am Soc Nephrol 9: 1759–1766, 1998. [DOI] [PubMed] [Google Scholar]
- 31.Piccinini F, Polidori DC, Gower BA, Bergman RN. Hepatic but not extra-hepatic insulin clearance is lower in african american than in european american women. Diabetes 66: 2564–2570, 2017. doi: 10.2337/db17-0413. [DOI] [PMC free article] [PubMed] [Google Scholar]
- 32.Polidori DC, Bergman RN, Chung ST, Sumner AE. Hepatic and Extrahepatic Insulin Clearance Are Differentially Regulated: Results From a Novel Model-Based Analysis of Intravenous Glucose Tolerance Data. Diabetes 65: 1556–1564, 2016. doi: 10.2337/db15-1373. [DOI] [PMC free article] [PubMed] [Google Scholar]
- 33.Polonsky K, Jaspan J, Pugh W, Cohen D, Schneider M, Schwartz T, Moossa AR, Tager H, Rubenstein AH. Metabolism of C-peptide in the dog. In vivo demonstration of the absence of hepatic extraction. J Clin Invest 72: 1114–1123, 1983. doi: 10.1172/JCI111036. [DOI] [PMC free article] [PubMed] [Google Scholar]
- 34.Polonsky KS, Given BD, Hirsch L, Shapiro ET, Tillil H, Beebe C, Galloway JA, Frank BH, Karrison T, Van Cauter E. Quantitative study of insulin secretion and clearance in normal and obese subjects. J Clin Invest 81: 435–441, 1988. doi: 10.1172/JCI113338. [DOI] [PMC free article] [PubMed] [Google Scholar]
- 35.Rabkin R, Ryan MP, Duckworth WC. The renal metabolism of insulin. Diabetologia 27: 351–357, 1984. doi: 10.1007/BF00304849. [DOI] [PubMed] [Google Scholar]
- 36.Rabkin R, Simon NM, Steiner S, Colwell JA. Effect of renal disease on renal uptake and excretion of insulin in man. N Engl J Med 282: 182–187, 1970. doi: 10.1056/NEJM197001222820402. [DOI] [PubMed] [Google Scholar]
- 37.Rasio EA, Mack E, Egdahl RH, Herrera MG. Passage of insulin and inulin across vascular membranes in the dog. Diabetes 17: 668–672, 1968. doi: 10.2337/diab.17.11.668. [DOI] [PubMed] [Google Scholar]
- 38.Saccà L, Orofino G, Petrone A, Vigorito C. Direct assessment of splanchnic uptake and metabolic effects of human and porcine insulin. J Clin Endocrinol Metab 59: 191–196, 1984. doi: 10.1210/jcem-59-2-191. [DOI] [PubMed] [Google Scholar]
- 39.Sonksen PH, McCormick JR, Egdahl RH, Soeldner JS. Distribution and binding of insulin in the dog hindlimb. Am J Physiol 221: 1672–1680, 1971. doi: 10.1152/ajplegacy.1971.221.6.1672. [DOI] [PubMed] [Google Scholar]
- 40.Sönksen PH, Tompkins CV, Srivastava MC, Nabarro JD. A comparative study on the metabolism of human insulin and porcine proinsulin in man. Clin Sci Mol Med 45: 633–654, 1973. [DOI] [PubMed] [Google Scholar]
- 41.Steil GM, Ader M, Moore DM, Rebrin K, Bergman RN. Transendothelial insulin transport is not saturable in vivo. No evidence for a receptor-mediated process. J Clin Invest 97: 1497–1503, 1996. doi: 10.1172/JCI118572. [DOI] [PMC free article] [PubMed] [Google Scholar]
- 42.Stevenson RW, Cherrington AD, Steiner KE. The relationship between plasma concentration and disappearance rate of immunoreactive insulin in the conscious dog. Horm Metab Res 17: 551–553, 1985. doi: 10.1055/s-2007-1013604. [DOI] [PubMed] [Google Scholar]
- 43.Zaharko DS, Beck LV, Blankenbaker R. Role of the kidney in the disposal of radioiodinated and nonradioiodinated insulin in dogs. Diabetes 15: 680–685, 1966. doi: 10.2337/diab.15.9.680. [DOI] [PubMed] [Google Scholar]