

Abstract
Obesity is associated with adipose tissue inflammation that contributes to insulin resistance. Zinc finger protein 36 (Zfp36) is an mRNA-binding protein that reduces inflammation by binding to cytokine transcripts and promoting their degradation. We hypothesized that myeloid-specific deficiency of Zfp36 would lead to increased adipose tissue inflammation and reduced insulin sensitivity in diet-induced obese mice. As expected, wild-type (Control) mice became obese and diabetic on a high-fat diet, and obese mice with myeloid-specific loss of Zfp36 [knockout (KO)] demonstrated increased adipose tissue and liver cytokine mRNA expression compared with Control mice. Unexpectedly, in glucose tolerance testing and hyperinsulinemic-euglycemic clamp studies, myeloid Zfp36 KO mice demonstrated improved insulin sensitivity compared with Control mice. Obese KO and Control mice had similar macrophage infiltration of the adipose depots and similar peripheral cytokine levels, but lean and obese KO mice demonstrated increased Kupffer cell (KC; the hepatic macrophage)-expressed Mac2 compared with lean Control mice. Insulin resistance in obese Control mice was associated with enhanced Zfp36 expression in KCs. Compared with Control mice, KO mice demonstrated increased hepatic mRNA expression of a multitude of classical (M1) inflammatory cytokines/chemokines, and this M1-inflammatory hepatic milieu was associated with enhanced nuclear localization of IKKβ and the p65 subunit of NF-κB. Our data confirm the important role of innate immune cells in regulating hepatic insulin sensitivity and lipid metabolism, challenge-prevailing models in which M1 inflammatory responses predict insulin resistance, and indicate that myeloid-expressed Zfp36 modulates the response to insulin in mice.
Keywords: diabetes, inflammation, insulin, liver, obesity, Zfp36
INTRODUCTION
Excess weight is a risk factor for numerous conditions, including cardiovascular disease and diabetes (12). The molecular mechanisms by which obesity produces adverse metabolic outcomes remain closely tied to the low-grade inflammatory state associated with obesity (12, 14, 16). Ultimately, obesity leads to increased adipose tissue infiltration with macrophages and increased classical (M1) inflammatory activation of these innate immune cells (21, 42, 66). In addition, obesity leads to elevated intestine-derived endotoxemia, which activates innate immune cells and has been tied with the pathogenesis of insulin resistance (7, 53).
Tnfa promotes insulin resistance, partly via the enhanced release of adipocyte free fatty acids that impair insulin receptor signaling (4, 20, 47). Transgenic expression of monocyte chemoattractant protein-1 (Mcp1) in the adipose tissue of mice increases macrophage infiltration, inflammation, and insulin resistance (5, 24, 57, 65). Conversely, disruption of Mcp1 (or its receptor, C-C chemokine receptor type 2) in mice impairs migration of macrophages into adipose tissue, lowers inflammation, and improves insulin sensitivity (35, 42, 65). Likewise, generalized ablation of macrophages normalizes insulin sensitivity in obese mice (44). In summary, interventions aimed at either reducing macrophage numbers or decreasing their M1 inflammatory characteristics generally improve insulin sensitivity in mice (12, 46, 64).
The expression of many cytokine proteins is regulated post-transcriptionally at the level of mRNA stability. Much of this regulation is mediated by proteins that bind to adenylate-uridylate-rich elements (core sequence 5′-AUUUA), located in the untranslated regions of target transcripts (13). Zinc finger protein 36 (Zfp36) is an adenylate-uridylate-rich element-binding protein that destabilizes target mRNAs, leading to diminished protein expression (3). Zfp36 has been shown to repress the expression of dozens of cytokines/growth factors, including Tnfa, IL-6, IL-17, Mcp1, and cyclooxygenase-2 [prostaglandin-endoperoxide synthase 2 (Ptgs2)] (3, 51). Zfp36 null mice demonstrate cachexia, arthritis, and autoimmunity, which are partly reversed when systemic Tnfa is neutralized (9, 59). Zfp36 also physically interacts with the p65 subunit of NF-κB, leading to decreased nuclear import and diminished transcription of inflammatory genes (31, 50).
We hypothesized that myeloid-specific deletion of Zfp36 would enhance the chronic inflammatory response of obesity and thereby reduce insulin sensitivity. To test this hypothesis, we used a floxed Zfp36 mouse line, crossed with mice expressing Cre recombinase under the control of the lysozyme M promoter, as previously described (45). Unlike global Zfp36 null mice (59), myeloid-specific null mice are neither sick nor inflamed. When challenged with low-dose bacterial endotoxin (i.e., LPS), however, these mice demonstrate enhanced inflammatory responses and widespread organ damage (45).
We observed that Zfp36 floxed mice lacking the Cre transgene (henceforth, “Control” mice) became obese and developed insulin resistance on a high-fat (HF) diet. Surprisingly, mice with myeloid-specific deletion of Zfp36 [henceforth, “knockout” (KO) mice] became similarly obese but did not develop insulin resistance. Obese Zfp36 KO mice had markedly improved lipid profiles and reduced hepatic steatosis and hepatic inflammation compared with Control mice. Herein, we describe the metabolic and immune phenotypes of the Zfp36 KO mice and focus on their protection from insulin resistance in obesity.
MATERIALS AND METHODS
Quantitative RT-PCR.
Total RNA was purified from cell lysates using Trizol reagent (Thermo Fisher Scientific, Waltham, MA) and reverse transcribed using RT-murine leukemia virus (Thermo Fisher Scientific), followed by quantitative RT-PCR using TaqMan primers (Thermo Fisher Scientific) and Fast Advanced Master Mix (Thermo Fisher Scientific) in an Applied Biosystems thermal cycler. Quantitative RT-PCR values for target genes were normalized to reference gene expression (RPL17, ABT1, or RN18S) by calculating comparative threshold cycle values. Reference genes were selected for stable expression across all tissue/cell specimens.
Western blotting.
Cell or tissue lysates in Thermo Fisher Scientific Halt protease and phosphatase inhibitors were quantified using the Micro Bicinchoninic Acid Protein Assay Kit (Thermo Fisher Scientific) and separated by SDS-PAGE; transferred to polyvinylidene difluoride membranes; and probed with antibodies against β-actin (CP01; MilliporeSigma, St. Louis, MO), ZFP36 [rabbit anti-ZFP36 (70)], AKT (#4691; Cell Signaling Technology, Danvers, MA), phosphorylated (p)AKT-Ser473 (#4058; Cell Signaling Technology), cyclophilin B (Ab74173; Abcam, Cambridge, MA), Mac2 (14-5301; Affymetrix, Santa Clara, CA), p65 [#8242 (immunohistochemistry) and #4764 (Western); Cell Signaling Technology], IKKβ (#8943; Cell Signaling Technology), X-box-binding protein 1 (Xbp1; #sc-7160; Santa Cruz Biotechnology, Dallas, TX), histone H3 (#4499; Cell Signaling Technology), and GAPDH (#2118; Cell Signaling Technology). Secondary goat anti-rabbit or anti-mouse IgG antibodies, conjugated with horseradish peroxidase, were used and developed using Amersham ECL Plus Western Blotting Detection Reagents (GE Healthcare, Chicago, IL) or developed using fluorescent secondary antibody (#611-132-122; Rockland, Limerick, PA) in Odyssey blocking buffer in a LI-COR apparatus (LI-COR, Lincoln, NE).
ELISAs.
ELISA for mouse adiponectin was performed in duplicate using the EZMADP-60K ELISA (MilliporeSigma), per the manufacturer’s instructions, and was read in a Synergy Mx plate reader (BioTek, Winooski, VT).
Mouse studies.
Animal studies were submitted to and approved by the Thomas Jefferson University–Institutional Animal Care and Use Committee, in accordance with the guidelines set forth by the U.S. National Institutes of Health, and studies were performed under a license obtained by the Thomas Jefferson University–Institutional Animal Care and Use Committee. We studied C57BL/6J mice, as this is the most commonly used background genetic strain when studying alterations in metabolism after diet-induced obesity (DIO), and we studied male mice, as males are more prone to diabetes than females (36). At weaning, DIO mice were fed an HF Western diet (diet 88137; Envigo, Somerset, NJ) with 42% calories from fat, whereas lean mice were fed a matching “standard” chow comprised of 13% calories from fat.
Myeloid-specific Zfp36 KO mice were achieved by crossing loxP-flanked Zfp36 C57BL/6 mice (Zfp36fl/fl) with mice expressing Cre recombinase under the control of the murine M lysozyme promoter (The Jackson Laboratory, Bar Harbor, ME), as previously described (45). In that work, conditional ablation of Zfp36 expression in macrophages, but not alternative primary mouse cell types, was established.
Assessment of body composition.
Whole-body fat and lean mass were noninvasively measured using proton magnetic resonance spectroscopy (Echo Medical Systems, Houston, TX).
Assessment of macrophage numbers in mouse adipose depots.
Parrafin-embedded epididymal white adipose tissue (WAT) sections were stained with hematoxylin and eosin or anti-Mac2 antibody (#14-5301; Affymetrix). Three to eight representative tissue sections from the gonadal fat of four mice per study group were used to detect macrophages and crown-like structures. All samples were counterstained with the nuclear counter stain, 4′-6-diamidino-2-phenylindole (Thermo Fisher Scientific). Mac2-positive cells and crown-like structures were scored by two independent judges blinded to the origin of the specimens, and data are presented as percent Mac2-positive cells per total number of cell nuclei.
Isolation of bone marrow-derived macrophages.
Bone marrow-derived macrophages (BMDMs) were prepared by flushing mouse leg bones with PBS with 2% FBS (Atlanta Biologicals, Flowery Branch, GA), 100 U/ml penicillin, and 100 mg/ml streptomycin (Thermo Fisher Scientific). After being filtered through a 70-μm nylon mesh, marrow cells were plated in 10 cm petri dishes at a density of 4 × 10⁶ cells/plate and cultured in differentiation media (DMEM supplemented with 30% L929 supernatant, 15% FBS, 100 U/ml penicillin, 100 mg/ml streptomycin, 2 mM L-glutamine, 0.1 mM nonessential amino acids, 1 mM sodium pyruvate, and 0.5 mM 2-mercaptoethanol; Thermo Fisher Scientific) for 7 days.
Complete blood counts.
Complete blood counts were performed using a Hemavet 950 FS machine (Drew Scientific, Miami Lakes, FL) on whole blood collected in Na-EDTA tubes (Kent Scientific, Torrington, CT).
Glucose tolerance test and insulin signaling through AKT.
After a 6-h fast, glucose (1.5 g/kg; MilliporeSigma) was administrated by intraperitoneal injection, and blood samples were withdrawn from the tail vein at the indicated times. Glycemia was determined using Truetest (Nipro, Bridgewater, NJ) glucose test strips and a True2go glucometer (Trividia, Fort Lauderdale, FL). pAKT was measured by comparing tissues from 15 min vehicle- or insulin-treated (10 U/kg ip injection) mice.
Hyperinsulinemic-euglycemic clamp.
An indwelling jugular vein catheter was placed 5–6 days before clamp experiments, which were performed at the National Mouse Metabolic Phenotyping Center at the University of Massachusetts. On the day of the clamp experiment, mice were fasted overnight (15 h), and a 2-h hyperinsulinemic-euglycemic clamp was conducted in awake mice with a primed and continuous infusion of human insulin (Humulin; Eli Lilly, Indianapolis, IN; 150 mU/kg body weight priming, followed by 2.5 mU⋅kg−1⋅min−1). To maintain euglycemia, 20% glucose was infused at variable rates during clamps. Whole-body glucose turnover was assessed with a continuous infusion of [3-3H]glucose and 2-deoxy-D-[1-14C]glucose (2-[14C]DG; both PerkinElmer, Waltham, MA), administered as a bolus (10 mCi) at 75 min after the start of clamps to measure insulin-stimulated glucose uptake in individual organs. At the end of the clamps, mice were anesthetized with pentobarbital, and tissues were taken for biochemical analysis (26).
Biochemical analysis and calculations from clamp studies.
Glucose concentrations during clamps were analyzed by the glucose oxidase method using 10 μl plasma in a GM9 analyzer (Analox Instruments, Atlanta, GA). Plasma concentrations of [3-3H]glucose, 2-[14C]DG, and 3H2O were determined following deproteinization of plasma samples, as previously described (26). For the determination of tissue 2-[14C]DG-6-phosphate content, tissue samples were homogenized, and supernatants were subjected to an ion-exchange column to separate 2-[14C]DG-6-phosphate from 2-[14C]DG. Plasma insulin levels were measured by ELISA (Alpco Diagnostics, Salem, NH).
Rates of basal hepatic glucose production (HGP) and insulin-stimulated, whole-body glucose turnover were determined, as previously described (26). The insulin-stimulated rate of HGP was determined by subtracting the glucose infusion rate from whole-body glucose turnover. Whole-body glycolysis and glycogen plus lipid synthesis from glucose were calculated as previously described (26). Insulin-stimulated glucose uptake in individual tissues was assessed by determining the tissue content of 2-[14C]DG-6-phosphate and plasma 2-[14C]DG.
Mouse serologic studies.
Lipid profiles and liver-function tests were performed using solid-state chemistry in the Vitros DT 60 system (Thermo Fisher Scientific) at the University of Massachusetts National Mouse Metabolic Phenotyping Center. Assays for nonesterified fatty acids (NEFAs) were performed using an enzymatic assay from Wako Diagnostics (Mountain View, CA).
Measurement of tissue triglyceride levels.
Liver or skeletal muscle samples were digested in chloroform-methanol, as previously described (55). The lipid layer was then separated using H2SO4, and concentrations were determined by spectrophotometry using a triglyceride (TG) assay kit (MilliporeSigma).
Luminex cytokine assays.
Mouse serum was assayed in triplicate using the Bio-Plex Pro Mouse Cytokine 23-plex Assay (#M60009RDPD; BioRad, Hercules, CA) in a Bioplex MagPix (BioRad) machine, according to the manufacturer’s instructions. The Luminex assay has a lower limit of cytokine detection, ranging from ~1 to 30 pg/ml, with an intra-assay coefficient of variation of <5% and interassay coefficient of variation of <13%, depending on the analyte.
Statistical analyses.
Our prespecified primary end-points of interest centered on the DIO mouse groups (Control and KO). Unpaired, two-tailed Student’s t-testing was performed between obese mouse groups. Similar testing was used when comparing lean mouse groups to describe the phenotypes of the Zfp36 myeloid null mice. Statistical comparisons between lean and obese groups were not performed. Areas under the curve (AUCs) were calculated for all glucose tolerance tests, and lean or obese groups were compared by unpaired, two-tailed Student’s t-tests. Statistical significance was P < 0.05.
RESULTS
Characterization of myeloid-specific Zfp36 null mice.
Zfp36 is minimally expressed in the basal state but is strongly induced in macrophages after treatment with LPS. Our studies compared Zfp36fl/fl Control mice with Zfp36fl/fl;LysMCre myeloid conditional KO mice. With the use of primary BMDMs, we confirmed efficient deletion of Zfp36 expression in this cell lineage and LPS-induced expression only in the Control mice (Fig. 1A). To examine the effects of DIO on glucose metabolism, separate cohorts of mice were weaned to a regular or HF diet for 16 weeks. Growth curves of lean KO mice were not different from lean Control mice in our studies, although the KO mice trended to be slightly smaller at birth (Fig. 1B). Both Control and KO mice became similarly obese at the time of metabolic studies (Fig. 1, B and D). Analysis of Control and KO mice after 4 mo of the HF diet demonstrated equivalent body weight, fat mass, lean mass, and adiponectin levels (Fig. 1, C–F).
Fig. 1.

Primary macrophage-expressed zinc finger protein 36 (Zfp36), growth curves, serum adiponectin concentrations, body composition, and glucose tolerance testing in lean and obese loxP-flanked Zfp36 C57BL/6 (Zfp36fl/fl; Control) and Zfp36fl/fl;LysMCre [myeloid knockout (KO)] mice. A: Zfp36 protein expression in bone marrow-derived macrophages from Zfp36 fl/fl;LysMCre (myeloid KO) and Zfp36fl/fl (Control) mice, with and without endotoxin/LPS treatment (1 μg·ml−1·3 h−1). The loading control is actin. This blot is representative of an experiment performed 3 times. B: growth curves of Control and KO mice on regular mouse chow (Reg) and high-fat (HF) diets (n = 6–9 mice/group, mean values with SE). C: serum adiponectin levels in the obese Control (Ctrl) and KO mice after a 4-mo HF diet were similar (n = 8 mice/group). D–F: body composition of Control and KO mice after a 4-mo HF diet indicates equivalent body weight, fat mass, and lean mass in each group (n = 9–10 mice/group), respectively. ns, nonsignificant difference comparing genotypes on the HF diet. G: glucose tolerance testing of Control and KO mice after 4 mo on the regular or HF diets indicates improved glucose tolerance in the obese KO mice [n = 8–11 mice/group, mean values with SE; *P < 0.05 comparing areas under the curve (AUCs) of obese mice; **P < 0.05 comparing AUCs of lean mice].
Myeloid-specific loss of Zfp36 protects against glucose intolerance.
Zfp36 reduces expression of M1 macrophage factors implicated in the pathogenesis of insulin resistance, including Tnfa, IL-1b, and Mcp1 (3, 12). As expected, lean Control and lean Zfp36 KO mice demonstrated normal glucose tolerance, although modestly lower glucose levels were observed in the KO mice (Fig. 1G). Following 16 weeks of an HF diet, obese Control mice developed glucose intolerance, whereas obese KO mice did not (Fig. 1G). Analysis of complete blood counts in our mice revealed no dramatic differences in peripheral hematological parameters; all mice had cell counts and cell parameters within the normal mouse ranges (Table 1). When comparing obese Control and KO mice, there were modest differences in neutrophil counts, percent neutrophils, percent lymphocytes, and red blood cell indices mean corpuscular volume, mean corpuscular hemoglobin (MCH), MCH concentration, and mean platelet volume (Table 1). How macrophage-expressed Zfp36 contributes to these hematological changes remains unknown, and the significance of these modest changes with regard to glucose metabolism, if any, remains unknown.
Table 1.
Complete blood counts in loxP-flanked zinc finger protein 36 (Zfp36) C57BL/6 (Zfp36fl/fl; Control) and Zfp36fl/fl;LysMCre [myeloid knockout (KO)] lean and obese mice
| Control Lean | KO Lean | Control Obese | KO Obese | |
|---|---|---|---|---|
| WBC, K/μl | 9.11 ± 0.59 | 10.11 ± 0.69 | 7.12 ± 0.79 | 8.52 ± 0.84 |
| NE, K/μl | 0.77 ± 0.29 | 2.73 ± 0.5 | 1.48 ± 0.34 | 2.71 ± 0.25 |
| LY, K/μl | 7.83 ± 0.44 | 6.67 ± 0.2 | 5.29 ± 0.57 | 5.17 ± 0.64 |
| MO, K/μl | 0.43 ± 0.06 | 0.57 ± 0.05 | 0.31 ± 0.06 | 0.52 ± 0.09 |
| EO, K/μl | 0.06 ± 0.04 | 0.1 ± 0.04 | 0.04 ± 0.01 | 0.1 ± 0.05 |
| BA, K/μl | 0.02 ± 0.01 | 0.03 ± 0.02 | 0.01 ± 0 | 0.01 ± 0.01 |
| NE, % | 7.85 ± 2.65 | 25.95 ± 3.38 | 20.17 ± 3.76 | 32.64 ± 3.06 |
| LY, % | 86.63 ± 3.35 | 66.89 ± 2.72 | 74.68 ± 3.23 | 60.2 ± 2.76 |
| MO, % | 4.65 ± 0.6 | 5.98 ± 0.99 | 4.49 ± 1.17 | 5.94 ± 0.56 |
| EO, % | 0.65 ± 0.32 | 0.92 ± 0.32 | 0.53 ± 0.17 | 1.09 ± 0.36 |
| BA, % | 0.23 ± 0.14 | 0.27 ± 0.14 | 0.12 ± 0.04 | 0.13 ± 0.09 |
| RBC, M/μl | 10.01 ± 0.68 | 10.51 ± 0.7 | 9.33 ± 0.64 | 9.78 ± 0.48 |
| Hg, g/dl | 14.07 ± 0.34 | 11.8 ± 0.86 | 10.4 ± 0.83 | 12.17 ± 0.5 |
| HCT, % | 39.87 ± 2.63 | 42.1 ± 2.73 | 41.56 ± 2.83 | 39.5 ± 1.42 |
| MCV, fl | 39.84 ± 0.18 | 40.1 ± 0.52 | 44.62 ± 0.95 | 40.57 ± 1.05 |
| MCH, pg | 14.39 ± 0.93 | 11.2 ± 0.29 | 11.1 ± 0.32 | 12.54 ± 0.47 |
| MCHC, g/dl | 36.14 ± 2.26 | 27.97 ± 0.39 | 24.96 ± 1.04 | 31 ± 1.53 |
| RDW, % | 18.34 ± 0.63 | 17.9 ± 0.17 | 17.8 ± 0.23 | 19.13 ± 0.67 |
| PLT, K/μl | 1,097.71 ± 93.75 | 851.33 ± 64.55 | 1,357.6 ± 314.5 | 894.57 ± 144.8 |
| MPV, fl | 4.97 ± 0.08 | 4.93 ± 0.12 | 4.92 ± 0.42 | 6.07 ± 0.21 |
Values are means ± SE; n = 5–7 mice/group, mean values with SE; bold values indicate P < 0.05 compared with respective lean or obese Controls. WBC, white blood cells; NE, neutrophils; LY, lymphocytes; MO, monocytes; EO, eosinophils; BA, basophils; RBC, red blood cells; Hg, hemoglobin; HCT, hematocrit; MCV, mean corpuscular volume; MCH, mean corpuscular hemoglobin; MCHC, MCH concentration; RDW, red cell distribution width; PLT, platelets; MPV, mean platelet volume.
Myeloid-specific loss of Zfp36 does not alter adipose depot macrophage numbers.
As obesity is associated with increased macrophage accumulation in adipose depots that contribute to the pathogenesis of diabetes, we compared adipose tissue macrophage (ATM) content in our Control and KO mice (56, 66). Whereas we confirmed that obese mice have higher adipose tissue concentrations of macrophages than lean mice, we detected no significant difference in macrophage counts when comparing obese Control and KO mice (Fig. 2A). Likewise, when we compared Mac2 mRNA expression between groups, there was enhanced expression in gonadal fat from obese mice but no significant difference between obese Control and obese KO mice, although Mac2 mRNA expression in the KO mice trended lower (Fig. 2B). These data indicate that the improved glucose tolerance observed in obese KO mice is unlikely to be attributable to alterations in peripheral monocyte counts or to broad alterations in ATM counts.
Fig. 2.

Adipose tissue macrophage counts and Mac2 mRNA expression in lean and obese loxP-flanked zinc finger protein 36 (Zfp36) C57BL/6 [Zfp36fl/fl; Control (Ctrl)] and Zfp36fl/fl;LysMCre [myeloid knockout (KO)] mice. A: Mac2-positive cells were assessed in representative tissue sections from 4 mice per study group, as described in MATERIALS AND METHODS. Macrophage cell counts were normalized to total nuclei per histologic section. B: quantitative RT-PCR of Mac2 mRNA expression in gonadal fat from lean and obese Control and KO mice (n = 6–8 mice/group; both figures: mean values with SE). ns, nonsignificant difference.
Myeloid-specific loss of Zfp36 improves insulin sensitivity.
Obese Zfp36 KO mice displayed ~25% lower basal glucose levels than obese Control mice, although both had higher fasting glucose levels than their respective lean genotypes (Figs. 1G and 3A). During a 2-h hyperinsulinemic-euglycemic clamp, plasma glucose levels were maintained at ~120 mg/dl in both groups of mice (Fig. 3B). Despite similar obesity after an HF diet, KO mice were more insulin sensitive, as indicated by a 55% increase in the glucose infusion rate compared with Control mice (Fig. 3C).
Fig. 3.

Insulin action assessed in vivo during 2 h hyperinsulinemic-euglycemic clamp studies in awake loxP-flanked zinc finger protein 36 (Zfp36) C57BL/6 [Zfp36fl/fl; Control (Ctrl)] and Zfp36fl/fl;LysMCre [myeloid knockout (KO)] mice after 4 mo of a high-fat diet. A: basal glucose levels. B: steady-state clamp glucose. C: steady-state glucose infusion rates (GIR) during clamps. D and E: hepatic glucose production (HGP) in the basal state (BHGP) and during the insulin-stimulated state [clamp HGP (CHGP)]. F: hepatic insulin action expressed as insulin-mediated percent suppression of basal HGP. G–I: insulin-stimulated whole-body glucose turnover, glycolysis, and glycogen synthesis during the 2-h hyperinsulinemic-euglycemic clamp, respectively. J–L: insulin-stimulated glucose uptake tended to be higher in white adipose tissue (WAT; epididymal; J), skeletal muscle (gastrocnemius; K), but not brown adipose tissue (BAT; interscapular; L) in the obese Zfp36 KO mice compared with Control mice but did not reach statistical significance (n = 9–10 mice/group, mean values with SE; *P < 0.05). ns, nonsignificant difference.
Basal HGP did not differ between Control and KO mice (Fig. 3D), but clamp HGP was significantly reduced by ~55% in KO mice (Fig. 3E). Likewise, hepatic insulin action was significantly increased in obese KO mice when compared with Control mice (Fig. 3F). Insulin-stimulated whole-body glucose turnover was significantly increased by ~20% in KO mice, and whole-body glycolysis and glycogen synthesis tended, without reaching significance, to be higher in KO mice compared with Controls (Fig. 3, G–I). Insulin-stimulated glucose uptake tended to be higher in WAT and skeletal muscle tissue but not brown adipose tissue of KO mice compared with Control mice (Fig. 3, J–L). Taken together, these data demonstrate that obese KO mice are more insulin sensitive than obese Control mice.
Myeloid-specific loss of Zfp36 does not markedly affect peripheral cytokine concentrations.
We confirmed that obese Control mice have higher serum levels of cytokines, such as Tnfa, Mcp1, and IL-6, than lean Control mice (Table 2) (12). With the focus on the obese mice, we observed that M1 cytokines, including IL-1a, IL-1b, IL-6, Mcp1, Tnfa, and IFN-γ, tended to be similar or slightly lower in the KO mice than in the Control mice, although only Mcp1 reached statistical significance. These trends were unexpected, given the important role of Zfp36 in suppressing cytokine expression in myeloid cells (3). We observed increased peripheral levels of granulocyte-colony-stimulating factor (G-CSF) in the obese KO mice compared with obese Control mice (Table 2), which may contribute to their enhanced neutrophil counts (Table 1). Many peripheral cytokine concentrations were low in all groups, both lean and obese, and were only modestly influenced by genotype. Whether the trend toward reduced peripheral concentrations of IL-1b, IL-6, Mcp1, and Tnfa or the enhanced levels of G-CSF in our obese KO mice contributes to their improved insulin sensitivity remains to be established.
Table 2.
Serum cytokines, chemokines, and growth factors in loxP-flanked zinc finger protein 36 (Zfp36) C57BL/6 (Zfp36fl/fl; Control) and Zfp36fl/fl;LysMCre [myeloid knockout (KO)] lean and obese mice
| Analyte | Control Lean | KO Lean | Control Obese | KO Obese |
|---|---|---|---|---|
| IL-1a, pg/ml | 10.8 ± 2.1 | 10.7 ± 1.6 | 12.8 ± 2.1 | 9.5 ± 3.7 |
| IL-1b, pg/ml | 112.2 ± 29.4 | 138.1 ± 29.0 | 174.5 ± 27.7 | 134.4 ± 76.9 |
| IL-2, pg/ml | 17.7 ± 5.7 | 21.4 ± 8.4 | 16.2 ± 9.5 | 13.7 ± 9.1 |
| IL-3, pg/ml | 7.7 ± 3.9 | 8.7 ± 4.5 | 8.6 ± 5.3 | 6.0 ± 3.5 |
| IL-4, pg/ml | ND | ND | ND | ND |
| IL-5, pg/ml | 10.2 ± 3.6 | 10.8 ± 2.6 | 14.2 ± 3.3 | 10.4 ± 3.9 |
| IL-6, pg/ml | 12.5 ± 1.0 | 13.3 ± 4.2 | 15.6 ± 4.1 | 11.7 ± 2.4 |
| IL-9, pg/ml | ND | ND | ND | ND |
| IL-10, pg/ml | 49.2 ± 19.8 | 55.9 ± 11.4 | 62.3 ± 15.1 | 66.6 ± 27.6 |
| IL-12 (p40), pg/ml | 108.8 ± 14.3 | 161.7 ± 51.9 | 125.5 ± 27.3 | 186.5 ± 75.8 |
| IL-12(p70), pg/ml | 186.4 ± 25.5 | 175.5 ± 24.4 | 221.6 ± 123.2 | 160.2 ± 23.4 |
| IL-13, pg/ml | 166.0 ± 13.7 | 167.9 ± 64.7 | 184.9 ± 46.0 | 140.8 ± 70.8 |
| IL-17, pg/ml | 67.2 ± 9.5 | 54.8 ± 20.7 | 76.8 ± 20.7 | 75.5 ± 9.3 |
| Eotaxin, pg/ml | ND | ND | ND | ND |
| G-CSF, pg/ml | 29.8 ± 6.5 | 29.2 ± 7.9 | 47.1 ± 13.2 | 72.0 ± 17.6 |
| GM-CSF, pg/ml | ND | ND | ND | ND |
| IFN-g, pg/ml | 18.0 ± 4.0 | 17.7 ± 5.6 | 17.5 ± 5.6 | 17.9 ± 8.3 |
| KC, pg/ml | 18.9 ± 4.2 | 28.9 ± 12.5 | 25.7 ± 10.0 | 28.2 ± 13.9 |
| MCP1, pg/ml | 103.8 ± 33.3 | 165.3 ± 55.7 | 178.9 ± 49.6 | 140.9 ± 14.0 |
| MIP-1a, pg/ml | 7.6 ± 2.1 | 13.3 ± 6.0 | 15.1 ± 4.4 | 14.7 ± 1.1 |
| MIP-1b, pg/ml | 19.5 ± 2.0 | 24.3 ± 8.1 | 26.0 ± 9.0 | 39.8 ± 25.3 |
| RANTES, pg/ml | 10.1 ± 4.3 | 16.8 ± 7.8 | 5.5 ± 2.3 | 4.0 ± 2.4 |
| TNF-α, pg/ml | 210.5 ± 19.2 | 215.7 ± 63.7 | 267.5 ± 77.9 | 193.4 ± 43.9 |
Values are means ± SE; n = 5–7 mice/group, mean values with SE; bold values indicate P < 0.05 compared with respective lean or obese Controls. ND, not determined; G-CSF, granulocyte-colony-stimulating factor; GM-CSF, granulocyte macrophage-CSF; KC, Kupffer cell; MCP1, monocyte chemoattractant protein-1; MIP-1a/b, macrophage inflammatory protein-1α/β; RANTES, regulated on activation, normal T cell expressed and secreted.
Myeloid-specific loss of Zfp36 protects from hepatic steatosis and modulates hepatic lipid metabolism.
Elevated systemic concentrations of NEFAs may contribute to ectopic tissue accumulation of lipids implicated in the “lipotoxicity” model of insulin resistance (8). We measured liver and skeletal muscle TG concentrations in obese Control and KO mice. We observed no significant differences in TG concentrations in skeletal muscle but >50% reduction in TG concentrations in the livers of the KO mice compared with Control mice (Fig. 4, A and B). Protection from steatosis in the obese KO mice was associated with protection from liver damage, as evidenced by their reduced serum levels of alanine transaminase (ALT) compared with Control mice (Fig. 4C). In contrast, our measurements in the lean mice revealed that the KO mice had elevated ALT compared with lean Control mice (Fig. 4C), indicating a role for myeloid ZFP36 in regulating hepatic inflammation, independent of its role in regulating insulin sensitivity. Aspartate transaminase levels tended to be higher in the lean KO mice compared with lean Control mice, with no significant differences between genotypes in the obese mice (Fig. 4D).
Fig. 4.

Tissue triglycerides (TG), serologic studies, and hepatic Mac2 mRNA expression in loxP-flanked zinc finger protein 36 (Zfp36) C57BL/6 [Zfp36fl/fl; Control (Ctrl)] and Zfp36fl/fl;LysMCre [myeloid knockout (KO)] lean and obese mice. A: skeletal muscle TGs (n = 9–10/group), B: liver TG (n = 9–10/group), C–I: alanine transaminase (ALT), aspartate transaminase (AST), serum cholesterol, serum HDL, serum LDL, serum TG, and serum nonesterified fatty acids (NEFA; n = 9 mice/group, mean values with SE), respectively. J: liver mRNA expression of Mac2 in lean and obese Control and myeloid-Zfp36 KO mice (n = 11–15 mice/group; *P < 0.05). ns, nonsignificant difference.
Compared with obese Control mice, the obese KO mice had lower total cholesterol, LDL, HDL, and fatty acids (NEFAs; Fig. 4, E–I). Serum TG levels tended to be lower in the obese KO mice, but this did not reach statistical significance (Fig. 4H). In lean mice, LDL was higher, whereas TG and NEFA were lower in the KO mice than in Controls (Fig. 4I). These data indicate that the improved insulin sensitivity in the obese KO mice was associated with improved lipid profiles compared with obese Control mice.
With the use of Mac2 mRNA expression as an index of hepatic myeloid cell activation, we observed enhanced Mac2 mRNA and protein expression in lean KO and in obese mice of both genotypes, without significant differences between obese genotypes (Fig. 4J, and see Fig. 8D). These data confirm hepatic activation of myelocytes in the KO mice, both lean and obese, and in obese Control mice but cannot directly explain the differences in insulin sensitivity between groups. In aggregate, these data implicate myeloid-expressed Zfp36 in the regulation of hepatic lipid accumulation, lipid metabolism, and liver damage.
Fig. 8.

Insulin-stimulated phosphorylation of Akt (pAkt) in liver and skeletal muscle of loxP-flanked zinc finger protein 36 (Zfp36) C57BL/6 [Zfp36fl/fl; Control (Ctrl)] and Zfp36fl/fl;LysMCre [myeloid knockout (KO)] mice on the high-fat diet. A: obese mice were treated with vehicle control or insulin (10 U/kg), and livers were processed for Western blots of total Akt or pAkt-Ser473. Cyclophilin B (CycB) serves as loading control. B: insulin sensitivity, as assessed by glucose-6-phosphatase (G6pc) mRNA expression in mouse livers (n = 17–22 mice/group, mean values with SE; *P < 0.05). C: total and pAkt measured in skeletal muscle from vehicle or insulin-treated mice, with GAPDH as a loading control. Western blots of liver lysates from Control and myeloid KO mice, both lean and obese. D: Mac2 expression with Cyclophilin B as loading control. E: Zfp36 expression with Cyclophilin B as loading control. mwm, molecular weight marker; ns, nonsignificant difference.
Myeloid-specific loss of Zfp36 alters hepatic metabolic gene expression.
To understand better the hepatic metabolic response to myeloid loss of Zfp36 expression, we measured mRNA expression of genes important in hepatic glucose and lipid metabolism. Scavenger receptor expression was higher in obese Control mice than in KO mice, consistent with their increased steatosis, hepatic inflammation, and insulin resistance (Fig. 5, A–C). Obesity was similarly associated with mRNA expression changes for some lipid transporters, with normalization to lean expression levels in the KO mice for ATP-binding cassette subfamily A member 1 (Abca1) and fatty acid-binding protein (Fabp)1 (Fig. 5, D–H). Obesity was associated with markedly enhanced mRNA expression of factors that mediate de novo lipogenesis, with a return to lean expression levels in the obese KO mice for the master regulatory factor Srebf1 (Sterol regulatory element binding transcription factor 1) (Fig. 5, I–L). These data suggest that obese Control mice have the highest rates of de novo lipogenesis compared with lean mice or obese KO mice, consistent with their increased insulin resistance and steatosis. We also observed reduced expression of lipolytic [macrophage galactose-type lectin 1 (Mgll)] and β-oxidative (carnitine palmitoyltransferase 1) transcripts in the obese KO mice compared with obese Control mice, consistent with their enhanced insulin sensitivity (Fig. 6).
Fig. 5.

Liver scavenger receptors, lipid transport, and lipogenic mRNA expression in loxP-flanked zinc finger protein 36 (Zfp36) C57BL/6 [Zfp36fl/fl; Control (Ctrl)] and Zfp36fl/fl;LysMCre [myeloid knockout (KO)] lean and obese mice. A–C: scavenger receptors: cluster of differentiation 36 (Cd36), macrophage scavenger receptor 1 (Msr1), and scavenger receptor class B member 1 (Scarb1), respectively. D–H: lipid transport transcripts: ATP-binding cassette subfamily A member 1 (Abca1), fatty acid-binding protein 1 (Fabp1), ATP-binding cassette subfamily G member 1 (Abcg1), hepatic type lipase C (Lipc), and microsomal triglyceride transfer protein (Mttp; n = 6–12 mice/group, mean values with SE; *P < 0.05). I–L: factors involved in de novo lipogenesis; sterol regulatory element binding transcription factor 1 (Srepf1), fatty acid synthase (Fasn), Acetyl-CoA carboxylase (Acc), stearoyl-Coenzyme A desaturase 1 (Scd1). ns, nonsignificant difference.
Fig. 6.

Liver mRNA expression of lipid metabolism genes in loxP-flanked zinc finger protein 36 (Zfp36) C57BL/6 [Zfp36fl/fl; Control (Ctrl)] and Zfp36fl/fl;LysMCre [myeloid knockout (KO)] lean and obese mice. A–C: enzymes involved in lipid metabolism: monoacylglycerol lipase [macrophage galactose-type lectin 1 (Mgll)], 3-hydroxy-3-methyl-glutaryl-CoA reductase (Hmgcr), and carnitine palmitoyltransferase 1 (Cpt1; n = 6–12 mice/group, mean values with SE; *P < 0.05). ns, nonsignificant difference.
Myeloid-specific loss of Zfp36 alters hepatic cytokine gene expression.
We next examined hepatic mRNA expression of classical M1 and alternatively activated M2 aligned cytokines for association with our measured insulin responsiveness. Hepatic mRNA expression of Tnfa, IL-1b, and Mcp1 was enhanced in lean and obese KO mice compared with their respective Control mice (Fig. 7, A–C). These data are consistent with the well-established role of Zfp36 in reducing Tnfa and Mcp1 gene expression (9). Similarly, in both lean and obese mice, IL-6 mRNA expression levels tended to be elevated in KO mice compared with Control mice, consistent with the published role of Zfp36 in regulating the expression of this factor (Fig. 7, B–D).
Fig. 7.

Liver cytokine mRNA expression in loxP-flanked zinc finger protein 36 (Zfp36) C57BL/6 [Zfp36fl/fl; Control (Ctrl)] and Zfp36fl/fl;LysMCre [myeloid knockout (KO)] lean and obese mice. A–D: classically (M1) aligned factors: Tnfa, monocyte chemoattractant protein-1 (Mcp1), IL-1b, IL-6. E–K: alternatively (M2) aligned factors: arginase-1 (Arg1), arginase-2 (Arg2), Chitinase-like 3 (Chil3), IL-10, IL-4, peroxisome proliferator-activated receptor-γ (Pparg), transforming growth factor-β (Tgfb1; n = 6–12 mice/group, mean values with SE; *P < 0.05). ns, nonsignificant difference.
When we measured anti-inflammatory or M2 hepatic transcripts, a slightly more heterogeneous effect of myeloid Zfp36 was observed. Arginase-1 (Arg1) transcripts, principally expressed in hepatocytes, were reduced in lean KO mice and in obese mice of both genotypes (Fig. 7E). Arg2 mRNA, expressed in immune cells but not in hepatocytes, was higher in lean KO mice than in lean Control mice and was significantly elevated in the obese KO livers compared with obese Control mice (Fig. 7F). These data suggest that enhanced myeloid-derived Arg activity is associated with an improved hepatic insulin response, reduced steatosis, and reduced injury, consistent with recent data in Arg2 null mice (40). mRNA expression of several other markers of M2 alignment was enhanced in obese mice and/or was affected by loss of myeloid Zfp36 (Fig. 7, G–K). In aggregate, our data confirm that obesity alters hepatic mRNA expression of some M1- and M2-aligned factors; many of these factors are additionally affected by myeloid loss of Zfp36 expression in both lean and obese mice.
Myeloid-specific loss of Zfp36 alters WAT and skeletal muscle gene expression.
Whereas lean and obese mice demonstrated altered adipose tissue mRNA expression of several factors involved in lipid transport and glucose metabolism, there were no significant differences in these transcripts between obese Control and obese KO mice (Table 3; see Adipose tissue lipid transport and metabolic factors). Obesity was associated with enhanced expression of inflammatory adipokines, including Tnfa, Mcp1, and IL-6, in Control and KO mice, and Tnfa expression was significantly higher in obese KO than obese Control mice (Table 3; see Adipose tissue M1- and M2-aligned cytokines and other factors). Obesity was associated with enhanced expression of the M2-aligned transcripts IL-10 and Chitinase-like 3 (Chil3) in both genotypes, and myeloid loss of Zfp36 was associated with further enhancement of these mRNAs in the obese mice (Table 3; see Adipose tissue M1- and M2-aligned cytokines and other factors). Obesity was also associated with enhanced fat expression of the satiety factor leptin, although we observed no significant differences in leptin or Ptgs2/cyclooxygenase 2 expression between the obese mice of each genotype (Table 3; see Adipose tissue M1- and M2-aligned cytokines and other factors). In aggregate, our data indicate that myeloid loss of Zfp36 leads to enhanced expression of M1 (Tnfa)- and M2 (IL-10, Chil3)-aligned adipokines in gonadal fat of obese mice.
Table 3.
White adipose tissue and skeletal muscle mRNA expression in loxP-flanked zinc finger protein 36 (Zfp36) C57BL/6 (Zfp36fl/fl; Control) and Zfp36fl/fl;LysMCre [myeloid knockout (KO)] lean and obese mice
| Control Lean | KO Lean | Control Obese | KO Obese | |
|---|---|---|---|---|
| Adipose tissue lipid transport and metabolic factors | ||||
| Cd36 | 1.00 ± 0.07 | 0.73 ± 0.10 | 1.20 ± 0.06 | 1.07 ± 0.03 |
| Abca1 | 1.00 ± 0.01 | 0.91 ± 0.07 | 1.15 ± 0.03 | 1.16 ± 0.05 |
| Fabp4 | 1.00 ± 0.03 | 0.91 ± 0.11 | 0.97 ± 0.05 | 1.00 ± 0.06 |
| Pnpla2 | 1.00 ± 0.09 | 0.89 ± 0.11 | 0.85 ± 0.08 | 0.89 ± 0.04 |
| Lipe | 1.00 ± 0.06 | 0.80 ± 0.10 | 0.87 ± 0.07 | 0.82 ± 0.05 |
| Lpl | 1.00 ± 0.04 | 0.82 ± 0.10 | 1.02 ± 0.03 | 0.97 ± 0.03 |
| Srebf1 | 1.00 ± 0.06 | 1.04 ± 0.03 | 1.28 ± 0.09 | 1.31 ± 0.04 |
| Glut4 | 1.00 ± 0.07 | 0.72 ± 0.11 | 0.61 ± 0.06 | 0.57 ± 0.03 |
| Adipoq | 1.00 ± 0.04 | 0.95 ± 0.12 | 0.55 ± 0.05 | 0.61 ± 0.05 |
| Adrb3 | 1.00 ± 0.12 | 0.74 ± 0.11 | 0.28 ± 0.03 | 0.24 ± 0.03 |
| Adipose tissue M1- and M2-aligned cytokines and other factors | ||||
| Tnfa | 1.00 ± 0.11 | 1.36 ± 0.18 | 2.48 ± 0.26 | 5.27 ± 0.36 |
| Mcp1 | 1.00 ± 0.09 | 0.79 ± 0.06 | 6.76 ± 0.64 | 6.93 ± 0.86 |
| IL-6 | 1.00 ± 0.10 | 0.80 ± 0.12 | 2.95 ± 0.34 | 3.92 ± 0.44 |
| IL-10 | 1.00 ± 0.17 | 1.18 ± 0.14 | 2.89 ± 0.35 | 8.45 ± 0.54 |
| Chil3 | 1.00 ± 0.08 | 1.83 ± 0.29 | 7.46 ± 0.59 | 15.85 ± 1.20 |
| Ptgs2 | 1.00 ± 0.03 | 1.12 ± 0.24 | 0.74 ± 0.17 | 1.00 ± 0.21 |
| Leptin | 1.00 ± 0.08 | 0.40 ± 0.05 | 3.45 ± 0.29 | 2.72 ± 0.38 |
| Skeletal muscle immune and metabolic factors | ||||
| Tnfa | 1.00 ± 0.13 | 1.12 ± 0.11 | 1.41 ± 0.22 | 1.73 ± 0.34 |
| Mcp1 | 1.00 ± 0.12 | 1.19 ± 0.20 | 1.95 ± 0.28 | 3.73 ± 0.42 |
| IL-6 | 1.00 ± 0.17 | 1.15 ± 0.12 | 1.17 ± 0.10 | 1.07 ± 0.06 |
| IL-10 | 1.00 ± 0.25 | 2.12 ± 0.57 | 1.08 ± 0.13 | 5.81 ± 1.84 |
| Chil3 | 1.00 ± 0.09 | 2.58 ± 0.41 | 1.81 ± 0.34 | 8.02 ± 1.74 |
| Mgl2 | 1.00 ± 0.12 | 1.01 ± 0.11 | 0.95 ± 0.08 | 1.50 ± 0.17 |
| Mac2 | 1.00 ± 0.12 | 0.90 ± 0.06 | 2.03 ± 0.34 | 3.80 ± 0.72 |
| Glut4 | 1.00 ± 0.04 | 1.12 ± 0.04 | 0.95 ± 0.04 | 0.91 ± 0.04 |
| Lpl | 1.00 ± 0.07 | 0.99 ± 0.10 | 1.10 ± 0.10 | 1.15 ± 0.07 |
Values are means ± SE; n = 6–10 mice/group, values are means with SE; bold values represent P < 0.05 when compared with respective Control mice. Cd36, cluster of differentiation 36; Abca1, ATP-binding cassette subfamily A member 1; Fabp4, fatty acid-binding protein 4; Pnpla2, palatin-like phospholipase domain containing 2; Lipe, hormone-sensitive lipase; Lpl, lipoprotein lipase; Srebf1, sterol response element-binding factor 1; Glut4, glucose transporter type 4 (solute carrier family 2, member 4); Adipoq, adiponectin; Adrb3, adrenergic receptor beta 3; M1, classically activated macrophage; M2, alternatively activated macrophage; Mcp1, monocyte chemoattractant protein-1; Chil3, Chitinase-like 3; Ptgs2, prostaglandin-endoperoxide synthase 2; Mgl2, macrophage galactose N-acetyl-galactosamine-specific lectin (macrophage galactose-type lectin 2).
In addition to liver and adipose tissue, skeletal muscle is an important target of the insulin response. We measured mRNA expression of important metabolic and immune genes expressed in skeletal muscle; when compared with lean Control mice, skeletal muscle expression of the M1-aligned cytokines Tnfa, Mcp1, and IL-6 tended to be higher in the lean Zfp36 KO mice, although these changes did not reach statistical significance (Table 3; see Skeletal muscle immune and metabolic factors). Myeloid loss of Zfp36 was associated with significantly higher mRNA expression of Mcp1 in obese mice (Table 3; see Skeletal muscle immune and metabolic factors). Myeloid loss of Zfp36 was similarly associated with enhanced expression of the M2-aligned factors IL-10, Chil3, and Mgl2 in obese mice (Table 3; see Skeletal muscle immune and metabolic factors) and with macrophage activation in muscle, as indicated by Mac2 mRNA expression in obese Zfp36 KO mice, although we did not test additional measures of macrophage activation in skeletal muscle from our mice (Table 3; see Skeletal muscle immune and metabolic factors). No significant differences were observed between genotypes in muscle expression of glucose transporter type 4 (Glut4) or lipoprotein lipase (Lpl) in our obese mice (Table 3; see Skeletal muscle immune and metabolic factors). Taken together, our data indicate that myeloid loss of Zfp36 leads to macrophage activation and enhanced expression of M1 (Mcp1)- and M2 (IL-10, Chil3, Mgl2)-aligned adipokines in skeletal muscle of obese mice, with no significant effects on Glut4 or Lpl mRNA expression.
Myeloid-specific loss of Zfp36 enhances hepatic insulin signaling and macrophage activation in the liver.
Having established that myeloid-expressed Zfp36 modulates hepatic insulin sensitivity, we next tested insulin signaling in the liver and skeletal muscle of our obese mice. Total Akt and pAkt-Ser473 were measured in mouse liver and skeletal muscle following intraperitoneal injection of insulin or saline. Insulin-stimulated phosphorylation of hepatic Akt was diminished in the myeloid Zfp36 KO mice, consistent with the reduced de novo lipogenesis in these mice (Fig. 8A). These data are consistent with recent observations demonstrating that extrahepatic insulin signaling can regulate hepatic glucose metabolism via Akt-independent pathways (34, 61). Likewise, obese Control, but not obese KO, mice demonstrated elevated hepatic mRNA expression of glucose-6-phosphatase, a major gluconeogenic enzyme boosted by insulin resistance (Fig. 8B). We did not observe significant differences in insulin-stimulated pAkt in the skeletal muscle of our obese mice (Fig. 8C).
We wondered whether the protection from insulin resistance in our KO mice might be attributed, at least in part, to loss of Zfp36 expression in Kupffer cells (KCs), the resident macrophages of the liver. Myeloid loss of Zfp36 leads to enhanced Mac2 expression in the livers of lean mice, and this effect persisted in the obese mice of both genotypes (Fig. 8D). These data are consistent with the elevated hepatic expression of chemotactic factors, such as Mcp1 in KO mice and in obese Control mice (Fig. 7B), but cannot fully explain the impaired insulin sensitivity observed only in the obese Control mice.
We measured expression of Zfp36 protein from whole-liver lysates and observed that lean mice, both Control and myeloid KO, did not express detectable levels of Zfp36 (Fig. 8E). In contrast, obese Control mice demonstrated enhanced hepatic expression of Zfp36, which was lost in the obese KO mice. These data suggest that Kupffer-expressed Zfp36 contributes to the pathogenesis of hepatic insulin resistance in DIO mice and that loss of Kupffer-expressed Zfp36 protects against insulin resistance.
To establish the source of hepatic Zfp36 expression in our mice, we isolated primary hepatocytes from our mice and observed no detectable Zfp36 protein in the basal state or after stimulation with LPS (Fig. 9A, compare with Fig. 1A). In contrast, primary isolated KCs from our mice demonstrated LPS-inducible expression of Zfp36 in Control but not KO mice (Fig. 9B). These data confirm KCs to be an important source of hepatic Zfp36 expression in the obese and insulin-resistant Control mice.
Fig. 9.
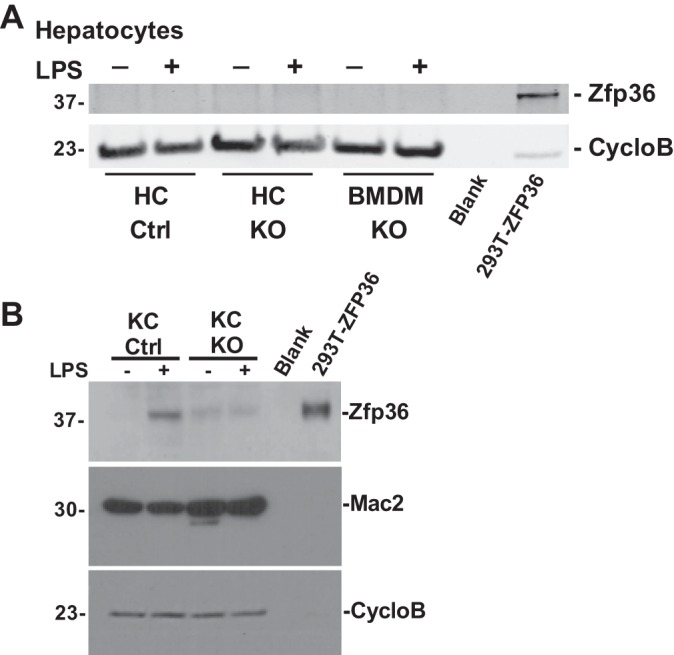
Kupffer cells (KCs), but not hepatocytes, express zinc finger protein 36 (Zfp36). A: vehicle and LPS-stimulated primary hepatocytes and bone marrow-derived macrophages (BMDM) isolated from loxP-flanked Zfp36 C57BL/6 [Zfp36fl/fl; Control (Ctrl)] and Zfp36fl/fl;LysMCre [myeloid knockout (KO)] mice were tested for Zfp36 protein expression by Western blotting using Cyclophilin B (CycloB) as loading control (compare with Fig. 1A). Positive control lane was 5 μg of cell lysate from 293T cells engineered to overexpress human ZFP36 cDNA. B: primary KCs express Zfp36 in response to LPS stimulation. Vehicle and LPS-stimulated primary KCs were tested for Zfp36 expression by Western blotting, as well as for Mac2 and Cyclophilin B expression (loading control). Positive control lane was 5 μg of cell lysate from 293T cells engineered to overexpress human ZFP36 cDNA. Data are representative of experiments performed 3 times.
We initiated mechanistic studies based on the recent observation that IKKβ, a critical promoter of inflammatory responses, is a positive regulator of hepatic insulin sensitivity (32). In those studies, the investigators demonstrated that IKKβ phosphorylates and enhances Xbp1 to enhance the insulin response. We tested whether the same intracellular pathways are engaged in our KO mice to protect against hepatic insulin resistance. We measured whole-liver expression of the p65 subunit of NF-κB and Xbp1 and found that overall expression of these factors was unaltered in the livers of our obese Control and KO mice (Fig. 10A). We next assessed liver nuclear extracts from our mice and observed enhanced nuclear localization of IKKβ in the obese KO mice protected from insulin resistance (Fig. 10B). This finding was associated with enhanced p65 expression in the liver nuclear extracts of the obese KO mice, whereas Xbp1 expression was similar in Control and KO hepatic nuclear lysates (Figs. 10, C and D). Our observations are in line with the recent report that enhanced IKKβ and NF-κB activities promote hepatic insulin sensitivity in obese mice, although our data indicate that the downstream responder(s) in our model system are unlikely to be Xbp1. Figure 11 emphasizes key observations from our work, draws links to known pathways relevant to hepatic insulin signaling, and highlights areas of mechanistic uncertainty.
Fig. 10.

Loss of Kupffer cell-expressed zinc finger protein 36 (Zfp36) in obese mice is associated with enhanced hepatic IKKβ and p65 but not X-box-binding protein 1 (XBP1) nuclear activation. Whole liver lysates and liver nuclear extracts were isolated from lean and obese loxP-flanked Zfp36 C57BL/6 (Zfp36fl/fl; Control) and Zfp36fl/fl;LysMCre [myeloid knockout (KO)] mice and tested for protein expression. A: whole liver lysates from obese Control and KO mice demonstrate similar p65 and Xbp1 protein expression (with actin-loading control). B: nuclear lysates from obese KO mice have enhanced levels of IKKβ compared with obese Control mice or lean mice of both genotypes (H3 loading control). C: nuclear lysates from obese KO mice have enhanced levels of p65 compared with obese Control mice or lean mice of both genotypes (H3 loading control). D: hepatic nuclear Xbp1 expression is similar in obese Control and KO mice and higher than that observed in lean mice of both genotypes (H3 loading control). Data are representative of experiments performed 3 times.
Fig. 11.

Model summarizing the effects of Kupffer-expressed zinc finger protein 36 (Zfp36) on the hepatic response to insulin in obese mice. Dotted lines indicate potential effects that remain to be fully explored. A: in obese Control (Zfp36fl/fl) mice, Zfp36 expression is upregulated in Kupffer cells (KC), leading to reduced expression of classically activated and alternatively activated (M1 and M2, respectively) cytokines. The factors that stimulate Zfp36 expression in the KCs of obese mice remain to be determined, but candidates include gut-derived endotoxin (LPS), as well as systemic or local lipids, cytokines, or growth factors that are perturbed in obese mice. The net effect of enhanced Zfp36 expression in KCs is to provoke insulin resistance in hepatocytes: this is demonstrated by the well-documented preservation of the lipid-promoting effects of insulin coupled with the impaired ability of insulin to regulate hepatic glucose production (HGP). The insulin-resistant mice experience hyperlipidemia, hepatic triglyceride (TG) accumulation/steatosis, and hyperglycemia. Extrahepatic factors responsible for modulating glucose metabolism in the livers of insulin-resistant mice may be impaired, although specific factors remain to be fully established (62). B: in obese, conditional Zfp36fl/fl;LysMCre [myeloid knockout (KO)] mice, loss of KC-expressed Zfp36 leads to enhanced expression of M1 and M2 cytokines. The net effects of these factors are to enhance insulin sensitivity in the livers of the KO mice; this is demonstrated by reduced lipid production and improved glucose tolerance in the KO mice. Improved insulin sensitivity in the KO mice leads to reduced hyperlipidemia, reduced hepatic TG accumulation/steatosis, and euglycemia. The improvement in insulin sensitivity is associated with enhanced activation of p65 in the livers of the KO mice, a feature recently described to contribute to the insulin response in the liver (32). FFA, free fatty acid; Mcp1, monocyte chemoattractant protein-1; Chil3, Chitinase-like 3; Arg2, arginase-2; IR, insulin receptor; PI3K, phosphatidylinositol 3-kinase; G6pc, glucose-6-phosphatase; Srebf1, sterol response element-binding factor 1; Fabp1, fatty acid-binding protein 1; Cpt1, carnitine palmitoyltransferase 1; Mgl1, macrophage galactose-type lectin 1; Scarb1, scavenger receptor class B member 1; Abca1, ATP-binding cassette subfamily A member 1; Cd36, cluster of differentiation 36; Chol, cholesterol; ALT, alanine transaminase.
DISCUSSION
We studied the metabolic effects of myeloid deletion of an anti-inflammatory mRNA-binding protein, Zfp36, in DIO mice. We observed protection from obesity-mediated hepatic insulin resistance with modest effects on adipose tissue and skeletal muscle glucose uptake. Insulin resistance was associated with enhanced Zfp36 expression in the KCs of obese Control mice. The favorable metabolic response to myeloid loss of Zfp36 was associated with increased M1 and M2 markers of hepatic and adipose-depot inflammation, whereas KO and Control mice had similar macrophage infiltration of the adipose depots and largely similar peripheral cytokine levels. In the liver, we observed enhanced expression of hepatic Tnfa, IL-1b, and IL-6 but also Arg2, Chil3, and IL-10 transcripts in obese KO mice compared with Control mice. Contrary to expectations, these findings were associated with reduced hepatic steatosis, decreased ALT, and improved lipid profiles in the obese KO mice compared with obese Control mice. Emerging evidence reveals a complexity and plasticity in innate immune cell phenotypes that challenge the binary view that M1- and M2-polarized macrophages are, respectively, metabolically harmful or beneficial (52, 67).
Inflammatory stimuli induce Zfp36 expression as part of a homeostatic response to limit inflammation. Similar feedback regulatory responses have been described for Toll-like receptor signaling in macrophages, which engenders inactivation of myeloid differentiation primary response 88 leading to inhibition of further Toll-like receptor signaling (17); T cell receptor signaling leading to activation of proteins (i.e., NF-κB inhibitor β and the regulator of calcineurin family), which ultimately terminates the T cell response (33); and several inflammatory stimuli that induce expression of suppressor of cytokine signaling proteins, which feeds back to inhibit additional cytokine signaling (10, 27, 28, 49, 51, 54). Whereas many lines of evidence indicate that M1 inflammatory factors, acting through JNK, PKC, IKKβ, and other pathways, can promote insulin resistance in obese mice (12, 14, 16), the data remain mixed with respect to the effects of anti-inflammatory therapies on insulin sensitivity in humans. Many studies indicate only a modest benefit of reducing inflammation to improve glucose metabolism in type 2 diabetes (37). It has recently been demonstrated that inflammation plays a favorable role in adipocyte development, and it has been proposed that any successful homeostatic response to infection must include both inflammation and allocation of metabolic resources (including catabolism) to the host immune response, which should, in a well-designed system, therefore be linked (19, 67). The support of the premise that inflammation can improve insulin sensitivity in some settings includes studies showing that loss of Tnfa signaling promotes insulin resistance, and enhanced IL-6 signaling improves insulin responsiveness in mice (2, 43). To complicate matters, in some mouse studies, it can be difficult to separate the metabolic consequences of inflammation from its effects on body weight/fat mass. The disparate findings, with respect to inflammation and insulin sensitivity, indicate tissue-specific and cell type-specific pathways, dose responses, and compensatory responses measured on distinct mouse backgrounds in diverse conditions, all of which require a continued and nuanced scientific approach.
We observed a reduced hepatic cluster of differentiation 36 (Cd36) mRNA expression in the KO mice, consistent with the observation that loss of hepatic Cd36 is associated with increased insulin sensitivity, reduced steatosis, and less hepatic injury (69). Obese Control mice demonstrated increased hepatic TG content and de novo lipogenesis associated with insulin resistance (68). Insulin-dependent changes in hepatic lipid metabolism are mediated by activated Akt and are lost after genetic ablation of hepatic Akt expression or hepatic Akt activity (30, 62); the robust expression of pAkt in the obese Control mice likely contributes to their increased de novo lipogenesis, steatosis, and hyperlipidemia. Less well understood are the mechanisms by which insulin indirectly affects the hepatic glucose metabolism, including via Akt-independent pathways (34, 61). We observed reduced insulin-dependent Akt signaling in the livers of obese KO mice, which was unexpected given that these lower levels often associate with insulin resistance in other mouse model systems. As an explanation for this, we highlight emerging data indicating that insulin can modulate hepatic glucose metabolism indirectly and independent of Akt (34, 63). Whereas we do not know which Akt-independent factors mediate the enhanced insulin sensitivity in our KO mice, we note that the elimination of hepatic forkhead box O1 (FoxO1) activity obviates the requirement for hepatic insulin or hepatic Akt signaling to regulate glucose homeostasis in mice (34, 40a). Whether local or systemic factors reduce FoxO1 activity in the livers of our KO mice remains to be established, and the identity of these factors remains unknown, although it is worth noting that many cytokine and growth-factor pathways are known to regulate FoxO1 activity downstream of Akt (38, 40a, 71). Our work demonstrated enhanced p65 expression in the liver nuclear extracts of our obese KO mice, data consistent with the recent report that enhanced IKKβ and NF-κB activities promote hepatic insulin sensitivity in obese mice (32). Future studies will be required to characterize fully the molecular mechanisms underlying the improved insulin sensitivity observed in our Zfp36 myeloid null mice.
DIO is associated with increased immune activation in the liver, although unlike adipose depots, this is not consistently associated with changes in macrophage cell numbers (6, 29, 41). We observed that insulin resistance in DIO mice is associated with enhanced hepatic expression of Zfp36. We demonstrated that hepatic Zfp36 expression in obese mice occurs in KCs but not hepatocytes and that liver expression is lost in our obese KO mice. The inability to upregulate KC Zfp36 expression in obese KO mice was associated with increased hepatic inflammation but also with protection from insulin resistance.
Building on recent observations that inflammation can be metabolically favorable, we demonstrated that deletion of myeloid Zfp36 results in activation of hepatic IKKβ and the p65 subunit of NF-κB, both recently shown to improve hepatic glucose homeostasis (32, 67). Notably, transgenic mice with overexpression of p65 in fat also demonstrated improved glucose homeostasis, although, unlike our Zfp36 KO mice, the aP2-p65 mice demonstrated considerably reduced body weight and body fat compared with Control mice on both regular or HF diets (58). Our results are consistent with a beneficial role of IKKβ/NF-κB-mediated hepatic inflammation in glucose homeostasis. In contrast to the genetic models used by Liu et al. (32), we did not detect changes in hepatic Xbp1 activity in the obese KO mice; this may be due to the overexpression of IKKβ in hepatocytes in their work as opposed to myeloid-specific gene deletion in our study. Diverse and cell type-specific compensatory responses to inflammation may account for disparate study findings, such as, for example, the observations that enhanced IKKβ expression improves hepatic glucose homeostasis in a tissue-specific fashion in some model systems, whereas myeloid loss of IKKβ has been demonstrated to protect against hepatic insulin resistance in other model systems (1, 32). Future studies will be needed to determine whether the effects of Zfp36 loss are mediated primarily through increased IKKβ and NF-κB or whether other pathways downstream of Zfp36 and/or IKKβ are involved.
Whereas our Zfp36 KO model was not associated with altered weight gain, fat mass, or lean mass on the obesogenic diet (each of which can be integral to our interpretation of the glucose tolerance test and clamp studies), a limitation of our study is that we cannot currently comment on caloric intake or energy expenditure in our mice. In contrast, several genetic models that target innate immune cells affect weight gain, insulin sensitivity, or both. Loss of macrophage-expressed Nbr1 was associated with reduced ATM content, reduced ATM inflammation, and improved glucose tolerance in DIO mice (18). Similarly, myeloid loss of suppressor of cytokine signaling 1 resulted in increased WAT and hepatic inflammation and insulin resistance in lean mice (48). Myeloid loss of the anti-inflammatory comparative gene identification 58 protein similarly enhanced hepatic and adipose tissue M1 inflammation in DIO mice and impaired insulin sensitivity (39). In contrast, myeloid loss of protein-tyrosine phosphatase 1B was associated with reduced adipose tissue M1 inflammation, enhanced IL-10 expression, and improved insulin sensitivity (15). Whereas IL-10 levels are inversely related to insulin resistance, the tissue-specific roles of IL-10 and IL-6 in modulating insulin sensitivity remain controversial (11, 25). We observed increased IL-10 expression in the livers of KO mice, supporting the concept that this cytokine has a protective effect.
In DIO rodents, depletion of KCs, using clodronate treatments, reduced cytokine expression, increased hepatic TGs, and produced inconsistent effects on insulin sensitivity (11, 22, 29). Conditional silencing of Kupffer-expressed NF-κB in obese mice decreased cytokine secretion and improved insulin sensitivity without altering hepatic lipid accumulation (60). In contrast, we observed that the KO mice demonstrate enhanced signaling through NF-κB and enhanced expression of M1 and M2 cytokines but were protected from hepatic steatosis and insulin resistance. This difference may reflect off-target effects of clodronate treatments, differences in genetic background, or details of the obesity models under study. However, it is also possible that both studies correctly reflect the ability of KCs to promote or inhibit insulin sensitivity, depending on the full molecular phenotype of the cells and somewhat independent of broad immune classifications, such as M1/M2.
In summary, we have shown that myeloid loss of Zfp36, although associated with enhanced hepatic inflammation, protects against DIO-induced insulin resistance. IKKβ-dependent pathways are likely to be mechanistically involved in protecting the KO mice from insulin resistance; this was not mediated by increased Xbp1, in contrast to prior studies using IKKβ overexpression in hepatocytes (32). Additional studies will be required to determine the mechanism of IKKβ activation in the Zfp36 myeloid KO mice. These may include intracellular and extracellular lipid species, factors stemming from altered gut microbiota, and changes in endoplasmic reticulum stress. Our findings highlight the importance of innate immune cells in regulating insulin sensitivity, identify Zfp36 as a potent modulator of hepatic lipid and glucose metabolism, and confirm that M1-aligned inflammation is not always associated with unfavorable metabolic effects.
GRANTS
Support for this work was provided by the National Institute of Diabetes and Digestive and Kidney Diseases (NIDDK; R01DK091841, to C. B. Kallen), National Institute on Alcohol Abuse and Alcoholism (R21AA023571, to R. Summer), and National Heart, Lung, and Blood Institute (R01HL10549, to R. Summer). Studies were performed at the National Mouse Metabolic Phenotyping Center (MMPC) at the University of Massachusetts under NIDDK Grants U24-DK093000 (to J. K. Kim) and R01-CA170533 and P30-CA56036 (to S. A. Waldman). Targeted Diagnostic and Therapeutics Inc. funded some of the effort of S. A. Waldman (no experiments performed). Studies were also supported, in part, by the Intramural Research Program of the National Institute of Environmental Health Sciences (to P. J. Blackshear).
DISCLOSURES
No conflicts of interest, financial or otherwise, are declared by the authors.
AUTHOR CONTRIBUTIONS
R.S. and C.B.K. conceived and designed research; V.C., J.Y., D.G., Y.N., S.J.F., D.Y.J., H.L.N., T.K., D.O., and R.C.B. performed experiments; V.C., J.Y., D.G., Y.N., S.J.F., R.S., J.K.K., P.J.B., D.O., and C.B.K. analyzed data; V.C., J.Y., D.G., R.S., S.A.W., J.K.K., P.J.B., D.O., and C.B.K. interpreted results of experiments; V.C., J.Y., and C.B.K. prepared figures; C.B.K. drafted manuscript; R.S., S.A.W., J.K.K., P.J.B., and C.B.K. edited and revised manuscript; C.B.K. approved final version of manuscript.
ACKNOWLEDGMENTS
The authors thank Dr. Joshua R. Friedman for his helpful scientific discussions during these studies. This work was performed at Thomas Jefferson University.
Present address of C. B. Kallen: Shady Grove Fertility Center, 945 Chesterbrook Blvd., Chesterbrook, PA 19087.
REFERENCES
- 1.Arkan MC, Hevener AL, Greten FR, Maeda S, Li ZW, Long JM, Wynshaw-Boris A, Poli G, Olefsky J, Karin M. IKK-beta links inflammation to obesity-induced insulin resistance. Nat Med 11: 191–198, 2005. doi: 10.1038/nm1185. [DOI] [PubMed] [Google Scholar]
- 2.Awazawa M, Ueki K, Inabe K, Yamauchi T, Kubota N, Kaneko K, Kobayashi M, Iwane A, Sasako T, Okazaki Y, Ohsugi M, Takamoto I, Yamashita S, Asahara H, Akira S, Kasuga M, Kadowaki T. Adiponectin enhances insulin sensitivity by increasing hepatic IRS-2 expression via a macrophage-derived IL-6-dependent pathway. Cell Metab 13: 401–412, 2011. doi: 10.1016/j.cmet.2011.02.010. [DOI] [PubMed] [Google Scholar]
- 3.Blackshear PJ. Tristetraprolin and other CCCH tandem zinc-finger proteins in the regulation of mRNA turnover. Biochem Soc Trans 30: 945–952, 2002. doi: 10.1042/bst0300945. [DOI] [PubMed] [Google Scholar]
- 4.Boden G. Obesity and free fatty acids. Endocrinol Metab Clin North Am 37: 635–646, 2008. doi: 10.1016/j.ecl.2008.06.007. [DOI] [PMC free article] [PubMed] [Google Scholar]
- 5.Bruun JM, Lihn AS, Pedersen SB, Richelsen B. Monocyte chemoattractant protein-1 release is higher in visceral than subcutaneous human adipose tissue (AT): implication of macrophages resident in the AT. J Clin Endocrinol Metab 90: 2282–2289, 2005. doi: 10.1210/jc.2004-1696. [DOI] [PubMed] [Google Scholar]
- 6.Cai D, Yuan M, Frantz DF, Melendez PA, Hansen L, Lee J, Shoelson SE. Local and systemic insulin resistance resulting from hepatic activation of IKK-beta and NF-kappaB. Nat Med 11: 183–190, 2005. doi: 10.1038/nm1166. [DOI] [PMC free article] [PubMed] [Google Scholar]
- 7.Cani PD, Bibiloni R, Knauf C, Waget A, Neyrinck AM, Delzenne NM, Burcelin R. Changes in gut microbiota control metabolic endotoxemia-induced inflammation in high-fat diet-induced obesity and diabetes in mice. Diabetes 57: 1470–1481, 2008. doi: 10.2337/db07-1403. [DOI] [PubMed] [Google Scholar]
- 8.Cantley JL, Yoshimura T, Camporez JP, Zhang D, Jornayvaz FR, Kumashiro N, Guebre-Egziabher F, Jurczak MJ, Kahn M, Guigni BA, Serr J, Hankin J, Murphy RC, Cline GW, Bhanot S, Manchem VP, Brown JM, Samuel VT, Shulman GI. CGI-58 knockdown sequesters diacylglycerols in lipid droplets/ER-preventing diacylglycerol-mediated hepatic insulin resistance. Proc Natl Acad Sci USA 110: 1869–1874, 2013. doi: 10.1073/pnas.1219456110. [DOI] [PMC free article] [PubMed] [Google Scholar]
- 9.Carballo E, Blackshear PJ. Roles of tumor necrosis factor-alpha receptor subtypes in the pathogenesis of the tristetraprolin-deficiency syndrome. Blood 98: 2389–2395, 2001. doi: 10.1182/blood.V98.8.2389. [DOI] [PubMed] [Google Scholar]
- 10.Carballo E, Lai WS, Blackshear PJ. Feedback inhibition of macrophage tumor necrosis factor-alpha production by tristetraprolin. Science 281: 1001–1005, 1998. doi: 10.1126/science.281.5379.1001. [DOI] [PubMed] [Google Scholar]
- 11.Clementi AH, Gaudy AM, van Rooijen N, Pierce RH, Mooney RA. Loss of Kupffer cells in diet-induced obesity is associated with increased hepatic steatosis, STAT3 signaling, and further decreases in insulin signaling. Biochim Biophys Acta 1792: 1062–1072, 2009. doi: 10.1016/j.bbadis.2009.08.007. [DOI] [PMC free article] [PubMed] [Google Scholar]
- 12.Ferrante AW., Jr Obesity-induced inflammation: a metabolic dialogue in the language of inflammation. J Intern Med 262: 408–414, 2007. doi: 10.1111/j.1365-2796.2007.01852.x. [DOI] [PubMed] [Google Scholar]
- 13.Garneau NL, Wilusz J, Wilusz CJ. The highways and byways of mRNA decay. Nat Rev Mol Cell Biol 8: 113–126, 2007. doi: 10.1038/nrm2104. [DOI] [PubMed] [Google Scholar]
- 14.Glass CK, Olefsky JM. Inflammation and lipid signaling in the etiology of insulin resistance. Cell Metab 15: 635–645, 2012. doi: 10.1016/j.cmet.2012.04.001. [DOI] [PMC free article] [PubMed] [Google Scholar]
- 15.Grant L, Shearer KD, Czopek A, Lees EK, Owen C, Agouni A, Workman J, Martin-Granados C, Forrester JV, Wilson HM, Mody N, Delibegovic M. Myeloid-cell protein tyrosine phosphatase-1B deficiency in mice protects against high-fat diet and lipopolysaccharide-induced inflammation, hyperinsulinemia, and endotoxemia through an IL-10 STAT3-dependent mechanism. Diabetes 63: 456–470, 2014. doi: 10.2337/db13-0885. [DOI] [PubMed] [Google Scholar]
- 16.Gregor MF, Hotamisligil GS. Inflammatory mechanisms in obesity. Annu Rev Immunol 29: 415–445, 2011. doi: 10.1146/annurev-immunol-031210-101322. [DOI] [PubMed] [Google Scholar]
- 17.Han C, Jin J, Xu S, Liu H, Li N, Cao X. Integrin CD11b negatively regulates TLR-triggered inflammatory responses by activating Syk and promoting degradation of MyD88 and TRIF via Cbl-b. Nat Immunol 11: 734–742, 2010. doi: 10.1038/ni.1908. [DOI] [PubMed] [Google Scholar]
- 18.Hernandez ED, Lee SJ, Kim JY, Duran A, Linares JF, Yajima T, Müller TD, Tschöp MH, Smith SR, Diaz-Meco MT, Moscat J. A macrophage NBR1-MEKK3 complex triggers JNK-mediated adipose tissue inflammation in obesity. Cell Metab 20: 499–511, 2014. doi: 10.1016/j.cmet.2014.06.008. [DOI] [PMC free article] [PubMed] [Google Scholar]
- 19.Hotamisligil GS. Inflammation and metabolic disorders. Nature 444: 860–867, 2006. doi: 10.1038/nature05485. [DOI] [PubMed] [Google Scholar]
- 20.Hotamisligil GS, Arner P, Caro JF, Atkinson RL, Spiegelman BM. Increased adipose tissue expression of tumor necrosis factor-alpha in human obesity and insulin resistance. J Clin Invest 95: 2409–2415, 1995. doi: 10.1172/JCI117936. [DOI] [PMC free article] [PubMed] [Google Scholar]
- 21.Hotamisligil GS, Shargill NS, Spiegelman BM. Adipose expression of tumor necrosis factor-alpha: direct role in obesity-linked insulin resistance. Science 259: 87–91, 1993. doi: 10.1126/science.7678183. [DOI] [PubMed] [Google Scholar]
- 22.Huang W, Metlakunta A, Dedousis N, Zhang P, Sipula I, Dube JJ, Scott DK, O’Doherty RM. Depletion of liver Kupffer cells prevents the development of diet-induced hepatic steatosis and insulin resistance. Diabetes 59: 347–357, 2010. doi: 10.2337/db09-0016. [DOI] [PMC free article] [PubMed] [Google Scholar]
- 24.Kamei N, Tobe K, Suzuki R, Ohsugi M, Watanabe T, Kubota N, Ohtsuka-Kowatari N, Kumagai K, Sakamoto K, Kobayashi M, Yamauchi T, Ueki K, Oishi Y, Nishimura S, Manabe I, Hashimoto H, Ohnishi Y, Ogata H, Tokuyama K, Tsunoda M, Ide T, Murakami K, Nagai R, Kadowaki T. Overexpression of monocyte chemoattractant protein-1 in adipose tissues causes macrophage recruitment and insulin resistance. J Biol Chem 281: 26602–26614, 2006. doi: 10.1074/jbc.M601284200. [DOI] [PubMed] [Google Scholar]
- 25.Kim HJ, Higashimori T, Park SY, Choi H, Dong J, Kim YJ, Noh HL, Cho YR, Cline G, Kim YB, Kim JK. Differential effects of interleukin-6 and -10 on skeletal muscle and liver insulin action in vivo. Diabetes 53: 1060–1067, 2004. doi: 10.2337/diabetes.53.4.1060. [DOI] [PubMed] [Google Scholar]
- 26.Kim JK. Hyperinsulinemic-euglycemic clamp to assess insulin sensitivity in vivo. Methods Mol Biol 560: 221–238, 2009. doi: 10.1007/978-1-59745-448-3_15. [DOI] [PubMed] [Google Scholar]
- 27.Kratochvill F, Gratz N, Qualls JE, Van De Velde LA, Chi H, Kovarik P, Murray PJ. Tristetraprolin limits inflammatory cytokine production in tumor-associated macrophages in an mRNA decay-independent manner. Cancer Res 75: 3054–3064, 2015. doi: 10.1158/0008-5472.CAN-15-0205. [DOI] [PMC free article] [PubMed] [Google Scholar]
- 28.Kratochvill F, Machacek C, Vogl C, Ebner F, Sedlyarov V, Gruber AR, Hartweger H, Vielnascher R, Karaghiosoff M, Rülicke T, Müller M, Hofacker I, Lang R, Kovarik P. Tristetraprolin-driven regulatory circuit controls quality and timing of mRNA decay in inflammation. Mol Syst Biol 7: 560, 2011. doi: 10.1038/msb.2011.93. [DOI] [PMC free article] [PubMed] [Google Scholar]
- 29.Lanthier N, Molendi-Coste O, Cani PD, van Rooijen N, Horsmans Y, Leclercq IA. Kupffer cell depletion prevents but has no therapeutic effect on metabolic and inflammatory changes induced by a high-fat diet. FASEB J 25: 4301–4311, 2011. doi: 10.1096/fj.11-189472. [DOI] [PubMed] [Google Scholar]
- 30.Leavens KF, Easton RM, Shulman GI, Previs SF, Birnbaum MJ. Akt2 is required for hepatic lipid accumulation in models of insulin resistance. Cell Metab 10: 405–418, 2009. doi: 10.1016/j.cmet.2009.10.004. [DOI] [PMC free article] [PubMed] [Google Scholar]
- 31.Liang J, Lei T, Song Y, Yanes N, Qi Y, Fu M. RNA-destabilizing factor tristetraprolin negatively regulates NF-kappaB signaling. J Biol Chem 284: 29383–29390, 2009. doi: 10.1074/jbc.M109.024745. [DOI] [PMC free article] [PubMed] [Google Scholar]
- 32.Liu J, Ibi D, Taniguchi K, Lee J, Herrema H, Akosman B, Mucka P, Salazar Hernandez MA, Uyar MF, Park SW, Karin M, Ozcan U. Inflammation improves glucose homeostasis through IKKβ-XBP1s interaction. Cell 167: 1052–1066, 2016. doi: 10.1016/j.cell.2016.10.015. [DOI] [PMC free article] [PubMed] [Google Scholar]
- 33.Liu JO. The yins of T cell activation. Sci STKE 2005: re1, 2005. doi: 10.1126/stke.2652005re1. [DOI] [PubMed] [Google Scholar]
- 34.Lu M, Wan M, Leavens KF, Chu Q, Monks BR, Fernandez S, Ahima RS, Ueki K, Kahn CR, Birnbaum MJ. Insulin regulates liver metabolism in vivo in the absence of hepatic Akt and Foxo1. Nat Med 18: 388–395, 2012. doi: 10.1038/nm.2686. [DOI] [PMC free article] [PubMed] [Google Scholar]
- 35.Lumeng CN, Deyoung SM, Bodzin JL, Saltiel AR. Increased inflammatory properties of adipose tissue macrophages recruited during diet-induced obesity. Diabetes 56: 16–23, 2007. doi: 10.2337/db06-1076. [DOI] [PubMed] [Google Scholar]
- 36.Macotela Y, Boucher J, Tran TT, Kahn CR. Sex and depot differences in adipocyte insulin sensitivity and glucose metabolism. Diabetes 58: 803–812, 2009. doi: 10.2337/db08-1054. [DOI] [PMC free article] [PubMed] [Google Scholar]
- 37.Maiorino MI, Bellastella G, Giugliano D, Esposito K. Cooling down inflammation in type 2 diabetes: how strong is the evidence for cardiometabolic benefit? Endocrine 55: 360–365, 2017. doi: 10.1007/s12020-016-0993-7. [DOI] [PubMed] [Google Scholar]
- 38.Manning BD, Toker A. AKT/PKB signaling: navigating the network. Cell 169: 381–405, 2017. doi: 10.1016/j.cell.2017.04.001. [DOI] [PMC free article] [PubMed] [Google Scholar]
- 39.Miao H, Ou J, Ma Y, Guo F, Yang Z, Wiggins M, Liu C, Song W, Han X, Wang M, Cao Q, Chung BH, Yang D, Liang H, Xue B, Shi H, Gan L, Yu L. Macrophage CGI-58 deficiency activates ROS-inflammasome pathway to promote insulin resistance in mice. Cell Reports 7: 223–235, 2014. doi: 10.1016/j.celrep.2014.02.047. [DOI] [PMC free article] [PubMed] [Google Scholar]
- 40.Navarro LA, Wree A, Povero D, Berk MP, Eguchi A, Ghosh S, Papouchado BG, Erzurum SC, Feldstein AE. Arginase 2 deficiency results in spontaneous steatohepatitis: a novel link between innate immune activation and hepatic de novo lipogenesis. J Hepatol 62: 412–420, 2015. doi: 10.1016/j.jhep.2014.09.015. [DOI] [PMC free article] [PubMed] [Google Scholar]
- 40a.O-Sullivan I, Zhang W, Wasserman DH, Liew CW, Liu J, Paik J, DePinho RA, Stolz DB, Kahn CR, Schwartz MW, Unterman TG; I OS . FoxO1 integrates direct and indirect effects of insulin on hepatic glucose production and glucose utilization. Nat Commun 6: 7079, 2015. doi: 10.1038/ncomms8079. [DOI] [PMC free article] [PubMed] [Google Scholar]
- 41.Obstfeld AE, Sugaru E, Thearle M, Francisco AM, Gayet C, Ginsberg HN, Ables EV, Ferrante AW Jr. C-C chemokine receptor 2 (CCR2) regulates the hepatic recruitment of myeloid cells that promote obesity-induced hepatic steatosis. Diabetes 59: 916–925, 2010. doi: 10.2337/db09-1403. [DOI] [PMC free article] [PubMed] [Google Scholar]
- 42.Odegaard JI, Ricardo-Gonzalez RR, Goforth MH, Morel CR, Subramanian V, Mukundan L, Red Eagle A, Vats D, Brombacher F, Ferrante AW, Chawla A. Macrophage-specific PPARgamma controls alternative activation and improves insulin resistance. Nature 447: 1116–1120, 2007. doi: 10.1038/nature05894. [DOI] [PMC free article] [PubMed] [Google Scholar]
- 43.Pamir N, McMillen TS, Kaiyala KJ, Schwartz MW, LeBoeuf RC. Receptors for tumor necrosis factor-alpha play a protective role against obesity and alter adipose tissue macrophage status. Endocrinology 150: 4124–4134, 2009. doi: 10.1210/en.2009-0137. [DOI] [PMC free article] [PubMed] [Google Scholar]
- 44.Patsouris D, Li PP, Thapar D, Chapman J, Olefsky JM, Neels JG. Ablation of CD11c-positive cells normalizes insulin sensitivity in obese insulin resistant animals. Cell Metab 8: 301–309, 2008. doi: 10.1016/j.cmet.2008.08.015. [DOI] [PMC free article] [PubMed] [Google Scholar]
- 45.Qiu LQ, Stumpo DJ, Blackshear PJ. Myeloid-specific tristetraprolin deficiency in mice results in extreme lipopolysaccharide sensitivity in an otherwise minimal phenotype. J Immunol 188: 5150–5159, 2012. doi: 10.4049/jimmunol.1103700. [DOI] [PMC free article] [PubMed] [Google Scholar]
- 46.Ruan H, Lodish HF. Regulation of insulin sensitivity by adipose tissue-derived hormones and inflammatory cytokines. Curr Opin Lipidol 15: 297–302, 2004. doi: 10.1097/00041433-200406000-00009. [DOI] [PubMed] [Google Scholar]
- 47.Rydén M, Dicker A, van Harmelen V, Hauner H, Brunnberg M, Perbeck L, Lonnqvist F, Arner P. Mapping of early signaling events in tumor necrosis factor-alpha -mediated lipolysis in human fat cells. J Biol Chem 277: 1085–1091, 2002. doi: 10.1074/jbc.M109498200. [DOI] [PubMed] [Google Scholar]
- 48.Sachithanandan N, Graham KL, Galic S, Honeyman JE, Fynch SL, Hewitt KA, Steinberg GR, Kay TW. Macrophage deletion of SOCS1 increases sensitivity to LPS and palmitic acid and results in systemic inflammation and hepatic insulin resistance. Diabetes 60: 2023–2031, 2011. doi: 10.2337/db11-0259. [DOI] [PMC free article] [PubMed] [Google Scholar]
- 49.Sauer I, Schaljo B, Vogl C, Gattermeier I, Kolbe T, Müller M, Blackshear PJ, Kovarik P. Interferons limit inflammatory responses by induction of tristetraprolin. Blood 107: 4790–4797, 2006. doi: 10.1182/blood-2005-07-3058. [DOI] [PMC free article] [PubMed] [Google Scholar]
- 50.Schichl YM, Resch U, Hofer-Warbinek R, de Martin R. Tristetraprolin impairs NF-kappaB/p65 nuclear translocation. J Biol Chem 284: 29571–29581, 2009. doi: 10.1074/jbc.M109.031237. [DOI] [PMC free article] [PubMed] [Google Scholar]
- 51.Sedlyarov V, Fallmann J, Ebner F, Huemer J, Sneezum L, Ivin M, Kreiner K, Tanzer A, Vogl C, Hofacker I, Kovarik P. Tristetraprolin binding site atlas in the macrophage transcriptome reveals a switch for inflammation resolution. Mol Syst Biol 12: 868, 2016. doi: 10.15252/msb.20156628. [DOI] [PMC free article] [PubMed] [Google Scholar]
- 52.Shaul ME, Bennett G, Strissel KJ, Greenberg AS, Obin MS. Dynamic, M2-like remodeling phenotypes of CD11c+ adipose tissue macrophages during high-fat diet–induced obesity in mice. Diabetes 59: 1171–1181, 2010. doi: 10.2337/db09-1402. [DOI] [PMC free article] [PubMed] [Google Scholar]
- 53.Shi H, Kokoeva MV, Inouye K, Tzameli I, Yin H, Flier JS. TLR4 links innate immunity and fatty acid-induced insulin resistance. J Clin Invest 116: 3015–3025, 2006. doi: 10.1172/JCI28898. [DOI] [PMC free article] [PubMed] [Google Scholar]
- 54.Starr R, Willson TA, Viney EM, Murray LJ, Rayner JR, Jenkins BJ, Gonda TJ, Alexander WS, Metcalf D, Nicola NA, Hilton DJ. A family of cytokine-inducible inhibitors of signalling. Nature 387: 917–921, 1997. doi: 10.1038/43206. [DOI] [PubMed] [Google Scholar]
- 55.Storlien LH, Jenkins AB, Chisholm DJ, Pascoe WS, Khouri S, Kraegen EW. Influence of dietary fat composition on development of insulin resistance in rats. Relationship to muscle triglyceride and omega-3 fatty acids in muscle phospholipid. Diabetes 40: 280–289, 1991. doi: 10.2337/diab.40.2.280. [DOI] [PubMed] [Google Scholar]
- 56.Subramanian V, Ferrante AW Jr. Obesity, inflammation, and macrophages. Nestle Nutr Workshop Ser Pediatr Program 63: 151–168, 2009. doi: 10.1159/000209979. [DOI] [PubMed] [Google Scholar]
- 57.Tamura Y, Sugimoto M, Murayama T, Ueda Y, Kanamori H, Ono K, Ariyasu H, Akamizu T, Kita T, Yokode M, Arai H. Inhibition of CCR2 ameliorates insulin resistance and hepatic steatosis in db/db mice. Arterioscler Thromb Vasc Biol 28: 2195–2201, 2008. doi: 10.1161/ATVBAHA.108.168633. [DOI] [PubMed] [Google Scholar]
- 58.Tang T, Zhang J, Yin J, Staszkiewicz J, Gawronska-Kozak B, Jung DY, Ko HJ, Ong H, Kim JK, Mynatt R, Martin RJ, Keenan M, Gao Z, Ye J. Uncoupling of inflammation and insulin resistance by NF-kappaB in transgenic mice through elevated energy expenditure. J Biol Chem 285: 4637–4644, 2010. doi: 10.1074/jbc.M109.068007. [DOI] [PMC free article] [PubMed] [Google Scholar]
- 59.Taylor GA, Carballo E, Lee DM, Lai WS, Thompson MJ, Patel DD, Schenkman DI, Gilkeson GS, Broxmeyer HE, Haynes BF, Blackshear PJ. A pathogenetic role for TNF alpha in the syndrome of cachexia, arthritis, and autoimmunity resulting from tristetraprolin (TTP) deficiency. Immunity 4: 445–454, 1996. doi: 10.1016/S1074-7613(00)80411-2. [DOI] [PubMed] [Google Scholar]
- 60.Tencerova M, Aouadi M, Vangala P, Nicoloro SM, Yawe JC, Cohen JL, Shen Y, Garcia-Menendez L, Pedersen DJ, Gallagher-Dorval K, Perugini RA, Gupta OT, Czech MP. Activated Kupffer cells inhibit insulin sensitivity in obese mice. FASEB J 29: 2959–2969, 2015. doi: 10.1096/fj.15-270496. [DOI] [PMC free article] [PubMed] [Google Scholar]
- 61.Titchenell PM, Chu Q, Monks BR, Birnbaum MJ. Hepatic insulin signalling is dispensable for suppression of glucose output by insulin in vivo. Nat Commun 6: 7078, 2015. doi: 10.1038/ncomms8078. [DOI] [PMC free article] [PubMed] [Google Scholar]
- 62.Titchenell PM, Lazar MA, Birnbaum MJ. Unraveling the regulation of hepatic metabolism by insulin. Trends Endocrinol Metab 28: 497–505, 2017. doi: 10.1016/j.tem.2017.03.003. [DOI] [PMC free article] [PubMed] [Google Scholar]
- 63.Titchenell PM, Quinn WJ, Lu M, Chu Q, Lu W, Li C, Chen H, Monks BR, Chen J, Rabinowitz JD, Birnbaum MJ. Direct hepatocyte insulin signaling is required for lipogenesis but is dispensable for the suppression of glucose production. Cell Metab 23: 1154–1166, 2016. doi: 10.1016/j.cmet.2016.04.022. [DOI] [PMC free article] [PubMed] [Google Scholar]
- 64.Uysal KT, Wiesbrock SM, Marino MW, Hotamisligil GS. Protection from obesity-induced insulin resistance in mice lacking TNF-alpha function. Nature 389: 610–614, 1997. doi: 10.1038/39335. [DOI] [PubMed] [Google Scholar]
- 65.Weisberg SP, Hunter D, Huber R, Lemieux J, Slaymaker S, Vaddi K, Charo I, Leibel RL, Ferrante AW Jr. CCR2 modulates inflammatory and metabolic effects of high-fat feeding. J Clin Invest 116: 115–124, 2006. doi: 10.1172/JCI24335. [DOI] [PMC free article] [PubMed] [Google Scholar]
- 66.Weisberg SP, McCann D, Desai M, Rosenbaum M, Leibel RL, Ferrante AW Jr. Obesity is associated with macrophage accumulation in adipose tissue. J Clin Invest 112: 1796–1808, 2003. doi: 10.1172/JCI200319246. [DOI] [PMC free article] [PubMed] [Google Scholar]
- 67.Wernstedt Asterholm I, Tao C, Morley TS, Wang QA, Delgado-Lopez F, Wang ZV, Scherer PE. Adipocyte inflammation is essential for healthy adipose tissue expansion and remodeling. Cell Metab 20: 103–118, 2014. doi: 10.1016/j.cmet.2014.05.005. [DOI] [PMC free article] [PubMed] [Google Scholar]
- 68.Williams KJ, Wu X. Imbalanced insulin action in chronic over nutrition: clinical harm, molecular mechanisms, and a way forward. Atherosclerosis 247: 225–282, 2016. doi: 10.1016/j.atherosclerosis.2016.02.004. [DOI] [PubMed] [Google Scholar]
- 69.Wilson CG, Tran JL, Erion DM, Vera NB, Febbraio M, Weiss EJ. Hepatocyte-specific disruption of CD36 attenuates fatty liver and improves insulin sensitivity in HFD-fed mice. Endocrinology 157: 570–585, 2016. doi: 10.1210/en.2015-1866. [DOI] [PMC free article] [PubMed] [Google Scholar]
- 70.Zhang H, Taylor WR, Joseph G, Caracciolo V, Gonzales DM, Sidell N, Seli E, Blackshear PJ, Kallen CB. mRNA-binding protein ZFP36 is expressed in atherosclerotic lesions and reduces inflammation in aortic endothelial cells. Arterioscler Thromb Vasc Biol 33: 1212–1220, 2013. doi: 10.1161/ATVBAHA.113.301496. [DOI] [PMC free article] [PubMed] [Google Scholar]
- 71.Zhang W, Bu SY, Mashek MT, O-Sullivan I, Sibai Z, Khan SA, Ilkayeva O, Newgard CB, Mashek DG, Unterman TG. Integrated regulation of hepatic lipid and glucose metabolism by adipose triacylglycerol lipase and FoxO proteins. Cell Reports 15: 349–359, 2016. doi: 10.1016/j.celrep.2016.03.021. [DOI] [PMC free article] [PubMed] [Google Scholar]