

Abstract
The urinary tract is usually culture negative despite its close proximity to microbial flora. The precise mechanism by which the kidneys and urinary tract defends against infection is not well understood. The initial kidney cells to encounter ascending pathogens are the collecting tubule cells that consist of principal cells (PCs) that express aquaporin 2 (AQP2) and intercalated cells (ICs) that express vacuolar H+-ATPase (V-ATPase, B1 subunit). We have previously shown that ICs are involved with the human renal innate immune defense. Here we generated two reporter mice, VATPase B1-cre+tdT+ mice to fluorescently label ICs and AQP2-cre+tdT+ mice to fluorescently label PCs, and then performed flow sorting to enrich PCs and ICs for analysis. Isolated ICs and PCs along with proximal tubular cells were used to measure antimicrobial peptide (AMP) mRNA expression. ICs and PCs were significantly enriched for AMPs. Isolated ICs responded to uropathogenic Escherichia coli (UPEC) challenge in vitro and had higher RNase4 gene expression than control while both ICs and PCs responded to UPEC challenge in vivo by upregulating Defb1 mRNA expression. To our knowledge, this is the first report of isolating murine collecting tubule cells and performing targeted analysis for multiple classes of AMPs.
Keywords: antimicrobial peptide, AMP, innate immunity, intercalated cell, principal cell
INTRODUCTION
The mammalian immune response consists of both adaptive and innate immunity. Adaptive immunity protects days to weeks after infection through the selection of highly specific T-cell-receptor bearing lymphocytes and antibodies (38). In contrast, innate immunity responds rapidly to microbial invasion and is the primary antimicrobial defense found in the urinary tract (9, 12, 38). The innate immune system includes pattern recognition receptors, chemokines, cytokines, phagocytes, and proteins with antimicrobial activity (36). Proteins with antimicrobial activity include 1) bacteriostatic proteins that sequester nutrient metals (e.g., lipocalins and lactoferrin); 2) lectins that specifically bind pathogens but do not kill (e.g., galectins and mannitose-binding lectins); and 3) antimicrobial peptides (AMPs) that rapidly and directly kill pathogens (e.g., defensins, ribonucleases, and cathelicidin) (1, 2, 6, 7, 11, 19, 23, 30, 33, 40). The renal epithelial innate immune response has not been extensively investigated.
The kidney cells initially exposed to ascending pathogens are located in the collecting ducts. Collecting ducts consist of two cell types: principal cells (PCs) that express aquaporin 2 (AQP2) and regulate water along with salt reabsorption and intercalated cells (ICs) that express vacuolar H+-ATPase (V-ATPase, B1 subunit) and help maintain acid-base homeostasis (4, 14). Increasing evidence indicates that ICs also function as important innate immune cells notably, 1) bacteria preferentially attach to the apical surface of ICs (5); 2) ICs express innate immune proteins (10, 25, 29, 31); 3) mice deficient in ICs are more susceptible to bacteruria and pyelonephritis (13, 25); and 4) renal ICs sense and mediate inflammation (3). Studies of the innate immune role of ICs and/or collecting ducts have mostly been limited to a single gene or protein (24, 29–31). A targeted evaluation of IC innate immune expression has previously not been reported.
The kidney is a complex and heterogeneous organ. For instance, renal tubules consist of multiple segments including the proximal tubule, loop of Henle, distal convoluted tubule, connecting tubule, and collecting duct (16). Whole kidney mRNA or protein profiles can be difficult to interpret because of the wide range of cell subtypes including renal tubular cells from the different tubular segments, vascular cells, and glomerular cells along with resident and recruited inflammatory cells, all with unique biological functions resulting from cell-specific gene expression patterns. Generation of transgenic mice expressing Cre recombinase under the control of IC- and PC-specific promoters provides a modality for the evaluation of collecting duct innate immunity at the cellular level (21, 22). The objective of this paper is to compare the innate immune profiles of ICs, PCs, and proximal tubule cells (PTCs) using a panel of candidate genes.
MATERIALS AND METHODS
Mice.
The Institutional Animal Care and Use Committee at Nationwide Children’s Hospital approved murine research (Protocol AR12-00035). All animal experiments adhered to the National Institutes of Health Guide for the Care and Use of Laboratory Animals. For isolation of collecting duct ICs and PCs, two reporter mice lines were generated. For PCs, AQP2-cre [B6.Cg-Tg(Aqp2-cre)1Dek/J; stock no. 006881; Jackson Laboratory]; for ICs, V-ATPase B1-cre transgenic mice (kindly provided by Raoul D. Nelson, University of Utah) (in which a 7-kb B1 promoter drives the cre expression in ICs) were crossed to tdTomato-loxp homozygous mice [B6.Cg-Gt(ROSA)26Sortm9(CAG-tdtomato)Hze/J (stock no.007909; Jackson Laboratory)], tdTomato expression in these mice is silent before cre recombination. The resultant pups (1st generation) were genotyped by tail DNA PCR for the presence of AQP2-cre transgene using these primer sets: Tg forward:CTCTGCAGGACGGTGCTGG and Tg reverse: GCGAACATCTTCAGG TTCTGCGG; internal control forward: CTAGGCCACAGAATTGAAAGATCT and internal control reverse: GTAGGTGGAAATTCTAGCATCATCC. VATPase B1-Cre pups were genotyped for the presence of Cre transgene using these primer sets: forward: CATTACCGGTCGATGCAACGAG and reverse: TGCCCCTGTTTCACTATCCAGG. tdTomato gene was confirmed in pups by these primer sets: wild-type (WT) forward: AAGGGAGCTGCAGTGGAGTA and WT reverse: CCGAAAATCTGTGGGAAGTC; mutant forward: CTGTTCCTGTACGGCATGG and mutant reverse: GGCATTAAAGCAGCGTATCC. The WT PCR product was ~297 bp, and the mutant PCR product was ~196 bp. For PTC sort, WT C57BL/6 mice (stock no.000664; Jackson Laboratory) were used.
Flow sorting of renal ICs, PCs, and PTCs.
Kidney single cell suspension was prepared from Aqp2-Cre+tdT+/− mice to enrich PCs, V-ATPase-Cre+tdT+/− mice to enrich ICs, and WT C57BL/6 mice to enrich PTCs. To prepare single cell suspension, kidneys were harvested in cold PBS and immediately transferred to Accumax solution (cat. no. AM-105; Innovative Cell Technologies) placed in C tubes (Miltenyi Biotec, Auburn, CA). Cells were disrupted to single cell suspension using gentleMACS dissociator (Miltenyi Biotec). Cell suspension was incubated on a gentle rocker for 10 min at room temperature. Cells were mixed up and down several times, passed through a 70-µm filter to remove debris, and then centrifuged to a pellet. Red blood cells were lysed with lysis buffer (Biolegend, San Diego, CA) and washed with RPMI media. After cell counting, cells were incubated with fixable viability dye eFluor 455UV (cat. no. 65-0868; eBiosciences, San Diego, CA) to eliminate dead cells. More than 99% of single cell suspension cells were found to be negative for this dye (data not shown). Because resident and infiltrated immune cells likely have high expression of innate immune genes, they were separated from kidney epithelial cells by incubation with anti-mouse CD45 conjugated to allophycocyanin flurochrome (cat. no. 17-0451; clone 30-F-11; eBiosciences) for 30 min at 4°C before cell sorting.
For the PTC sort, single cell suspensions from WT C57BL/6 mice were incubated with anti-mouse prominin-1 conjugated to PE antibody (CD133-PE; cat. no. 130-102-834; clone: MB9-3G8; Miltenyi Biotec) at the concentration of 1:200 for 10 min at 4°C (17). Cells were sorted on a BD Influx sorter with a 100-µM tip and sheath pressure set at 27 (BD Biosciene, CA). Viable cells were gated on forward scatter vs. side scatter dot plot followed by gating singlet’s on a forward scatter-H-vs.-pulse width dot plot. Singlets were plotted on a CD45-allophycocyanin vs. sid scatter dot plot. CD45− cells were plotted on a tdTomato vs. SSC dot plot sorting. Both tdTomato-positive cells and tdTomato-negative cells along with CD45+ cells were sorted in a four-way sort. CD45+ cells were identified via a 633 “Red” laser for excitation and a 670/30 bandpass filter for emission. Cells positive for tdTomato were identified via a 561 “Green” laser for excitation and a 585/29 bandpass filter for emission. The flow sorting methodology is presented in Fig. 1G. Postsort purity checks of sorted cells were 100% within the singlet’s gate and yielded average percent purities of 90–95% or greater for all three populations collected.
Fig. 1.

A: enrichment of renal intercalated cells (ICs) by fluorescence-activated cell sorting. Immunofluorescence staining of kidney sections from V-ATPase B1-Cre+/tdT+ (IC reporter) mice with VATPase-E1 antibody to visualize ICs (green) that colocalized with tdTomato (red) and appeared yellow in Cre+ mice (right) and did not colocalize in V-ATPase-Cre−/tdT+ mice (left). B: kidney single cell suspension was stained with anti-mouse CD45-allophycocyanin (APC) antibody to label immune cells. Doublet-negative CD45-negative cells were gated/removed, and tdT+ (high intensity) cells were sorted to separate tdT+ and Tdt− (non-IC). Purity of ≥90% was achieved. FSC, forward scatter; SSC, side scatter. C: enrichment of principal cells (PCs) cells by fluorescence-activated cell sorting. Immunofluorescence staining of kidney sections from Aqp2-Cre+/tdT+ (PC reporter) mice with AQP2 antibody that labels PC (red, left) and anti-red fluorescent protein (RFP)-FITC antibody, which labels tdT+ cells (green, middle) and appeared colocalized (yellow, right). D: kidney cell suspension was stained with anti-mouse CD45-APC antibody and flow sorted for PCs based on tdTomato expression. Cells were size gated on FSC and SSC and then doublet-negative CD45-negative cells were gated. tdT+ were sorted to ≥85% purity. As control, non-PCs cells were sorted. E: enrichment of renal PTCs by fluorescence-activated cell sorting. Single cell suspension prepared from wild-type (WT) C57BL/6 mice was stained with anti-mouse prominin-PE and anti-mouse CD45-APC antibody. Doublet-negative CD45-negative cells were gated, and PTCs (CD133, prominin-1+) (high intensity) were sorted to 90–95% purity. F: direct visualization of sorted tdT+ ICs was consistent with cell singlets. G: schematic of flow sorting procedure.
Reverse transcription and real-time PCR.
Flow enriched ICs, PCs, PTCs, non-ICs, non-PCs, and non-PTCs fractions were pelleted and RNA was prepared using RNeasy micro kit (Qiagen, Valencia, CA) RNA quality was analyzed with RNA picochip on Bioanalyzer (Agilent Technologies, Santa Clara, CA). RNA with RNA integrity number ≥7 was used for cDNA synthesis. RNA was reverse transcribed to prepare cDNA using high-capacity cDNA reverse transcription kit (Applied Biosystems, Foster City, CA). Real-time PCR was performed to measure gene expression for cell-specific markers [V-ATPase (ICs), AQP2 (PCs), and LRP2 (PTCs)] and AMP gene expression (Table 1) using SYBR green chemistry (RT2 SYBR green ROX qPCR master mix; Qiagen) and 7500 Real Time PCR System (Applied Biosystems) (17, 21, 39). Predesigned and validated primer sets were used for AMP and innate immune gene measurement (Sigma, St. Louis, MO) (Table 1). In bacterial stimulation experiments, IC and non-IC cells were incubated with or without uropathogenic Escherichia coli (UPEC) (strain CFT073/ATCC 700928) for 1, 5, and 10 min and AMP gene expression was assessed. Gapdh was used to normalize the target gene expression (RealTime Primers, Elkins Park, PA) (Table 1). The ΔΔCT method was used to calculate relative gene expression and 2−ΔΔCT values obtained were plotted (18). Data are presented as means ± SE from six to eight reporter mice. Fold change measurements of AMP mRNA expression in vitro IC and PC sorted cells exposed to UPEC were determined by calculating dCT values for each data point (dCT gene-dCT Gapdh) and then obtaining ΔΔCT values using non-ICs or non-PCs as internal normalizer to calculate 2−ΔΔCT for each data point. Fold change was then calculated by dividing 2−ΔΔCT values in UPEC to 2−ΔΔCT values in saline for three individual experiment and is presented as mean fold change ± SE in the graph.
Table 1.
Sequences of mouse primer pairs used in reverse transcription-polymerase chain reaction
| Gene | Primer (5′–3′) |
|---|---|
| Gapdh | |
| Forward | CTGGAGAAACCTGCCAAGTA |
| Reverse | TGTTGCTGTAGCCGTATTCA |
| Aqp2 | |
| Forward | ACCTCCTTGGGATCTATTTC |
| Reverse | GTAGTTGTAGAGGAGGGAAC |
| Atp6v1b1 | |
| Forward | CCCTACGATTGAGCGGATCAT |
| Reverse | TATATCCAGGAAAGCCACGGC |
| Lrp2 | CTGTGAAAGTAACCAACGTC |
| Defa5 | |
| Forward | GCTCAACAATTCTCCAGGTGACCC |
| Reverse | AGCAGACCCTTCTTGGCCTC |
| Defb1 | |
| Forward | CATTACTTTCTCCTGGTGATG |
| Reverse | TTACAACAGTTGGGCTTATC |
| Defb26 | |
| Forward | ACCACACCTATCTATTCCTG |
| Reverse | GGTGTTCATATCCCAGAAAC |
| RNase 4 | |
| Forward | AAGATCCTTAGATAGGTTCTCC |
| Reverse | CATCATTACCTAGAAAGTGCC |
| Rnase6 | |
| Forward | CAAAATATTCTGAGCCTGGG |
| Reverse | GTCTACCACCATGTTTTCTG |
| Rnase12 | |
| Forward | CTGCAACTACATGATTCTCC |
| Reverse | TGCAAACTCTGTTGATCTTC |
| Camp | Qiagen Cat. No. PPM25023A-200 |
| Lcn2 | Qiagen Cat. No. PPM03770A-200 |
| S100a8 | |
| Forward | ATGCCCTCTACAAGAATGAC |
| Reverse | TTATCACCATCGCAAGGAAC |
| Slc4a1 | |
| Forward | CATGACAGAAAGAGTGTTCC |
| Reverse | AGGTTAAGCAGAGCTTTTTC |
| Slc26a4 | |
| Forward | ATCCTCTCCATTATCTACACAC |
| Reverse | GTTCCTTAACAGCCATACAG |
UPEC infection.
Female IC and PC reporter mice were transurethrally inoculated with uropathogenic E. coli (UPEC strain CFT073) at a dose of 1 × 10⁸ colony forming units as described previously (13). One hour later, mice were killed, IC and PCs were flow sorted, and AMP mRNA was measured.
Immunofluorescence staining of AMPs in ICs and PCs.
Kidneys were fixed in 4% paraformaldehyde for 24 h and then embedded in paraffin. Four-micrometer sections were cut and slides were deparafinized in three sequential dips in xylene (3 min each). After rehydration steps in serial 100, 90, 70, and 50% ethanol (3 min each), sections were washed in PBS for 5 min and then permeabilized in PBS containing 0.1% Triton X-100 for 5 min. Antigen retrieval was performed with Tris-EDTA at pH of 9.0 for 10 min. After being washed in PBS, sections were blocked with super block (Scytek laboratory, Logan, UT) for 5 min at room temp. Primary antibodies against mouse aquaporin2 (AQP2) to detect PC (cat. no. SC-9882; Santa Cruz Biotechnology, Santa Cruz, CA) (1:200) and V-ATPaseE1 (cat. no. GW22284F; Sigma) to detect IC (1:500) were incubated overnight at 4°C. Cy3-conjugated donkey anti-goat IgG (1:600) secondary antibody was used to detect AQP2, and Cy3-conjugated anti-chicken IgG (1:600) secondary antibody was used to detect V-ATPase E1. For Defb1 immunostaining, rabbit polyclonal antibody to human beta-defensin 1 was used (cat. no. AB-14421; Abcam, Cambridge, MA), and for anti-human, cathelicidin (Camp) antibody was used (cat. no. AB-69484; Abcam). All secondary antibodies were purchased from Jackson Immunoresearch (West Grove, PA). Sections were visualized under Keyence BZ 9000 microscope (Keyence, Itasca, IL). Images were processed with Keyence BZII analyzer, Adobe Photoshop, and/or GIMP software. The brightness and contrast were adjusted to allow final images to match what is seen with the microscope.
Defb1 mRNA in situ hybridization.
Defb1 mRNA was visualized in 4-μm paraffin-embedded mouse kidney sections using the QuantiGene ViewRNA ISH Tissue Assay according to the manufacturer’s protocol (Affymetrix, Santa Clara, CA). Prehybridization conditions were optimized with 5 min of incubation in pretreatment solution (90°C) and 5 min of treatment with protease QF (40°C). Sections were hybridized for 3 h (40°C) with a viewRNA Probe Set designed against the Defb1 mRNA. The probes were then amplified (PreAmplifier and Amplifier molecules), conjugated to alkaline phosphatase (Label Probe 1-AP), and bound with Fast Red Substrate. Finally, sections were counterstained with hematoxylin and imaged with the EVOS FL Auto Cell Imaging System (Life Technologies, Grand Island, NY). In situ-hybridized slides were incubated with anti-mouse V-ATPase-E1 antibody (Sigma) for 90 min at room temperature and then incubated with anti-chicken AF488 IgG secondary antibody (Jackson Immunoresearch) and mounted with DAPI nuclear stain (Vector Laboratory). The V-ATPaseE1 subunit, like the B1 subunit, is specific for ICs in murine kidneys (35). Slides were visualized under Keyence microscope.
Data analysis.
Targeted PCR data were analyzed, and graphs were prepared using Graph Pad Prism. Differences between groups were compared with unpaired t-test (2 groups) unless ratios were compared in which case the ratio-paired t-test was used. Significance was assigned for P < 0.05.
RESULTS
Mouse renal ICs, PCs, and PTCs can be enriched by flow sorting.
To study collecting duct cell-specific innate immune gene profiles we generated two reporter mice. ICs and PCs were fluorescently labeled in V-ATPase-Cre+tdT+ and AQP2-Cre+tdT+ mice, respectively. These mice expressed tandem dimer tomato (tdT), a red fluorescent protein, on the target cell type, and enrichment to >80–95% was obtained for ICs (Fig. 1, A and B), PCs (Fig. 1, C and D), and PTCs (Fig. 1E). The accuracy of the flow sorting for cell singlets was evaluated by direct visualization of a subset of sorted ICs (Fig. 1F). The flow-sorted cells were also found to be 100% within the singlets gate (data not shown). Figure 1G represents a schematic of the flow sorting procedure.
Targeted enrichment was confirmed by expression of lineage-specific markers. Specifically, a 177-fold increase in Atp6v1b1 (the gene that expresses the β1-form of V-ATPase predominant in ICs) mRNA expression was present in sorted ICs [tdT(+) vs. tdT(−) cells] (Fig. 2, A and B). A 3,523-fold increase in Aqp2 mRNA expression was present in sorted PCs [tdT(+) vs. tdT(−) cells] (Fig. 2, C and D). A sixfold increase in Lrp2 (the gene that encodes for megalin, a PTC marker) was identified in sorted PTCs [prominin(+) vs. prominin(−) cells; Fig. 2, E and F]. The cell type marker mRNA relative expression in sorted cells vs. whole kidney lysate from another group of mice is presented in Fig. 3, A–C. Although the targeted cells were highly enriched, 100% purity was not present. The ratio of Aqp2/Atp6v1b1 was 20:1 in the sorted PCs while the ratio of Atp6v1b1/Aqp2 was 3:1 in sorted ICs (Fig. 3D). To further confirm the purity of the sorted population, Slc4a1 [anion exchanger 1 (AE1), an α-IC marker)] and Scnn1a (epithelial sodium channel, a PC marker) mRNA levels were measured. ICs expressed 2,400-fold higher Slc4a1 (Fig. 3E), and PCs expressed 107-fold higher Scnn1a mRNA expression (Fig. 3F).
Fig. 2.

Atp6v1b1 expression was increased (A) and Lrp2 expression decreased (B) in the sorted IC compared with the non-IC (NIC) fraction. The PC-enriched fraction demonstrated increased Aqp2 (C) and lower Lrp2 (D) expression compared with the non-PC fraction (NPC). Prominin-1hi-sorted cells (presumed PTCs; E) had higher Lrp2 mRNA expression than non-PTCs (NPTCs; F) and were devoid of Atp6v1b1 or Aqp2 mRNA expression. Data are presented here as means ± SE of 5–6 individual reporter mice.
Fig. 3.

A comparison of Atp6v1b1 (A), Aqp2 (B), and Lrp2 (C) mRNA expression in whole kidney cell lysate (WKL) to enriched ICs, PCs, and PTCs. D: although ICs were enriched for Atp6v1b1 and PCs were enriched for Aqp2, there was some Aqp2 expression in ICs and Atp6v1b1 expression in PCs. The Aqp2/Atp6v1b1 ratio was higher in enriched PCs than the Atp6v1b1/Aqp2 ratio in ICs. E: Slc4a1 (anion exchanger 1), the gene that encodes α-IC marker, was enriched in ICs while Scnn1a (F), the gene that encodes the α subunit of the epithelial sodium channel epithelial sodium channel, was enriched in PCs.
Renal ICs and PCs express AMP mRNA.
Because the urinary tract is in close proximity to the microbiota and the collecting duct would be the first renal tubular segment encountered by ascending microbes, we sought to determine if collecting duct cells express AMP. Targeted RT-PCR assays of enriched cell populations (ICs, PCs, and PTCs) were performed for transcripts encoding defensins (Fig. 4), ribonucleases (Fig. 5), along with cathelicidin (Camp) and the nutrient metal binding proteins Calgranulin A (S100a8) and Lipocalin 2 (Lcn2) (Fig. 6). ICs had significantly higher Defb1, Defb26 and Rnase4 expression and had a trend toward increasing levels of Camp, Lcn2, S100a8, Rnase6, and Rnase12 compared with non-IC fractions. PCs were enriched only in Defb1 and Rnase4 compared with non-PC (NPC) fractions, and PTCs were relatively devoid of AMPs In situ hybridization for Defb1 RNA and dual labeling with V-ATPase protein (to localize the collecting duct) confirmed Defb1 mRNA in both ICs and PCs (Fig. 7). Since the tdTomato negative flow through contains renal cells, not of collecting duct origin, direct comparison of IC and PC AMP expression was attempted. To do this, sorted IC and PC cells, isolated on the same day but from different mice, were analyzed simultaneously by qRT-PCR. IC AMP mRNA was normalized to PCs rather non-ICs or non-PCs. Defb1 and Rnase4 gene expression levels were measured. No significant differences were found in Defb1 (P = 0.4) and Rnase 4 (P = 0.24) mRNA expression between ICs and PCs with a nonsignificant trend toward higher Defb1 in PCs and higher Rnase 4 in ICs (data not shown).
Fig. 4.

Defa5 (also referred to as Defcr5) (A, D, and G), Defb1 (B, E, and H), and Defb26 (C, F, and I) expression was evaluated in ICs (A–C), PCs (D–F), or PTCs (G–I). Defensin mRNA expression varied by cell type. ICs had higher Defb1 (*P < 0.001) and Defb26 (*P < 0.05) expression than non-ICs. PCs were selectively enriched for Defb1 compared with the non-PC (NPC) cell fraction. mRNA expression was not relatively increased for any of the defensin genes in PTCs compared with non-PTCs (NPTCs). Data are presented here as means ± SE of 5–6 individual reporter mice.
Fig. 5.

RNase4 (A, D, and G), RNase6 (B, E, and H), and RNase12 (C, F, and I) expression was evaluated in enriched ICs (A–C), PCs (D–F), or PTCs (G–I). ICs and PCs had increased Rnase4 expression compared with non-ICs (NIC) and non-PCs (NPC), respectively. None of the other tested ribonucleases were relatively increased in ICs, PCs, or PTCs. Data are presented here as means ± SE of 5–6 individual reporter mice.
Fig. 6.

Camp (A, D, and G) along with nutrient metal binding proteins Lcn2 (B, E, and H) and S100a8 (C, F, and I) expression were not increased in ICs (A–C), PCs (D–F), or PTCs (G–I). However, there was a nonsignificant trend for increased expression in ICs compared with NICs 3.4-, 5.8-, and 12.3-fold mean increases for Camp, Lcn2, and S100A8, respectively. Data are presented here as means ± SE of 5–6 individual reporter mice.
Fig. 7.
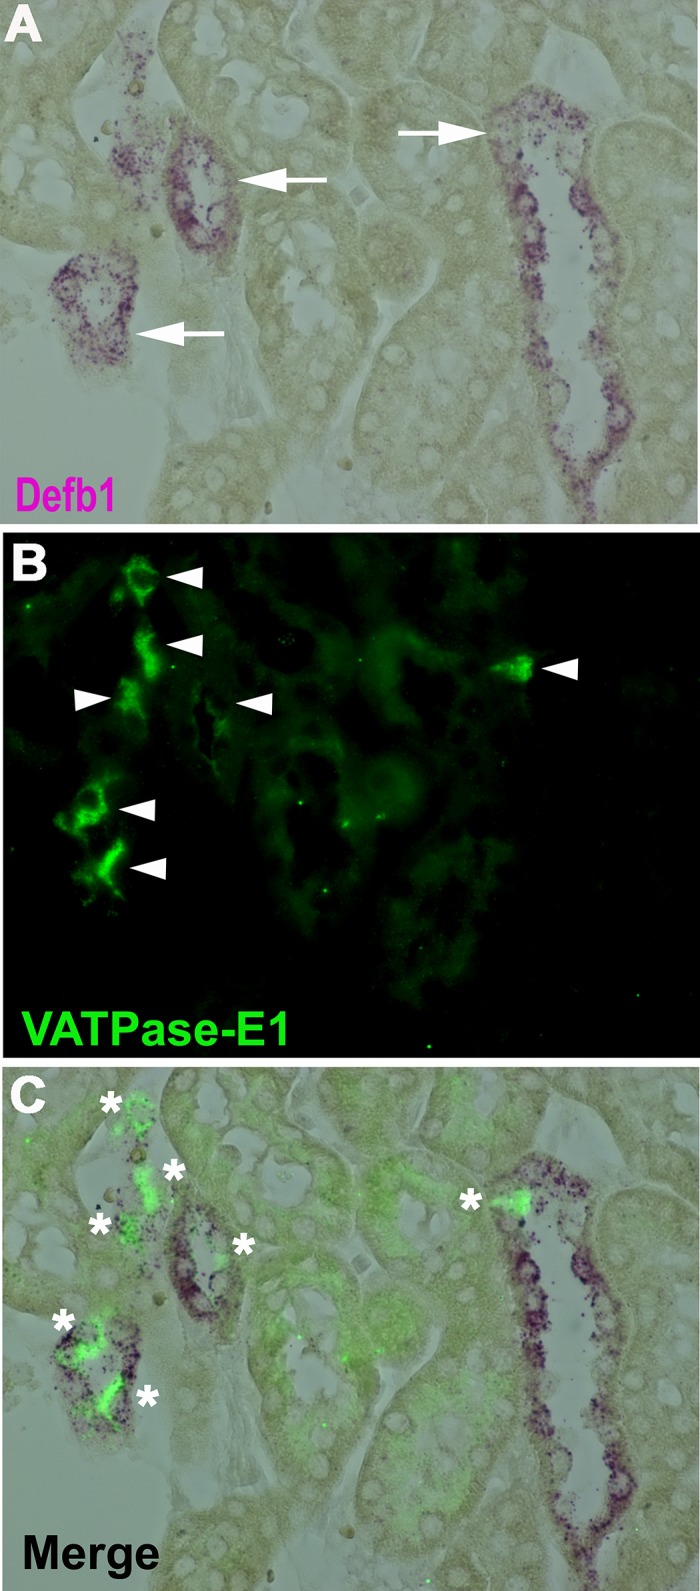
Defb1 RNA in situ hybridization on wild-type C57BL/6 kidney section showing expression of Defb1 (purple, arrows; A) and VATPase-E1 antibody (green, arrowhead; B). C: overlay. *Cells positive for both VATPase (green) and Defb1 (purple). Magnification: ×60.
Immunofluorescence demonstrated AMP expression in the murine collecting duct.
Immunostaining was performed for Defb1 and Camp proteins (Fig. 8). Renal protein expression of all AMPs appeared to be largely limited to the collecting duct, consistent with mRNA profiles. We identified Defb1 expression in both ICs and PCs, consistent with mRNA expression. However, predominant Defb1 protein immunostaining expression was identified in PCs. Camp immunostaining was most frequently identified in ICs. Defb1 and Camp images were obtained from mice 1 h postinfection.
Fig. 8.

Immunofluorescent labeling of murine AMPs. Defb1 (red; A and B) and Camp (red; C and D) colabeled with VATPase-E1 (green) Aqp2 (green) to localize collecting duct PCs and ICs respectively. Left: AMP expression (red). Middle: collecting duct markers (Aqp2 and VATPase-E1). Right: merged images. A: arrowheads show Defb1-positive, VATPase-E1-negative cells. An occasional IC also has red Defb1 staining (arrow). B: most PCs also expressed Defb1 (arrows), but an occasional PC was negative for Defb1 (*). C: Camp colocalized with VATPase-E1 (arrows). D: most cells that immunostained for CAMP were negative for Aqp2 (arrows). Magnification: ×60, DAPI-blue.
Renal ICs respond to UPEC challenge in vitro.
ICs and PCs were exposed to media with and without UPEC and investigated at 1, 5, and 10 min based on previously described time points for evaluation of AMP expression in cells evaluated in vitro (6). At 5 min, UPEC-exposed ICs had higher Rnase4 expression and trended toward higher Defb1 and Camp expression at 5 and 10 min (Fig. 9, A–C). UPEC-exposed PCs had decreased AMP expression at multiple time points (Fig. 9, D–F).
Fig. 9.

Fold change of mRNA expression (uropathogenic Escherichia coli-inoculated media over cells in media alone) in ICs vs. non-ICs and PCs vs. non-PCs. Time points of 1, 5, and 10 min were evaluated. A: Rnase4 expression was higher in ICs compared with non-IC at 5 min. B: Defb1 trended higher in IC compared with non-IC at 5 min but did not reach significance, P = 0.12. C: Camp trended higher at 5 and 10 min in ICs compared with non-ICs but did not reach significant, P = 0.09 for both time points. PCs decreased in Rnase4 at all 3 time points (A), in Defb1 at 1 and 10 min (B), and Camp at 1 and 5 min. D: Rnase4 expression was decreased in PCs. E: Defb1 expression was decreased in PCs. F: Camp expression was decreased in PCs. Data are presented as means fold change ± SE of 3 individual experiment. Each experiment had 3–4 reporter mice for sorting ICs and PCs.
ICs and PCs respond to UPEC exposure in vivo.
To identify changes in collecting duct innate immune gene expression following UPEC challenge, mice were euthanized 1 h following transurethral instillation of UPEC or saline control, and Defb1 and Rnase4 expression levels were measured in flow-sorted ICs and PCs. While kidney homogenates at this time point lack bacterial growth on culture, sorted ICs and PCs both exhibited significant induction of Defb1 in response to experimental urinary tract infection (Fig. 10). Rnase4 levels were not significantly changed.
Fig. 10.

One hour following transurethral UPEC inoculation, Defb1 expression was significantly higher in ICs (A) and PCs (B) compared with saline control. Rnase4 expression trended higher in both ICs (C) and PCs (D) but did not reach significance; n = 8–11 reporter mice in each group. Data are presented as means ± SE of relative mRNA expression.
DISCUSSION
Because the kidney is complex and heterogeneous containing a diverse variety of cell types, use of whole kidney homogenates can make interpretation of mRNA or proteomic analysis difficult. Furthermore, some cells are present in relatively small percentages resulting in an increased likelihood that any cell-specific mRNA or protein expression will be diluted out by more numerous cell types. For instance, ICs only account for ~1–2% of murine kidney cells (13). We developed methodology for isolation and analysis of enriched collecting duct cell populations and then determined the innate antimicrobial immune phenotype of the collecting duct cells. To our knowledge, this study is the first report of isolating both murine ICs and PCs and evaluating their antimicobial immune gene expression. Although we focused on innate immunity, this approach may benefit study of other collecting duct cell functions such as maintenance of acid-base homeostasis and fluid balance.
Using a targeted PCR approach, we were able to identify differential AMP levels among renal ICs, PCs, and PTCs. PTCs were mostly devoid of AMP or nutrient metal-sequestering protein mRNA expression. Defb1 was relatively highly expressed by PCs and multiple AMPs including Rnase4, Defb1, and Defb26 were relatively highly expressed in ICs. High AMP expression in the collecting duct, particularly ICs with lower expression levels in the PTCs, makes conceptual sense because the collecting duct cells would be initial cells to encounter an ascending pathogen. This expression pattern is also consistent with what we previously described in the human kidney (29–32).
When stimulated by UPEC in vivo, both PCs and ICs significantly upregulate Defb1 expression, despite the culture negative status of the kidneys. This finding is similar to what was described by Paragas et al. (24) and indicates that bladder-collecting duct crosstalk may play a role in the UTI defense. The rapid renal innate immune response in vitro to bacteria is also consistent with what Chromek et al. (6) reported regarding Cramp expression in renal epithelial cells 5 min following UPEC stimulation. It may also suggest that AMP expression is tightly regulated at transcriptional level. In vivo both ICs and PCs appear to respond to bacterial infections, while in our in vitro studies the response is limited to ICs. In vivo studies are likely more biologically relevant to disease because the tubular structure in vivo may limit initial exposure of bacteria to the luminal surface and interactions among ICs, PCs, myeloid immune cells, and/or the basement membrane may influence gene transcription. The approximately twofold increase in AMP expression seen in ICs in our in vivo and in vitro infections is consistent to what has been described for other AMPs, for instance, LL-37 (cathelicidin) mRNA increases approximately two- to threefold in response to LPS, mycobacterium tuberculosis, and mycobacterium tuberculosis DNA in human alveolar macrophages (27). Possible explanations for the finding that ICs increase AMP transcription following bacteria exposure in vitro and in vivo while PCs increase AMP transcription only in vivo indicate that PCs include the need for PCs to interactions with other cells and/or posttranslational modifications. Also, the AMP response may vary between different species and strains of bacteria. For the purpose of this study, we have used UPEC strain CFT-073, but future experiments could expand to other strains, species, and bacterial toxins such as LPS.
Aqp2 expression was present in both enriched ICs and PCs, however, the Aqp2/Atp6v1b1 ratio was higher in enriched PCs. A likely explanation for Aqp2 expression in sorted ICs cells is the finding reported by Miller et al. (20, 21) that in the V-ATPase Cre mouse, Cre is not active in PCs of cortex or medulla, but is in 50% of the PCs in the connecting tubule. Alternatively PC contamination from incomplete dissociation of collecting tubule cell tight junctions is another possibility. However, we gated out doublets during flow sorting and did not identify cell doublets by direct visualization. Double labeling to determine if individual cells expressing both V-ATPase and Aqp2 was not feasible with our flow sorting methodology. It is possible that some Aqp2 is expressed by ICs at the mRNA level but not the protein level and resulting in collecting duct cell subtypes not being as distinct at the mRNA level as they are at the protein level. For instance, ICs are derived from Aqp2-expressing cells and Aqp2-expressing cells can convert into ICs in response to potassium depletion (15, 37). Conversely in culture, ICs have been reported to convert into PCs (8).
Expression of mRNA may be variable depending on the underlying physiology at the time of sample collection, and expression per cell may be very different between cell type markers. We have previously shown that expression of Galectin 3, an innate immune protein is expressed by some, but not all ICs and PCs, and therefore does not clearly segregate to a collecting duct cell type (26, 28). This aforementioned mixed expression by ICs and PCs was seen with Defb1 in this study. Although many distinctions and similarities between IC and PC expression patterns remain to be determined, our enriched PCs and/or ICs lend insight into collecting duct-specific innate immune function. Additionally, some distinct patterns were present between enriched IC and PC expression patterns and response to bacterial stimulation. This lack of completely distinct IC vs. PC phenotypes is also represented by differences between mRNA and protein expression. For instance, Defb1 is expressed comparably on the mRNA level in ICs and PCs, but subjective expression on immunolabeling of Defb1 protein appears to be identified more consistently in PCs.
The results of this study lead to a range of future directions. First, differences between ICs subtypes or by different kidney region could be analyzed. For instance, renal ICs can be subdivided into α-, β- and non-α-, non-β-subtypes that are structurally and functionally distinct (34). Additionally, differential expression patterns between collecting duct cells of the cortex, outer medulla, and inner medulla have been previously described (16, 28). Second, although we were able to obtain enriched populations of ICs and PCs, we cannot confirm absolute purity of our sorted cells. Thus there may be some overlap between expression patterns that will be clarified in future studies developing single cell genomics technology. Third, direct comparison between ICs and PCs is difficult at present, because we are not able to isolate both cell types from the same mice; in the future we plan to make a double fluorescent reporter mouse that would tag IC and PC cells at the same time allowing isolation and optimal direct comparison. Fourth, expanding our targeted approach to an unbiased RNA-seq approach may identify key innate immune genes and pathway. Lastly, dissociation of cells may lead to gene expression profile changes, and technologies such as laser capture or RNA labeling to determine native state expression would be alternate strategies to identify the IC transcriptome.
In conclusion, we report the isolation of enriched IC, PC and PTCs to more completely and accurately determine the renal innate immune defense with an emphasis on the collecting duct. Collecting duct cells are AMP rich compared with non-ICs, and/or non-PCs and PTCs are mostly devoid of AMP expression. UPEC-stimulated ICs have higher AMP expression in vitro and in vivo than non UPEC-stimulated ICs.
GRANTS
This study was supported by National Institute of Diabetes and Digestive and Kidney Diseases Grant R01-DK-106286.
DISCLOSURES
L. Schwaderer has consulted for Allena Pharmaceuticals.
AUTHOR CONTRIBUTIONS
V.S., J.K., M.C., and K.R.P. performed experiments; V.S., D.S.H., J.K., J.D.S., B.B., K.R.P., J.M.P., G.J.S., and A.L.S. analyzed data; V.S., D.S.H., G.J.S., and A.L.S. interpreted results of experiments; V.S. and A.L.S. prepared figures; V.S., D.S.H., and A.L.S. drafted manuscript; V.S., D.S.H., J.K., J.D.S., B.B., R.D.N., J.M.P., G.J.S., and A.L.S. edited and revised manuscript; V.S., D.S.H., J.K., M.C., J.D.S., B.B., K.R.P., R.D.N., J.M.P., G.J.S., and A.L.S. approved final version of manuscript.
ACKNOWLEDGMENTS
We acknowledge Dave Dunaway from the Flow Cytometry Core for assistance with flow sorting.
REFERENCES
- 1.Aguila A, Herrera AG, Morrison D, Cosgrove B, Perojo A, Montesinos I, Pérez J, Sierra G, Gemmell CG, Brock JH. Bacteriostatic activity of human lactoferrin against Staphylococcus aureus is a function of its iron-binding properties and is not influenced by antibiotic resistance. FEMS Immunol Med Microbiol 31: 145–152, 2001. doi: 10.1111/j.1574-695X.2001.tb00511.x. [DOI] [PubMed] [Google Scholar]
- 2.Andersen O, Friis P, Holm Nielsen E, Vilsgaard K, Leslie RG, Svehag SE. Purification, subunit characterization and ultrastructure of three soluble bovine lectins: conglutinin, mannose-binding protein and the pentraxin serum amyloid P-component. Scand J Immunol 36: 131–141, 1992. doi: 10.1111/j.1365-3083.1992.tb02949.x. [DOI] [PubMed] [Google Scholar]
- 3.Azroyan A, Cortez-Retamozo V, Bouley R, Liberman R, Ruan YC, Kiselev E, Jacobson KA, Pittet MJ, Brown D, Breton S. Renal intercalated cells sense and mediate inflammation via the P2Y14 receptor. PLoS One 10: e0121419, 2015. doi: 10.1371/journal.pone.0121419. [DOI] [PMC free article] [PubMed] [Google Scholar]
- 4.Brown D, Hirsch S, Gluck S. An H+-ATPase in opposite plasma membrane domains in kidney epithelial cell subpopulations. Nature 331: 622–624, 1988. doi: 10.1038/331622a0. [DOI] [PubMed] [Google Scholar]
- 5.Chassin C, Goujon JM, Darche S, du Merle L, Bens M, Cluzeaud F, Werts C, Ogier-Denis E, Le Bouguénec C, Buzoni-Gatel D, Vandewalle A. Renal collecting duct epithelial cells react to pyelonephritis-associated Escherichia coli by activating distinct TLR4-dependent and -independent inflammatory pathways. J Immunol 177: 4773–4784, 2006. doi: 10.4049/jimmunol.177.7.4773. [DOI] [PubMed] [Google Scholar]
- 6.Chromek M, Slamová Z, Bergman P, Kovács L, Podracká L, Ehrén I, Hökfelt T, Gudmundsson GH, Gallo RL, Agerberth B, Brauner A. The antimicrobial peptide cathelicidin protects the urinary tract against invasive bacterial infection. Nat Med 12: 636–641, 2006. doi: 10.1038/nm1407. [DOI] [PubMed] [Google Scholar]
- 7.Chung AW, Sieling PA, Schenk M, Teles RM, Krutzik SR, Hsu DK, Liu FT, Sarno EN, Rea TH, Stenger S, Modlin RL, Lee DJ. Galectin-3 regulates the innate immune response of human monocytes. J Infect Dis 207: 947–956, 2013. doi: 10.1093/infdis/jis920. [DOI] [PMC free article] [PubMed] [Google Scholar]
- 8.Fejes-Tóth G, Náray-Fejes-Tóth A. Differentiation of renal beta-intercalated cells to alpha-intercalated and principal cells in culture. Proc Natl Acad Sci USA 89: 5487–5491, 1992. doi: 10.1073/pnas.89.12.5487. [DOI] [PMC free article] [PubMed] [Google Scholar]
- 9.Frendéus B, Godaly G, Hang L, Karpman D, Lundstedt AC, Svanborg C. Interleukin 8 receptor deficiency confers susceptibility to acute experimental pyelonephritis and may have a human counterpart. J Exp Med 192: 881–890, 2000. doi: 10.1084/jem.192.6.881. [DOI] [PMC free article] [PubMed] [Google Scholar]
- 10.Gauer S, Sichler O, Obermüller N, Holzmann Y, Kiss E, Sobkowiak E, Pfeilschifter J, Geiger H, Mühl H, Hauser IA. IL-18 is expressed in the intercalated cell of human kidney. Kidney Int 72: 1081–1087, 2007. doi: 10.1038/sj.ki.5002473. [DOI] [PubMed] [Google Scholar]
- 11.Goetz DH, Holmes MA, Borregaard N, Bluhm ME, Raymond KN, Strong RK. The neutrophil lipocalin NGAL is a bacteriostatic agent that interferes with siderophore-mediated iron acquisition. Mol Cell 10: 1033–1043, 2002. doi: 10.1016/S1097-2765(02)00708-6. [DOI] [PubMed] [Google Scholar]
- 12.Hagberg L, Hull R, Hull S, McGhee JR, Michalek SM, Svanborg Edén C. Difference in susceptibility to gram-negative urinary tract infection between C3H/HeJ and C3H/HeN mice. Infect Immun 46: 839–844, 1984. [DOI] [PMC free article] [PubMed] [Google Scholar]
- 13.Hains DS, Chen X, Saxena V, Barr-Beare E, Flemming W, Easterling R, Becknell B, Schwartz GJ, Schwaderer AL. Carbonic anhydrase 2 deficiency leads to increased pyelonephritis susceptibility. Am J Physiol Renal Physiol 307: F869–F880, 2014. doi: 10.1152/ajprenal.00344.2014. [DOI] [PMC free article] [PubMed] [Google Scholar]
- 14.Hasler U, Mordasini D, Bens M, Bianchi M, Cluzeaud F, Rousselot M, Vandewalle A, Feraille E, Martin PY. Long term regulation of aquaporin-2 expression in vasopressin-responsive renal collecting duct principal cells. J Biol Chem 277: 10379–10386, 2002. doi: 10.1074/jbc.M111880200. [DOI] [PubMed] [Google Scholar]
- 15.Kim WY, Nam SA, Choi A, Kim YM, Park SH, Kim YK, Kim J. Aquaporin 2-labeled cells differentiate to intercalated cells in response to potassium depletion. Histochem Cell Biol 145: 17–24, 2016. doi: 10.1007/s00418-015-1372-9. [DOI] [PubMed] [Google Scholar]
- 16.Lee JW, Chou CL, Knepper MA. Deep Sequencing in Microdissected Renal Tubules Identifies Nephron Segment-Specific Transcriptomes. J Am Soc Nephrol 26: 2669–2677, 2015. doi: 10.1681/ASN.2014111067. [DOI] [PMC free article] [PubMed] [Google Scholar]
- 17.Legouis D, Bataille A, Hertig A, Vandermeersch S, Simon N, Rondeau E, Galichon P. Ex vivo analysis of renal proximal tubular cells. BMC Cell Biol 16: 12, 2015. doi: 10.1186/s12860-015-0058-4. [DOI] [PMC free article] [PubMed] [Google Scholar]
- 18.Livak KJ, Schmittgen TD. Analysis of relative gene expression data using real-time quantitative PCR and the 2(-delta C(T)) method. Methods 25: 402–408, 2001. doi: 10.1006/meth.2001.1262. [DOI] [PubMed] [Google Scholar]
- 19.Lusitani D, Malawista SE, Montgomery RR. Calprotectin, an abundant cytosolic protein from human polymorphonuclear leukocytes, inhibits the growth of Borrelia burgdorferi. Infect Immun 71: 4711–4716, 2003. doi: 10.1128/IAI.71.8.4711-4716.2003. [DOI] [PMC free article] [PubMed] [Google Scholar]
- 20.Miller RL, Lucero OM, Riemondy KA, Baumgartner BK, Brown D, Breton S, Nelson RD. The V-ATPase B1-subunit promoter drives expression of Cre recombinase in intercalated cells of the kidney. Kidney Int 75: 435–439, 2009. doi: 10.1038/ki.2008.569. [DOI] [PMC free article] [PubMed] [Google Scholar]
- 21.Miller RL, Zhang P, Smith M, Beaulieu V, Paunescu TG, Brown D, Breton S, Nelson RD. V-ATPase B1-subunit promoter drives expression of EGFP in intercalated cells of kidney, clear cells of epididymis and airway cells of lung in transgenic mice. Am J Physiol Cell Physiol 288: C1134–C1144, 2005. doi: 10.1152/ajpcell.00084.2004. [DOI] [PubMed] [Google Scholar]
- 22.Nelson RD, Stricklett P, Gustafson C, Stevens A, Ausiello D, Brown D, Kohan DE. Expression of an AQP2 Cre recombinase transgene in kidney and male reproductive system of transgenic mice. Am J Physiol Cell Physiol 275: C216–C226, 1998. [DOI] [PubMed] [Google Scholar]
- 23.Neth O, Jack DL, Dodds AW, Holzel H, Klein NJ, Turner MW. Mannose-binding lectin binds to a range of clinically relevant microorganisms and promotes complement deposition. Infect Immun 68: 688–693, 2000. doi: 10.1128/IAI.68.2.688-693.2000. [DOI] [PMC free article] [PubMed] [Google Scholar]
- 24.Paragas N, Kulkarni R, Werth M, Schmidt-Ott KM, Forster C, Deng R, Zhang Q, Singer E, Klose AD, Shen TH, Francis KP, Ray S, Vijayakumar S, Seward S, Bovino ME, Xu K, Takabe Y, Amaral FE, Mohan S, Wax R, Corbin K, Sanna-Cherchi S, Mori K, Johnson L, Nickolas T, D’Agati V, Lin CS, Qiu A, Al-Awqati Q, Ratner AJ, Barasch J. α-Intercalated cells defend the urinary system from bacterial infection. J Clin Invest 124: 2963–2976, 2014. doi: 10.1172/JCI71630. [DOI] [PMC free article] [PubMed] [Google Scholar]
- 25.Paragas N, Qiu A, Zhang Q, Samstein B, Deng SX, Schmidt-Ott KM, Viltard M, Yu W, Forster CS, Gong G, Liu Y, Kulkarni R, Mori K, Kalandadze A, Ratner AJ, Devarajan P, Landry DW, D’Agati V, Lin CS, Barasch J. The Ngal reporter mouse detects the response of the kidney to injury in real time. Nat Med 17: 216–222, 2011. doi: 10.1038/nm.2290. [DOI] [PMC free article] [PubMed] [Google Scholar]
- 26.Park AM, Hagiwara S, Hsu DK, Liu FT, Yoshie O. Galectin-3 Plays an Important Role in Innate Immunity to Gastric Infection by Helicobacter pylori. Infect Immun 84: 1184–1193, 2016. doi: 10.1128/IAI.01299-15. [DOI] [PMC free article] [PubMed] [Google Scholar]
- 27.Rivas-Santiago B, Hernandez-Pando R, Carranza C, Juarez E, Contreras JL, Aguilar-Leon D, Torres M, Sada E. Expression of cathelicidin LL-37 during Mycobacterium tuberculosis infection in human alveolar macrophages, monocytes, neutrophils, and epithelial cells. Infect Immun 76: 935–941, 2008. doi: 10.1128/IAI.01218-07. [DOI] [PMC free article] [PubMed] [Google Scholar]
- 28.Schwaderer AL, Vijayakumar S, Al-Awqati Q, Schwartz GJ. Galectin-3 expression is induced in renal beta-intercalated cells during metabolic acidosis. Am J Physiol Renal Physiol 290: F148–F158, 2006. doi: 10.1152/ajprenal.00244.2005. [DOI] [PubMed] [Google Scholar]
- 29.Schwaderer AL, Wang H, Kim S, Kline JM, Liang D, Brophy PD, McHugh KM, Tseng GC, Saxena V, Barr-Beare E, Pierce KR, Shaikh N, Manak JR, Cohen DM, Becknell B, Spencer JD, Baker PB, Yu CY, Hains DS. Polymorphisms in α-defensin-encoding DEFA1A3 associate with urinary tract infection risk in children with vesicoureteral reflux. J Am Soc Nephrol 27: 3175–3186, 2016. doi: 10.1681/ASN.2015060700. [DOI] [PMC free article] [PubMed] [Google Scholar]
- 30.Spencer JD, Hains DS, Porter E, Bevins CL, DiRosario J, Becknell B, Wang H, Schwaderer AL. Human alpha defensin 5 expression in the human kidney and urinary tract. PLoS One 7: e31712, 2012. doi: 10.1371/journal.pone.0031712. [DOI] [PMC free article] [PubMed] [Google Scholar]
- 31.Spencer JD, Schwaderer AL, Dirosario JD, McHugh KM, McGillivary G, Justice SS, Carpenter AR, Baker PB, Harder J, Hains DS. Ribonuclease 7 is a potent antimicrobial peptide within the human urinary tract. Kidney Int 80: 174–180, 2011. doi: 10.1038/ki.2011.109. [DOI] [PubMed] [Google Scholar]
- 32.Spencer JD, Schwaderer AL, Eichler T, Wang H, Kline J, Justice SS, Cohen DM, Hains DS. An endogenous ribonuclease inhibitor regulates the antimicrobial activity of ribonuclease 7 in the human urinary tract. Kidney Int 85: 1179–1191, 2014. doi: 10.1038/ki.2013.395. [DOI] [PMC free article] [PubMed] [Google Scholar]
- 33.Spencer JD, Schwaderer AL, Wang H, Bartz J, Kline J, Eichler T, DeSouza KR, Sims-Lucas S, Baker P, Hains DS. Ribonuclease 7, an antimicrobial peptide upregulated during infection, contributes to microbial defense of the human urinary tract. Kidney Int 83: 615–625, 2013. doi: 10.1038/ki.2012.410. [DOI] [PMC free article] [PubMed] [Google Scholar]
- 34.Teng-umnuay P, Verlander JW, Yuan W, Tisher CC, Madsen KM. Identification of distinct subpopulations of intercalated cells in the mouse collecting duct. J Am Soc Nephrol 7: 260–274, 1996. [DOI] [PubMed] [Google Scholar]
- 35.Vedovelli L, Rothermel JT, Finberg KE, Wagner CA, Azroyan A, Hill E, Breton S, Brown D, Paunescu TG. Altered V-ATPase expression in renal intercalated cells isolated from B1 subunit-deficient mice by fluorescence-activated cell sorting. Am J Physiol Renal Physiol 304: F522–F532, 2013. doi: 10.1152/ajprenal.00394.2012. [DOI] [PMC free article] [PubMed] [Google Scholar]
- 36.Weichhart T, Haidinger M, Hörl WH, Säemann MD. Current concepts of molecular defence mechanisms operative during urinary tract infection. Eur J Clin Invest 38, Suppl 2: 29–38, 2008. doi: 10.1111/j.1365-2362.2008.02006.x. [DOI] [PubMed] [Google Scholar]
- 37.Wu H, Chen L, Zhou Q, Zhang X, Berger S, Bi J, Lewis DE, Xia Y, Zhang W. Aqp2-expressing cells give rise to renal intercalated cells. J Am Soc Nephrol 24: 243–252, 2013. [DOI] [PMC free article] [PubMed] [Google Scholar]
- 38.Zasloff M. Antimicrobial peptides, innate immunity, and the normally sterile urinary tract. J Am Soc Nephrol 18: 2810–2816, 2007. doi: 10.1681/ASN.2007050611. [DOI] [PubMed] [Google Scholar]
- 39.Zharkikh L, Zhu X, Stricklett PK, Kohan DE, Chipman G, Breton S, Brown D, Nelson RD. Renal principal cell-specific expression of green fluorescent protein in transgenic mice. Am J Physiol Renal Physiol 283: F1351–F1364, 2002. doi: 10.1152/ajprenal.0224.2001. [DOI] [PubMed] [Google Scholar]
- 40.Zucht HD, Grabowsky J, Schrader M, Liepke C, Jürgens M, Schulz-Knappe P, Forssmann WG. Human beta-defensin-1: A urinary peptide present in variant molecular forms and its putative functional implication. Eur J Med Res 3: 315–323, 1998. [PubMed] [Google Scholar]