Abstract
The intrarenal ghrelin receptor (GR) is localized to collecting duct (CD) cells, where it increases epithelial Na+ channel (αENaC)-dependent sodium reabsorption in rodents. We hypothesized that chronic GR inhibition with intrarenal GR siRNA lowers blood pressure (BP) in angiotensin II-dependent hypertension via reductions in αENaC-dependent sodium reabsorption. Uninephrectomized Sprague-Dawley rats (n = 121) received subcutaneous osmotic pumps for chronic systemic delivery of angiotensin II or vehicle (5% dextrose in water). Rats also received intrarenal infusion of vehicle, GR siRNA, or scrambled (SCR) siRNA. In rats receiving intrarenal vehicle or intrarenal SCR siRNA, systemic angiotensin II infusion increased sodium retention and BP on day 1, and BP remained elevated throughout the 5-day study. These rats also demonstrated increased CD GR expression after 5 days of infusion. However, intrarenal GR siRNA infusion prevented angiotensin II-mediated sodium retention on day 1, induced a continuously negative cumulative sodium balance compared with angiotensin II alone, and reduced BP chronically. Glomerular filtration rate and renal blood flow remained unchanged in GR siRNA-infused rats. Systemic angiotensin II infusion also increased serum aldosterone levels, CD αENaC, and phosphorylated serum and glucocorticoid-inducible kinase 1 expression in rats with intrarenal SCR siRNA; however, these effects were not observed in the presence of intrarenal GR siRNA, despite exposure to the same systemic angiotensin II. These data demonstrate that chronic inhibition of intrarenal GR activity significantly reduces αENaC-dependent sodium retention, resulting in a negative cumulative sodium balance, thereby ameliorating angiotensin II–induced hypertension in rats. Renal GRs represent a novel therapeutic target for the treatment of hypertension and other sodium-retaining states.
Keywords: blood pressure, collecting duct, kidney, serum and glucocorticoid-inducible kinase 1, sodium channels
INTRODUCTION
The kidneys play a critical role in the control of blood pressure (BP) by regulating sodium (Na+) homeostasis. Under normal conditions, a primary increase in renal Na+ reabsorption expands extracellular fluid volume and increases BP, but this is usually offset by sufficient pressure-induced natriuresis, returning BP toward its baseline level. When the compensatory response is compromised, sustained hypertension can develop, wherein the increase in BP is accompanied by a natriuretic response that is insufficient to lower BP to normal. Selective renal tubule receptor knockout studies have validated the role of the collecting duct (CD) in this process, showing that increased Na+ reabsorption in this segment of the nephron is critical to sustain a hypertensive response to angiotensin II (ANG II) (13). In fact, mutations affecting the main Na+ transporter in this segment alone, the epithelial Na+ channel (ENaC), can lead to severe inheritable forms of hypertension (10). Thus the identification of novel pathways contributing to Na+ reabsorption within the CD may provide additional targets for the treatment of hypertension and other disorders characterized by excess Na+ retention.
The ghrelin receptor (GR) is a highly constitutively active seven-transmembrane G protein-coupled receptor that is expressed in the principal cells of the CD (8), where it increases αENaC-dependent Na+ reabsorption (7). The response is accompanied by increased serum and glucocorticoid-inducible kinase 1 (SGK1) phosphorylation (a common upstream intermediate regulating ENaC,) and an increase in CD αENaC expression (7). CD GR expression has been shown to increase in response to chronic high-fat diet (HFD) (6), and chronic intrarenal pharmacological GR blockade prevents HFD-induced hypertension in rats (6). However, the role of the antinatriuretic renal GR in ANG II-induced hypertension, an experimental model of hypertension that is also characterized by increased phosphorylation of SGK1 (pSGK1) and increased αENaC activity (11), is unknown and serves as the central purpose of the current investigations.
METHODS
Animal Preparation
All studies were approved by the Animal Care and Use Committee of the University of Virginia and were performed in accordance with the National Institutes of Health Guide on the Care and Use of Laboratory Animals. The experiments were conducted in 12-wk-old female Sprague-Dawley rats (Envigo; n = 121) that were housed in a vivarium under controlled conditions [temperature, 21 ± 1°C; humidity, 60 ± 10%; light (8 AM to 8 PM)] and received a normal Na+ diet (0.30% Na+).
Telemetric BP Probe, Systemic Minipump, and Intrarenal Catheter Implantation
Rats were placed under short-term anesthesia with isoflurane (Fluriso; VetOne, Boise, ID). Using sterile technique, a midline abdominal incision was made, and the PA-C40 Model telemetry probe (Data Sciences International, St. Paul, MN) was implanted directly into the descending aorta per manufacturer’s suggested protocol. Once the catheter was secure, the telemetry probe was anchored to the abdominal wall with suture, and the right kidney was removed. After a 1-wk equilibrium period, the rat was placed under short-term anesthesia with isoflurane, and a flank incision was made to expose the left kidney. A catheter (PE-10 tubing, Intramedic; Becton Dickinson, Sparks, MD) was inserted into the renal cortex of the remaining kidney (left) and secured with mesh and Vetbond tissue adhesive (3M Animal Care Products, St. Paul, MN). The other end of the catheter was tunneled toward the scapular region, where vehicle 5% dextrose in water (D5W), scrambled siRNA (SCR; 15 μg per infusion; 3 μl/min infusion for 30 min), or GR siRNA (15 μg per infusion; 3 μl/min infusion for 30 min) with Mirus delivery system (Mirus Bio, Madison, WI) was infused on days −1, 1, and 3 of the experiment. A small incision was then made in the scapular region for the insertion of a 7-day osmotic minipump for systemic infusion of either D5W or ANG II (200 ng·kg−1·min−1) at the beginning of the study (day 0). In a separate group of rats, 24-h urine Na+ excretion (UNaV) and cumulative Na+ balance were measured daily.
Total Cell Membrane Preparation and Western Blot Analysis
After 24 h of ANG II infusion, rats were anesthetized with ketamine (100 mg/ml, Ketaset; Zoetis; Kalamazoo, MI) and xylazine (20 mg/ml, AnaSed; Akorn Animal Health, Lake Forest, IL) via an intraperitoneal injection (IP), and the remaining kidney (left) was removed. Half of the kidney was homogenized in detergent-free lysis buffer with Halt protease and phosphatase inhibitor cocktail (Thermo Scientific, Rockford, IL) and spun at 900 g for 10 min at 4°C to remove cellular debris. The supernatant was removed, and total protein was quantified using a bicinchoninic acid assay (BCA; Pierce, Rockford, IL). Sodium dodecyl sulfate (SDS) samples were prepared, separated by SDS-PAGE (10% Tris·HCl polyacrylamide gels; 50 μg of protein loaded per lane), and transferred onto a nitrocellulose membrane. After a 2-h block in 5% milk at 4°C, membranes were incubated overnight at 4°C with the following primary antibodies made in 5% milk: GR (1:500; Anaspec, Fremont, CA), αENaC (1:500; Alomone Laboratories, Jerusalem, Israel), angiotensin type-1 receptor (AT1R, 1:200; Abcam, Cambridge, MA), and total SGK1 (1:1,000; Cell Signaling, Danvers, MA) or in 5% BSA for pSGK1 (1:1,000; Cell Signaling). Membranes were subsequently incubated with their respective horseradish peroxidase-conjugated secondary antibodies (1:2,500; GE Healthcare, Pittsburgh, PA) for 2 h at room temperature. Signals were detected using chemiluminescence, and band intensities were measured with ImageJ software (NIH, Bethesda, MD). The membranes were then stripped for 10 min (Restore Western blot stripping buffer; Thermo Scientific) and blocked in 5% milk for 1 h at 4°C. The membranes were then incubated with the primary antibody β-tubulin (1:5,000; Millipore, Temecula, CA) in 5% milk for 2 h at room temperature, followed by the remaining Western procedure as stated previously. All blots were normalized to β-tubulin expression.
Pituitary Tissue Isolation and Western Blot Analysis
After 5 days of treatment, the pituitary glands from rats were excised and processed for Western blot analysis as stated previously to measure GR protein expression.
CD Isolation and Western Blot Analysis
After total protein was determined by the BCA assay, 1 mg of kidney homogenate was resuspended in 1 ml of detergent-free lysis buffer and incubated with the cell adhesion CD-specific marker, L1-cell adhesion molecule (L1CAM; 4 μl, 1 mg/ml final concentration; Sigma, St. Louis, MO) on a 360° rocker for 2 h at room temperature. L1CAM is expressed only in membranes of CD cells, allowing for >95% purification of CD membranes (4). A total of 10 μl of magnetic protein A/G beads (Pierce) were added and incubated on a 360° rocker for 30 min followed by 3 washes in PBS. The CD affinity-attached membranes were eluted with 125 μl of 70°C 2× sample buffer and incubated with αENaC (1:500) and GR (1:500) following the remaining Western procedure described above.
Measurement of Renal Blood Flow and Glomerular Filtration Rate
After 24 h of ANG II infusion, rats were placed under anesthesia with Inactin (100 mg/kg body wt; Sigma) via an IP injection, and a tracheostomy was performed using polyethylene tubing (PE-240) to assist respiration. Direct cannulation of the right carotid artery with PE-50 tubing provided arterial access for serum collection at the conclusion of the experiment to measure aldosterone. A flow probe was then secured around the left renal artery and connected to a dual-channel flowmeter (T206 Small Animal Blood Flow Meter; Transonic Systems, Ithaca, NY) for measuring renal blood flow (RBF). Following a 1-h equilibrium period, RBF was measured for 1 h. Results are reported as ml/min.
In a separate group of rats, the right internal jugular vein was also cannulated with PE-10 tubing providing intravenous access through which vehicle D5W with inulin from dahlia tubers (1%; Sigma) was infused at 50 μl/min. Glomerular filtration rate (GFR) was measured by inulin clearance and reported as ml/min per gram kidney weight.
Aldosterone ELISA Assay
An aldosterone ELISA kit (Cayman Chemicals, Ann Arbor, MI) was used to measure serum aldosterone levels according to the manufacturer’s specific protocol. Results were reported as nanograms per milliliter.
Statistical Analyses
Data are presented as means ± SE. Statistical significance was determined by using two-way ANOVA followed by multiple-comparisons testing with the Student-Newman-Keuls test with 95% confidence. Significance level was set at P < 0.05.
Specific In Vivo Protocols
Protocol 1: effects of intrarenal SCR or GR siRNA on mean systolic BP, 24-h UNaV, cumulative Na+ balance, and CD GR protein expression in ANG II-induced hypertension.
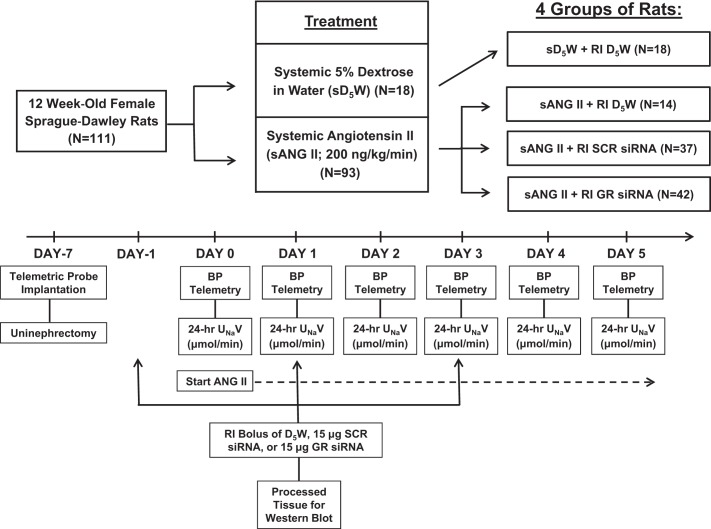
After a 1-wk equilibrium period, the following groups of rats were studied: systemic D5W + intrarenal D5W (n = 6, group 1); systemic ANG II + intrarenal D5W (n = 8, group 2); systemic ANG II + intrarenal SCR siRNA (n = 6, group 3); systemic ANG II + intrarenal GR siRNA (n = 8, group 4). In each group, on days −1, 1, and 3, rats were placed under short-term anesthesia with isoflurane and infused with specific agents into the renal interstitial (RI) space. At day 0, the rats were again placed under short-term anesthesia with isoflurane, and an osmotic minipump was inserted to infuse specific agents systemically for 5 days. That is, group 1 received systemic D5W and intrarenal D5W, group 2 received systemic ANG II and intrarenal D5W, group 3 received systemic ANG II and intrarenal GR SCR siRNA, and group 4 received systemic ANG II and intrarenal GR siRNA. Mean systolic BP (SBP) was recorded at the same time each day by telemetry to prevent any diurnal variation in BP measurements. In a separate set of studies, mean SBP was measured continuously from day −1 through day 1 in rats in group 3 (n = 7) and group 4 (n = 8). Kidneys and pituitary glands were harvested for Western blot analysis at the conclusion of the study to measure GR protein expression. To determine the effects of intrarenal SCR or GR siRNA infusion in the presence of ANG II infusion on 24-h UNaV and cumulative Na+ balance, separate studies were conducted, using the same four groups of rats (n = 6 per group). A schematic of the protocol is presented in Fig. 1.
Fig. 1.
Schematic of experimental protocol. sD5W, systemic 5% dextrose in water; RI, renal intestinal; SCR, scrambled; BP, blood pressure; UNaV, urine sodium (Na+) excretion rate.
Protocol 2: Effects of intrarenal SCR or GR siRNA on RBF, GFR, and serum aldosterone levels during the development of ANG II hypertension.
In a separate group, RBF and GFR were measured acutely in rats that received systemic ANG II + intrarenal SCR siRNA (n = 6 for each; group 3) or systemic ANG II + intrarenal GR siRNA (n = 8 for RBF and n = 6 for GFR; group 4) after day 1 of the study. Following a 1-h equilibrium period, RBF and GFR were both measured for 1 h. Blood was taken from the rats after RBF measurements to measure serum aldosterone levels at this time point.
Protocol 3: Effects of intrarenal SCR or GR siRNA on pSGK1, total SGK1, AT1R, and αENaC expression following 24 h of ANG II infusion.
Rats in groups 1, 3, and 4 (n = 6 for each) were studied as described in protocol 1 above. However, in these studies, kidneys were harvested for Western blot analyses following 24 h of the infusions (after day 1), to examine underlying mechanisms.
Protocol 4: Effects of intrarenal GR siRNA in the absence of ANG II on pSGK1 expression.
There were two groups of rats (n = 5 for each). Control rats received RI infusion of vehicle D5W, and the other group received RI infusion of GR siRNA. Then 48 h after the infusions, the kidneys were harvested for Western blot analysis.
RESULTS
Effects of Chronic Systemic ANG II Infusion on GR Protein Expression in the CD
As shown in Fig. 2, rats receiving chronic systemic ANG II infusion for 5 days demonstrated a significant increase in CD GR protein expression compared with rats that received systemic D5W [2.41 ± 0.19 vs. 1.51 ± 0.11 arbitrary units (AU), respectively; P < 0.05].
Fig. 2.
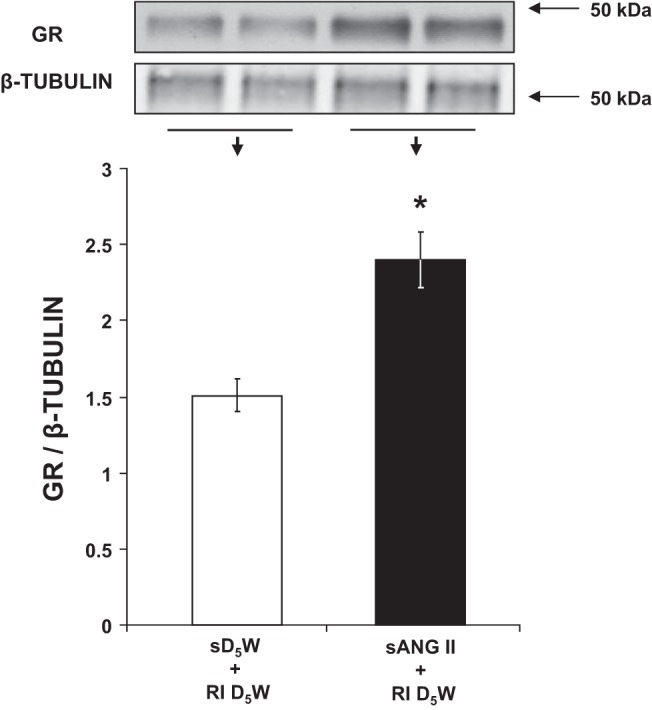
Western blot analysis of collecting duct ghrelin receptor (GR) protein expression following 5 days of systemic 5% dextrose in water (sD5W) + renal interstitial (RI) D5W (open bar, group 1) and sANG II + RI D5W (solid bar, group 2) treatments. The blot was normalized to β-tubulin. Data represent means ± SE. *P < 0.05 from sD5W + RI D5W treatment.
Effects of Chronic Intrarenal GR Inhibition on ANG II-Induced Hypertension
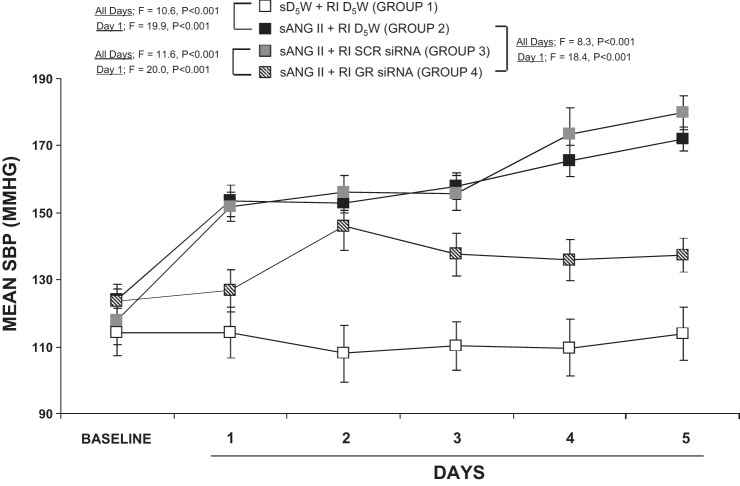
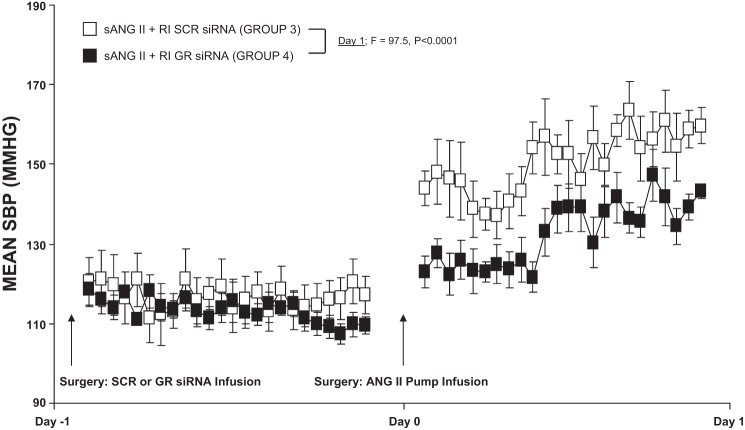
As demonstrated in Fig. 3, systemic ANG II and intrarenal D5W infusion (200 ng·kg−1·min−1; group 2) increased SBP from 123.8 ± 4.7 to 153.6 ± 4.8 mmHg on day 1 (F = 46.9; P < 0.001) and to 171.9 ± 3.7 mmHg at the end of the 5-day infusion period (F = 89.8; P < 0.001), which was significantly higher compared with systemic D5W and intrarenal D5W [group 1 (F = 19.9; P < 0.001 at day 1 and F = 10.6; P < 0.001 at day 5)]. Concurrent intrarenal administration of GR siRNA (group 4) drastically reduced the pressor response to systemic ANG II (group 2) on day 1 (F = 18.4; P < 0.001) and throughout the 5-day infusion period (F = 8.3; P < 0.001). Chronic intrarenal SCR siRNA infusion (group 3) did not significantly change the pressor response to ANG II (P = NS) and also demonstrated significance compared with group 4 by day 1 (F = 20.0; P < 0.001) and day 5 (F = 11.6; P < 0.001). Twenty-four-hour continuous BP responses are depicted in Fig. 4 and demonstrate that BP slowly rises over the first 24 h in ANG II-infused and SCR siRNA-infused rats (group 3) compared with ANG II- and siRNA-infused rats (group 4), P < 0.0001.
Fig. 3.
Mean systolic blood pressure (SBP) response to systemic 5% dextrose in water (sD5W) + renal interstitial (RI) D5W (open square, group 1), sANG II + RI D5W (solid square, group 2), sANG II + RI scrambled (SCR) siRNA (shaded square, group 3), and sANG II + RI ghrelin receptor (GR) siRNA (striped square, group 4) infusions. Results are reported as mmHg. Data represent means ± SE.
Fig. 4.
Continuous mean systolic blood pressure (SBP) responses to systemic angiotensin II (sANG II) + renal interstitial (RI) scrambled (SCR) siRNA (open square, group 3) and sANG II + RI ghrelin receptor (GR) siRNA (solid square, group 4). Results are reported as mmHg. Data represent means ± SE.
Effects of Chronic Intrarenal GR Inhibition on Renal and Extrarenal GR Expression in ANG II-Induced Hypertension
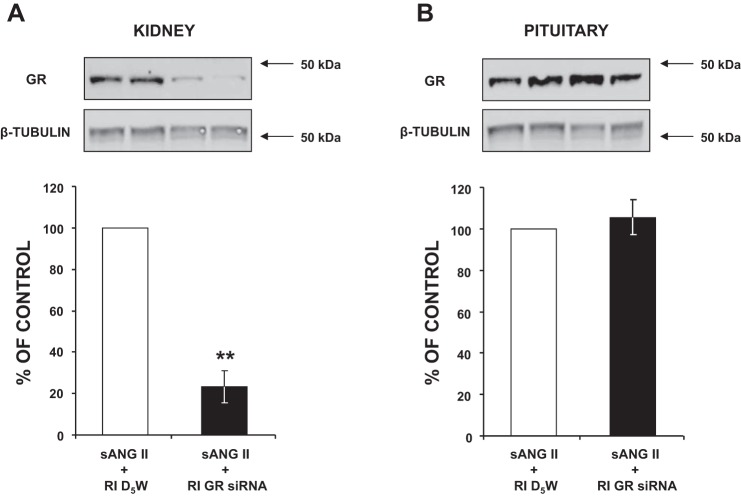
As shown in Fig. 5A, in the presence of ANG II, GR siRNA-infused kidneys showed a 78.4% knockdown compared with D5W-infused kidneys (P < 0.01). Furthermore, despite being infused chronically, the renal GR siRNA did not leak out to affect pituitary GR expression, as it remained unchanged, within the same animal (Fig. 5B).
Fig. 5.
A: Western blot analysis of kidney ghrelin receptor (GR) protein expression following 5 days of systemic angiotensin II (sANG II) + renal interstitial (RI) 5% dextrose in water (D5W) (open bar, group 2) and sANG II + RI GR siRNA (solid bar, group 4) treatments. B: Western blot analysis of pituitary GR protein expression in response to the same treatments in A. All blots were normalized to β-tubulin. Data represent means ± SE and represent a percentage of sANG II + RI D5W treatment. **P < 0.01 from sANG II + RI D5W treatment.
Effects of Chronic Intrarenal GR Inhibition on RBF and GFR in ANG II-Induced Hypertension
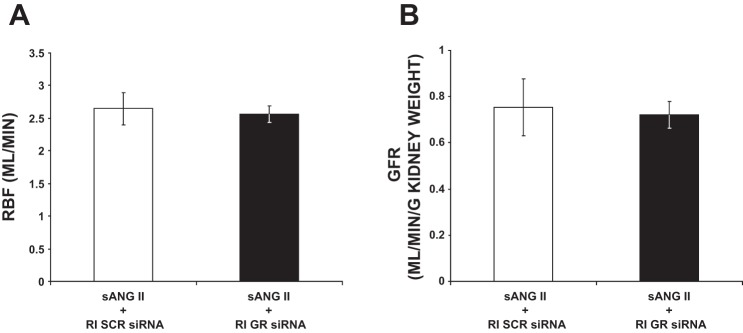
As shown in Fig. 6, following 24 h of ANG II, RBF and GFR were unchanged in rats receiving RI GR siRNA infusion compared with rats receiving RI SCR siRNA infusion (2.55 ± 0.13 vs. 2.65 ± 0.25 ml/min and 0.72 ± 0.06 vs. 0.75 ± 0.12 ml·min−1·g−1 kidney weight, respectively).
Fig. 6.
A: renal blood flow (RBF) measurements in response to systemic angiotensin II (sANG II) + renal interstitial (RI) scrambled (SCR) siRNA (open bar, group 3) and sANG II + RI ghrelin receptor (GR) siRNA (solid bar, group 4). Results are reported as ml/min. B: glomerular filtration rate (GFR) in response to the same treatments in A. Results are reported as ml/min per gram kidney weight. Data represent means ± SE.
Effects of Chronic Intrarenal GR Inhibition on 24-h UNaV and Cumulative Na+ Balance in ANG II-Induced Hypertension
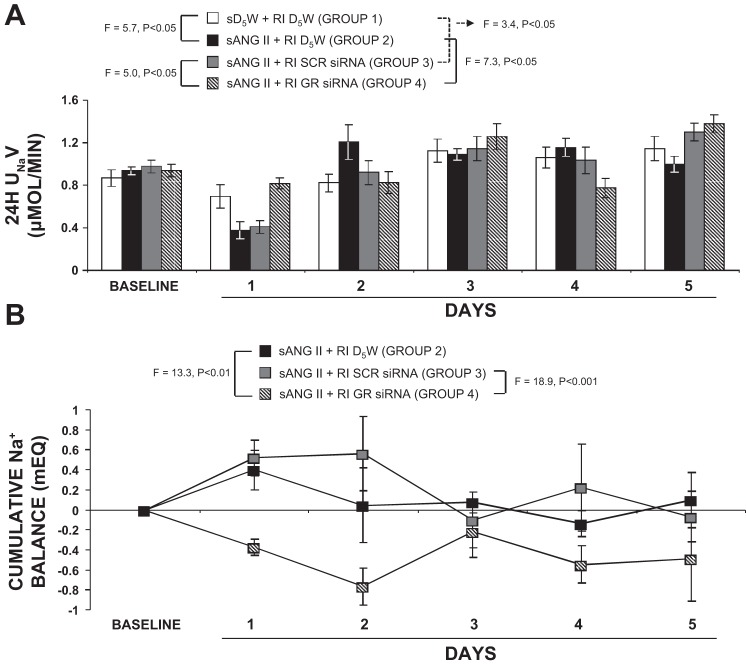
As shown in Fig. 7A, systemic ANG II and intrarenal D5W administration (group 2) reduced 24-h UNaV from 0.94 ± 0.04 to 0.37 ± 0.08 µmol/min (F = 27.5; P < 0.001) on day 1, after which the UNaV responses remained unchanged. Furthermore, compared with systemic D5W and intrarenal D5W infusion (group 1), systemic ANG II and intrarenal D5W rats (group 2) demonstrated significant antinatriuresis on day 1 (F = 5.7; P < 0.05). In rats with systemic ANG II and intrarenal SCR siRNA infusion (group 3), a significant decrease in 24-h UNaV was still observed (compared with group 1) by day 1 (F = 3.4; P < 0.05). However, in rats infused with systemic ANG II and intrarenal GR siRNA (group 4), the antinatriuretic response to systemic ANG II was abolished (F = 7.3; P < 0.05).
Fig. 7.
A: consecutive 24-h urine sodium (Na+) excretion rates (UNaV) in response to systemic 5% dextrose in water (sD5W) + renal interstitial (RI) D5W (open bar, group 1), systemic angiotensin II (sANG II) + RI D5W (solid bar, group 2), sANG II + RI scrambled (SCR) siRNA (shaded bar, group 3), and sANG II + RI ghrelin receptor (GR) siRNA (striped bar, group 4) infusions. Results are reported as μmol/min. B: cumulative Na+ balance values in response to sANG II + RI D5W (solid bar, group 2), sANG II + RI SCR siRNA (shaded bar, group 3), and sANG II + RI GR siRNA (striped bar, group 4). All values were normalized to control sD5W + RI D5W values. Results are reported as mEq. Data represent means ± SE. Statistical analyses performed for values on day 1.
Cumulative Na+ balance results are depicted in Fig. 7B. In response to systemic ANG II and intrarenal D5W infusion (group 2), cumulative Na+ balance increased from 0 to 0.40 ± 0.20 mEq on day 1 (F = 5.9; P < 0.05), after which Na+ balance returned to control levels for the remainder of the study. Concurrent administration of intrarenal SCR siRNA (group 3) induced a similar degree of positive Na+ balance on day 1 (0 to 0.52 ± 0.18 mEq; F = 11.95; P < 0.01), which persisted throughout the entire study period. However, in rats that received intrarenal GR siRNA (group 4), the ANG II–induced positive Na+ balance on day 1 was not observed (0 to −0.37 ± 0.08 mEq; F = 7.43; P < 0.01) and was abolished compared with rats in group 2 (F = 13.3; P < 0.01) and in group 3 (F = 18.9; P < 0.001). Furthermore, a negative cumulative Na+ balance persisted for the remainder of the study.
Effects of Intrarenal GR Inhibition on 24-h CD and Total αENaC, pSGK1 and Total SGK1, AT1R Expression, and Serum Aldosterone Levels in ANG II-Induced Hypertension
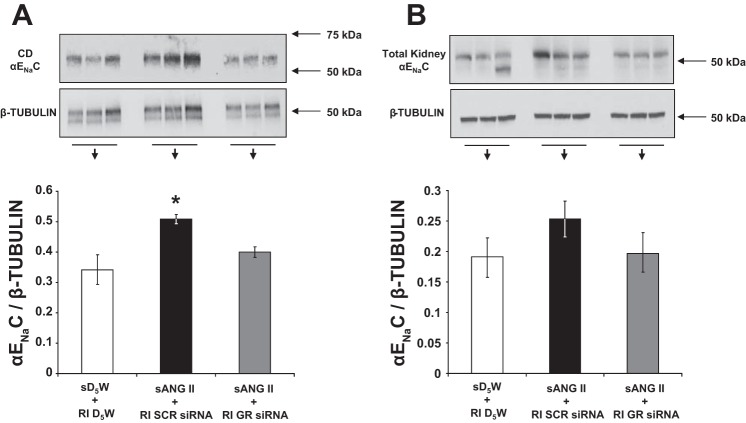
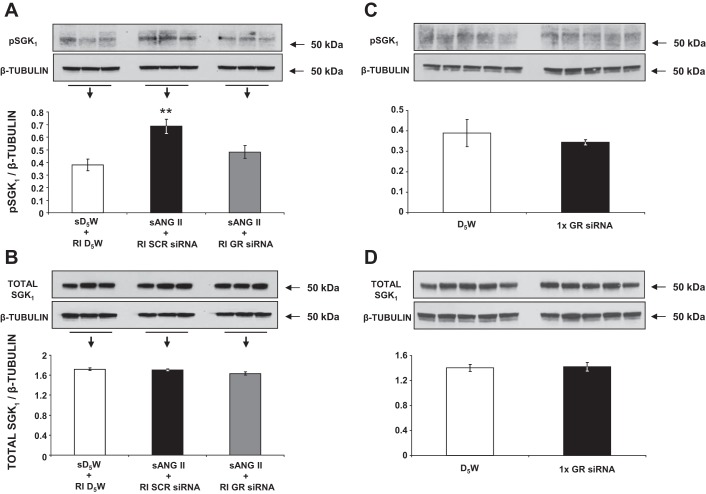
As shown in Fig. 8A, following 24 h of systemic ANG II infusion, rats with intrarenal SCR siRNA demonstrated a significant increase in CD αENaC expression from baseline (0.51 ± 0.02 vs. 0.34 ± 0.05 AU; P < 0.05), corresponding with the increase in renal Na+ reabsorption observed at this time point. However, rats that received intrarenal GR siRNA failed to demonstrate an increase in CD αENaC expression after 24 h, despite exposure to the same ANG II infusion. Total renal αENaC expression remained unchanged in GR siRNA-infused compared with SCR siRNA-infused rats (Fig. 8B, 0.19 ± 0.04 vs. 0.25 ± 0.03 AU, P = NS). As shown in Fig. 9A, compared with control rats (group 1), ANG II-infused rats with intrarenal SCR siRNA (group 3) demonstrated increased pSGK1 protein expression, one of the upstream signaling intermediates of αENaC (0.69 ± 0.06 vs. 0.38 ± 0.05 AU; P < 0.01), whereas rats with GR siRNA infusion failed to show significant increases in pSGK1 (0.48 ± 0.05 vs. 0.38 ± 0.05 AU; P = NS). There was no significant change in total SGK1 protein (Fig. 9B) between the groups. Silencing of the GR did not change pSGK1 (Fig. 9C) or total SGK1 expression (Fig. 9D) at baseline, before ANG II infusion.
Fig. 8.
A: Western blot analysis of collecting duct (CD) epithelial Na+ channel (αENaC) protein expression following 24 h of systemic 5% dextrose in water (sD5W) + renal interstitial (RI) D5W (open bar, group 1), systemic angiotensin II (sANG II) + RI scrambled (SCR) siRNA (solid bar, group 3), and sANG II + RI ghrelin receptor (GR) siRNA (shaded bar, group 4) infusions. B: Western blot analysis of total kidney αENaC protein expression in response to the same treatments in A. All blots were normalized to β-tubulin. Data represent means ± SE. *P < 0.05 from sD5W + RI D5W and sANG II + RI GR siRNA treatments.
Fig. 9.
A: Western blot analysis of kidney phosphorylated serum and glucocorticoid-inducible kinase 1 (pSGK1) protein expression following 24 h of systemic 5% dextrose in water (sD5W) + renal interstitial (RI) D5W (open bar, group 1), systemic angiotensin II (sANG II) + RI scrambled (SCR) siRNA (solid bar, group 3), and sANG II + RI ghrelin receptor (GR) siRNA (shaded bar, group 4) infusions. B: Western blot analysis of kidney total SGK1 protein expression in response to the same treatments in A. C: Western blot analysis of kidney pSGK1 protein expression 48 h after RI D5W (open bar) and RI GR siRNA (solid bar) infusions. D: Western blot analysis of kidney total SGK1 protein expression in response to the same treatments in C. All blots are normalized to β-tubulin. Data represent means ± SE. **P < 0.01 from sD5W + RI D5W and sANG II + RI GR siRNA treatments.
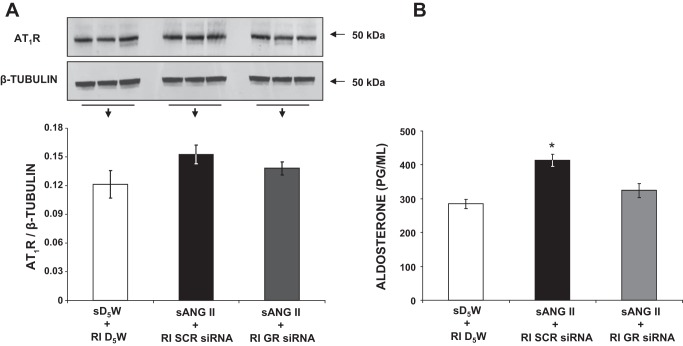
Figure 10A demonstrates that renal AT1R expression does not differ significantly between GR siRNA-infused and SCR siRNA-infused rats (0.14 ± 0.01 vs. 0.15 ± 0.01 AU, P = NS). As demonstrated in Fig. 10B, serum aldosterone levels significantly increased in ANG II- and SCR siRNA-treated rats (group 3) compared with control rats (413.6 ± 17.7 vs. 284.4 ± 13.2 pg/ml, P < 0.05), but this increase was not observed in ANG II- and GR siRNA-treated rats (324.3 ± 21.3 vs. 413.6 ± 17.7 pg/ml, P < 0.05).
Fig. 10.
A: Western blot analysis of kidney angiotensin type-1 receptor (AT1R) protein expression following 24 h of systemic 5% dextrose in water (sD5W) + renal interstitial (RI) D5W (open bar, group 1), systemic angiotensin II (sANG II) + RI scrambled (SCR) siRNA (solid bar, group 3), and sANG II + RI ghrelin receptor (GR) siRNA (shaded bar, group 4) infusions. Blot is normalized to β-tubulin. B: serum aldosterone measurements in response to the same treatments in A. Results are reported as ng/ml. Data represent means ± SE. *P < 0.05 from sD5W + RI D5W and sANG II + RI GR siRNA treatments.
DISCUSSION
Previous studies have shown that a reduction in renal excretory capacity plays a primary role in the etiology of ANG II-induced hypertension (1). Systemic ANG II infusion is characterized by increases in cumulative Na+ balance that occur before the onset of hypertension (1), and increased αENaC activity plays a prominent role in this process (15). The present studies demonstrate that systemic ANG II infusion increases CD GR expression and that phosphorylation of SGK1, αENaC-dependent Na+ reabsorption, and SBP is increased in response to ANG II in Sprague-Dawley rats. Intrarenal inhibition of GR expression ameliorates these responses, suggesting that renal GRs represent a novel therapeutic target for ANG II-induced Na+ retention and hypertension.
Although the GR is well known to exist in the pituitary gland, where it stimulates appetite and increases weight in rodents and humans (5), it has also been identified in many tissues relevant to cardiovascular control, including the brainstem (16), blood vessels (9), and spinal cord (2). Systemic acute administration of ghrelin, the natural ligand of the GR, reduces BP in rodents (14), whereas direct intrathecal stimulation of the GRs on sympathetic neurons increases BP (2), suggesting a site-specific mechanism of action. Delineating GR function outside the central nervous system is essential, especially because GR antagonists are already in development for the control of appetite in obesity. In the present study, we utilized an intrarenal RNA interference method that suppresses the expression of genes by the exogenous introduction of nucleic acid. The major advantage of this approach over pharmacological inhibition of the GR is that the siRNA is specific for the GR, minimizing the possibility of off-target effects. Renal siRNA transduction of tubular epithelial cells is particularly efficient, with significant incorporation into CD cells (3), the intrarenal site of GR expression (7). To confirm that the observed reductions in SBP during renal siRNA infusion were due to intrinsic effects within the kidney (and not systemic effects of GR inhibition), we evaluated extrarenal GR expression in our model. In rats treated with chronic intrarenal GR siRNA, central nervous system GR expression remained unchanged, suggesting that the observed effects were due to elimination of GR expression in the kidney. To ensure that intrarenal GR siRNA did not affect another antinatriuretic receptor within the kidney, simply rendering ANG II less potent, we measured AT1R expression in our model, which was not affected by GR siRNA infusion. Thus, as the GR is one of the most constitutively active seven-transmembrane domain receptors known, and changes in expression of a constitutively active receptor are associated with changes in signaling independent of the endogenous ligand (12), the attenuation of ANG II-induced hypertension in our studies was likely due to a reduction in GR activity within the kidney.
In this light, we evaluated UNaV and calculated cumulative Na+ balance values during intrarenal GR inhibition. Following 24 h of systemic ANG II infusion, in rats receiving intrarenal D5W (group 2) or SCR siRNA (group 3), UNaV was significantly reduced. The early reduction in UNaV in response to systemic ANG II promoted a positive cumulative Na+ balance, necessitating an increase in BP to normalize Na+ excretion. Indeed, cumulative Na+ balance values (Fig. 7B) showed that ANG II-infused rats with intrarenal D5W (group 2) or SCR siRNA (group 3) had a significant increase in cumulative Na+ balance following 24 h of ANG II. In Sprague-Dawley rats with renal GR siRNA (group 4), the expected reduction in UNaV and the expected increase in cumulative Na+ balance did not occur, despite exposure to the same ANG II infusion. These data indicate that one of the mechanisms of the attenuation of ANG II-induced hypertension during renal GR inhibition is the abolition of the initial increase in Na+ reabsorption that initiates the hypertensive cascade in this model.
Because renal GR inhibition did not alter glomerular filtration rate or renal blood flow parameters in our model (Fig. 6), we focused our attention on tubular mechanisms that could be responsible for the observed effects. Indeed, CD GR inhibition prevented ANG II-induced increases in aldosterone, pSGK1, and αENaC at 24 h, thereby preventing one possible stimulus for the initial rise in BP in these animals. The αENaC-mediated Na+ reabsorption can be stimulated by a kinase-dependent mechanism, leading to phosphorylation and stimulation of SGK1, an upstream signaling intermediate of αENaC. In response to intrarenal D5W or SCR siRNA infusion, ANG II-induced phosphorylation of SGK1 was significantly increased, as was CD expression of αENaC, whereas total SGK1 fractions remained unchanged. Silencing of the GR at baseline (in the absence of ANG II) did not affect expression of pSGK1. Although ANG II-induced stimulation of αENaC can occur independently of SGK1, our data suggest that GR inhibition may involve aldosterone and the kinase-dependent pathway because plasma aldosterone, SGK1 phosphorylation, and αENaC expression were inhibited in the presence of GR siRNA.
In summary, using a chronic intrarenal siRNA approach that minimizes off-target effects, we demonstrated a significant role of CD GRs in mediating the hypertensive response to ANG II infusion. Chronic inhibition of intrarenal GR activity significantly reduces CD αENaC expression, providing a potential mechanism for promoting a negative cumulative Na+ balance and ameliorating ANG II-induced hypertension in rats.
GRANTS
This work was supported by National Institutes of Health Grant R01-DK-110369 (S. H. Padia).
DISCLOSURES
No conflicts of interest, financial or otherwise, are declared by the authors.
AUTHOR CONTRIBUTIONS
S.H.P. conceived and designed research; B.A.K. and N.L.H. performed experiments; B.A.K., N.L.H., and S.H.P. analyzed data; B.A.K., N.L.H., and S.H.P. interpreted results of experiments; B.A.K. prepared figures; S.H.P. drafted manuscript; B.A.K. and S.H.P. edited and revised manuscript; B.A.K., N.L.H., and S.H.P. approved final version of manuscript.
ACKNOWLEDGMENTS
We thank Dr. Mark Conaway (University of Virginia School of Medicine) for performing statistical analysis.
REFERENCES
- 1.Bosnyak S, Jones ES, Christopoulos A, Aguilar MI, Thomas WG, Widdop RE. Relative affinity of angiotensin peptides and novel ligands at AT1 and AT2 receptors. Clin Sci (Lond) 121: 297–303, 2011. doi: 10.1042/CS20110036. [DOI] [PubMed] [Google Scholar]
- 2.Ferens DM, Yin L, Bron R, Hunne B, Ohashi-Doi K, Kitchener PD, Sanger GJ, Witherington J, Shimizu Y, Furness JB. Functional and in situ hybridization evidence that preganglionic sympathetic vasoconstrictor neurons express ghrelin receptors. Neuroscience 166: 671–679, 2010. doi: 10.1016/j.neuroscience.2010.01.001. [DOI] [PubMed] [Google Scholar]
- 3.Gusella GL, Fedorova E, Hanss B, Marras D, Klotman ME, Klotman PE. Lentiviral gene transduction of kidney. Hum Gene Ther 13: 407–414, 2002. doi: 10.1089/10430340252792530. [DOI] [PubMed] [Google Scholar]
- 4.Helbert MJ, Dauwe SE, De Broe ME. Flow cytometric immunodissection of the human distal tubule and cortical collecting duct system. Kidney Int 59: 554–564, 2001. doi: 10.1046/j.1523-1755.2001.059002554.x. [DOI] [PubMed] [Google Scholar]
- 5.Horvath TL, Diano S, Sotonyi P, Heiman M, Tschöp M. Minireview: ghrelin and the regulation of energy balance–a hypothalamic perspective. Endocrinology 142: 4163–4169, 2001. doi: 10.1210/endo.142.10.8490. [DOI] [PubMed] [Google Scholar]
- 6.Kemp BA, Howell NL, Gildea JJ, Padia SH. Intrarenal ghrelin receptor antagonism prevents high-fat diet-induced hypertension in male rats. Endocrinology 155: 2658–2666, 2014. doi: 10.1210/en.2013-2177. [DOI] [PubMed] [Google Scholar]
- 7.Kemp BA, Howell NL, Gildea JJ, Keller SR, Padia SH. Intrarenal ghrelin receptors regulate ENaC-dependent sodium reabsorption by a cAMP-dependent pathway. Kidney Int 84: 501–508, 2013. doi: 10.1038/ki.2013.187. [DOI] [PubMed] [Google Scholar]
- 8.Kemp BA, Howell NL, Gray JT, Keller SR, Nass RM, Padia SH. Intrarenal ghrelin infusion stimulates distal nephron-dependent sodium reabsorption in normal rats. Hypertension 57: 633–639, 2011. doi: 10.1161/HYPERTENSIONAHA.110.166413. [DOI] [PMC free article] [PubMed] [Google Scholar]
- 9.Kleinz MJ, Maguire JJ, Skepper JN, Davenport AP. Functional and immunocytochemical evidence for a role of ghrelin and des-octanoyl ghrelin in the regulation of vascular tone in man. Cardiovasc Res 69: 227–235, 2006. doi: 10.1016/j.cardiores.2005.09.001. [DOI] [PubMed] [Google Scholar]
- 10.Lifton RP, Gharavi AG, Geller DS. Molecular mechanisms of human hypertension. Cell 104: 545–556, 2001. doi: 10.1016/S0092-8674(01)00241-0. [DOI] [PubMed] [Google Scholar]
- 11.Norlander AE, Saleh MA, Kamat NV, Ko B, Gnecco J, Zhu L, Dale BL, Iwakura Y, Hoover RS, McDonough AA, Madhur MS. Interleukin-17A regulates renal sodium transporters and renal injury in angiotensin II-induced hypertension. Hypertension 68: 167–174, 2016. doi: 10.1161/HYPERTENSIONAHA.116.07493. [DOI] [PMC free article] [PubMed] [Google Scholar]
- 12.Petersen PS, Woldbye DP, Madsen AN, Egerod KL, Jin C, Lang M, Rasmussen M, Beck-Sickinger AG, Holst B. In vivo characterization of high basal signaling from the ghrelin receptor. Endocrinology 150: 4920–4930, 2009. doi: 10.1210/en.2008-1638. [DOI] [PubMed] [Google Scholar]
- 13.Prieto MC, Reverte V, Mamenko M, Kuczeriska M, Veiras LC, Rosales CB, McLellan M, Gentile O, Jensen VB, Ichihara A, McDonough AA, Pochynyuk OM, Gonzalez AA. Collecting duct prorenin receptor knockout reduces renal function, increases Na+ excretion and mitigates renal responses in ANG II-induced hypertensive mice. Am J Physiol Renal Physiol 313: F1243–1253, 2017. doi: 10.1152/ajprenal.00152.2017. [DOI] [PMC free article] [PubMed] [Google Scholar]
- 14.Shinde UA, Desai KM, Yu C, Gopalakrishnan V. Nitric oxide synthase inhibition exaggerates the hypotensive response to ghrelin: role of calcium-activated potassium channels. J Hypertens 23: 779–784, 2005. doi: 10.1097/01.hjh.0000163146.20330.bc. [DOI] [PubMed] [Google Scholar]
- 15.Zhao D, Seth DM, Navar LG. Enhanced distal nephron sodium reabsorption in chronic angiotensin II-infused mice. Hypertension 54: 120–126, 2009. doi: 10.1161/HYPERTENSIONAHA.109.133785. [DOI] [PMC free article] [PubMed] [Google Scholar]
- 16.Zigman JM, Elmquist JK. In search of an effective obesity treatment: a shot in the dark or a shot in the arm? Proc Natl Acad Sci USA 103: 12961–12962, 2006. doi: 10.1073/pnas.0605959103. [DOI] [PMC free article] [PubMed] [Google Scholar]


