

Summary
Inflammatory bowel disease (IBD), which includes ulcerative colitis and Crohn’s disease (CD), is a chronic autoimmune disease. Parasitic infections and their products have been shown to have protective effects on autoimmune diseases, including IBD. In this experiment, 96 male BALB/c mice aged 6–8 weeks were divided randomly into two large groups: prevention and therapy. The changes in the various indicators of colitis were detected to demonstrate that Trichinella spiralis serine protease inhibitors can relieve the inflammatory severity of 2,4,6‐trinitrobenzenesulphonic acid solution (TNBS)‐induced colitis and to explore possible immunological mechanisms. Results showed that the disease activity index (DAI) score, myeloperoxidase (MPO) activity, macroscopic and microscopic damage degrees of colon all decreased significantly, interferon (IFN)‐γ expression decreased, interleukin (IL)‐4 expression increased, nuclear factor kappa B (NF)‐κB expression decreased and the percentage of CD4+CD25+forkhead box protein 3 (FoxP3+) regulatory T cells (Treg) cells in the spleen. MLN increased significantly compared to the phosphate‐buffered saline (PBS)/2,4,6‐trinitrobenzenesulphonic acid solution (TNB) group. We found the same results with the T. spiralis Kazal‐type serine protease inhibitors (TsKaSPI)+TNBS and TsAdSPI+TNBS groups in the large prevention group and the large therapy group, compared to the TNBS+PBS group with the TNBS+TsKaSPI and TNBS+TsAdSPI groups. Immunization with TsKaSPI and TsAdSPI on the CD models showed an intervention effect, possibly because TsKaSPI and TsAdSPI induced a T helper type 2 (Th2)‐type immune response and balanced the TNBS‐induced Th1‐type immune response.
Keywords: immunoregulation, inflammatory bowel disease, Trichinella spiralis serine protease inhibitors
Introduction
Inflammatory bowel disease (IBD) is a chronic and recurrent intestinal autoimmune disease with high incidence. According to its different pathological changes, IBD can be divided into ulcerative colitis (UC) and Crohn’s disease (CD) [1, 2]. In recent years, the incidence of IBD has increased year by year, but its pathogenesis is not clear. The current study found that individuals with genetic susceptibility under the influence of environmental factors are more susceptible to the disease. The incidence of IBD is correlated negatively with parasite infection rate; hence, worm therapy has become the current research hot‐spot. With the deepening of research, a series of safety problems in worm therapy is widely gaining the attention of the community. The application of living parasite treatment can lead to parasitic infection; this outcome triggers biosafety issues. Therefore, a new research strategy aims to use parasite products as a substitute for parasitic infestation in the treatment of IBD.
As one of the most widely studied protease inhibitors, serine protease inhibitor (serpin, SPI) is a kind of structurally conserved protein superfamily [3]. It binds to the active site of serine protease to inhibit its proteolytic activity or prevent it from producing protease. Studies have shown that SPI can affect protein metabolism by regulating the activity of protease [4, 5, 6, 7] and is involved in many physiological and pathological processes, such as blood coagulation, complement activation, inflammatory reaction, apoptosis, cell migration and fibrinolysis. SPI is also an important part of the body’s immune system [8, 9]. Trichinella spiralis SPI (T.s SPI) were first cloned by Nagano et al. [10]. Earlier studies by Macen et al. [11] and Yenbutr et al. [12] showed that SPI inhibits the endogenous coagulation pathway by inhibiting the activity of serine proteases. This action allows the parasite to evade the host’s rejection mechanism. Thus, SPI plays a key role in the parasite’s ability to early survival in the host. In addition, by inhibiting the activity of elastase, tryptase, chymase and other intestinal digestive enzymes, SPI protects the parasites from the digestion of host digestive enzymes; hence, the parasite can survive in the host for a long time. SPI also plays a vital role in the moulting, settling down in the terminal host body and growth and development of the parasites [9, 13]. Hong et al. [14] found that SPI may also play a significant role in the regulation and suppression of host immune response and inhibit the release of cathepsin G, which is closely related to inflammation, from neutrophils at the inflammation site. Therefore, T.s SPIs are important factors in regulating the interaction of T. spiralis and the host. Previous experiments have confirmed that infection with T. spiralis can relieve the inflammatory severity of IBD. In this experiment, the expression of T helper type 1 (Th1)‐ and Th2‐type cytokines, nuclear factor kappa B (NF‐κB) expression and percentage of CD4+CD25+forkhead box protein 3 (FoxP3+ regulatory T cells (Treg) cells were detected to investigate the effect of immunization with T.s SPI on 2,4,6‐trinitrobenzenesulphonic acid solution (TNBS)‐induced colitis mouse models and its underlying mechanisms and provide new objectives for the treatment of IBD.
Methods
Animals
Male Balb/c mice (specific pathogen‐free, SPF) 6–8 weeks of age were purchased from the Animal Center of Harbin Medical University and allowed to adapt for 4 days before the experiment with food and water freely available under standard conditions. All procedures were in strict accordance with the Chinese National Institute of Health Guide for the Care and Use of Laboratory Animals. Efforts were made to minimize the number of animals and their suffering.
Trichinella spiralis Kazal‐type serine protease inhibitors (TsKaSPI) and T. spiralis adult serine protease inhibitors (TsAdSPI) recombinant protein preparation
The laboratory‐designed primers were based on T. spiralis putative Kazal‐type serine protease inhibitor domain protein (Tsp 03548) mRNA (Accession number: XM_003379851) published by the National Center for Biotechnology Information (NCBI), and specifically amplified the serpin gene by reverse transcription–polymerase chain reaction (RT–PCR). The laboratory also designed primers based on T. spiralis clone Ad5 serine proteinase inhibitor mRNA published by the NCBI (Accession number: EU263307.1), and specifically amplified the serpin gene from the total RNA of 5‐day‐old adults of T. spiralis by RT–PCR. The pET‐30a‐TsKaSPI‐positive and the pET‐28a‐TsAdSPI‐positive expression bacteria frozen previously in the laboratory were amplified and expressed under the optimal expression conditions. Recombinant proteins expressed in Escherichia coli were separated by using sodium dodecyl sulphate‐polyacrylamide gel electrophoresis (SDS–PAGE). Target proteins were isolated by cutting the gel slices that contained the right bands which were stained by 0·25 mol/l KCl, the gel was crushed, the appropriate amount of phosphate‐buffered saline (PBS) was added, then repeated freezing and thawing and high‐speed centrifugation was used to obtain the purified protein. Protein concentration was examined using a bicinchoninic acid protein assay kit (Beyotime Biotechnology, Shanghai, China). The obtained purified target protein was subjected to SDS‐PAGE and a single and consistent expected size band was obtained, demonstrating that this method can obtain the purified target protein.
Experimental grouping
The experimental mice were divided randomly into two large groups: prevention group and therapy group; the prevention group was divided into eight groups: (1) the control group, treated with 50 µg PBS by intraperitoneal injection (i.p.) three times at 5‐day intervals before given 100 µl PBS intrarectally; (2) the PBS+TNBS group, treated with 50 µg PBS by i.p. three times at 5‐day intervals before introduction of colitis; (3) the HT‐TsKaSPI+PBS group, treated with 50 μg HT‐TsKaSPI by i.p., boiled for 10 min three times at 5‐day intervals before intrarectal injection with 100 µl PBS; (4) the TsKaSPI+PBS group, treated with 50 μg TsKaSPI by i.p. three times at 5‐day intervals before intrarectal injection with 100 µl PBS; (5) the TsAdSPI+PBS group, treated with 50 μg TsAdSPI by i.p. three times at 5‐day intervals before intrarectal injection with 100 µl PBS; (6) the HT‐TsKaSPI+TNBS group, treated with 50 μg HT‐TsKaSPI by i.p., boiled for 10 min three times at 5‐day intervals before introduction of colitis; (7) the TsKaSPI+TNBS group, treated with 50 μg TsKaSPI by i.p. three times at 5‐day intervals before introduction of colitis; (8) the TsAdSPI+TNBS group, treated with 50 μg TsAdSPI by i.p. three times at 5‐day intervals before introduction of colitis; and the therapy group was also divided into eight groups: (9) the control group, treated with 50 µg PBS by i.p. 24 and 48 h after intrarectal injection with 100 µl PBS; (10) the TNBS+PBS group, treated with 50 µg PBS by i.p. 24 and 48 h after TNBS administration; (11) the PBS+HT‐TsKaSPI group, treated with 50 μg TsKaSPI by i.p., boiled for 10 min 24 and 48 h after 100 µl PBS intrarectal injection; (12) PBS+TsKaSPI, treated with 50 μg TsKaSPI by i.p. 24 and 48 h after 100 µl PBS intrarectal injection; (13) PBS+TsAdSPI, treated with 50 μg TsAdSPI by i.p. 24 and 48 h after 100 µl PBS given intrarectally; (14) the TNBS+HT‐TsKaSPI group, treated with 50 μg HT‐TsKaSPI by i.p., boiled for 10 min 24 and 48 h after TNBS administration; (15) TNBS+TsKaSPI, treated with 50 μg TsKaSPI by i.p. 24 and 48 h after TNBS administration; (16) TNBS+TsAdSPI, treated with 50 μg TsAdSPI by i.p. 24 and 48 h after TNBS administration; six or more mice in each group. All the mice were killed on the seventh day after the model was established and tested for various indices. The experimental flow chart is shown in Fig. 1. The body weight of the mice in all groups was determined daily.
Figure 1.
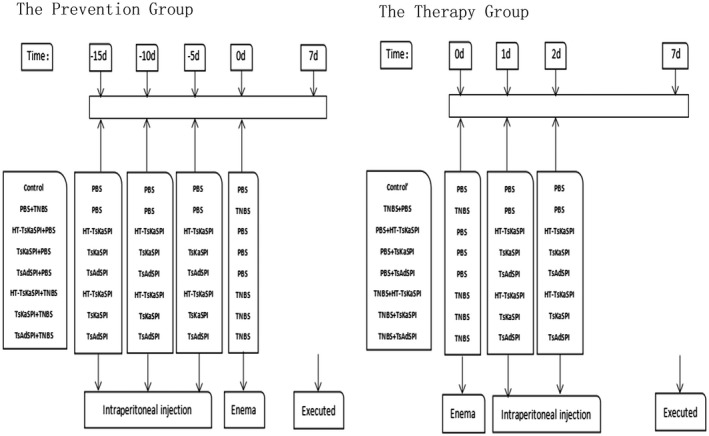
A scheme to clarify the exact moments of immune with protein/PBS and 2,4,6‐trinitrobenzenesulphonic acid solution [(TNB)/phosphate‐buffered saline (PBS)] administration.
Modelling method
Stallmach and others [15] established the TNBS‐induced colitis model approach. Twenty‐four h after fasting, the mice in each group were anaesthetized using i.p. injection with 3% sodium pentobarbital. A 1·0‐mm thin catheter was inserted into the colon. The mice were injected rapidly with 100 µl 2·5 mg TNBS solution [50 µl 5% (m/v) TNBS dissolved in 50 µl 50% ethanol]. After injection, the anus of the mice was pinched, and the mice were inverted for 3–4 min by seizing the tail and then replaced in the cages with free access to food and water. This colitis animal model promotes a Th1‐type immune response similar to human CD. Inflammation was determined based on the following parameters: clinical disease activity, macroscopic and microscopic inflammation score and myeloperoxidase activity in the colon tissue. The grades were conveyed by three investigators blinded for the treatment of the mice.
Disease activity index (DAI) evaluation
The mice were observed daily for changes in mental status, activity, hair lustre, appetite and defecation (to determine whether stools contained blood, stool pattern, defecation frequency, etc.). Each group of mice was scored for DAI according to international standards: DAI = (weight loss score + stool performance score + blood stool score)/3 (Table 1). The benzidine method was used to detect faecal occult blood.
Table 1.
Disease activity index score parameters (DAI)
| Weight loss (%) | Stool performance | Bloody stool | Index |
|---|---|---|---|
| 0–1 | Normal | None | 0 |
| 1–5 | Soft and shaped | 1 | |
| 5–10 | Loose | Faecal occult blood | 2 |
| 10–15 | Between | 3 | |
| > 15 | diarrhoea | Defecate haemorrhage | 4 |
Myeloperoxidase (MPO) activity assay
The degree of colonic inflammation was investigated by assay of MPO activity. MPO activity was measured using the MPO assay kit (Alpha Biotech, Glasgow, UK). Colon tissue was weighed and cut into fine pieces, and 150–250 µl RIPA lysate per 20 mg tissue was added. The samples were homogenized using a glass homogenizer. After lysis completion, the samples were centrifuged at 10 000–14 000 g for 3–5 min to obtain the supernatant. The protein concentration was examined using a bicinchoninic acid protein assay kit (Beyotime Biotechnology). Follow‐up was conducted according to the enzyme‐linked immunosorbent assay (ELISA) kit’s instructions. The MPO activity of the supernatants was determined and expressed as units per gram of total protein (U/g). All data are from three separate experiments.
Macroscopic and microscopic assessments of the colon injury
After the mice were killed using cervical dislocation, the abdominal wall was opened and the intestine was exposed. The entire segment of the colon from the rectum to the caecocolic junction was removed and rinsed thoroughly with normal saline. The isolated colon was examined for macroscopic damage. Scores were obtained using the following damage scoring system [16]: 0, no damage; 1, localized hyperaemia without ulcers; 2, ulceration without hyperaemia or bowel wall thickening; 3, ulceration with inflammation at one site; 4, ulcer and inflammation at two or more sites; and 5, major sites of inflammation and ulceration extending more than 1 cm along length of colon; 6–10, when an area of damage extended more than 2 cm along length of colon, the score was increased by one for each additional cm of involvement. Subsequently, the colon specimens were fixed in 10% paraformaldehyde for hours and embedded into paraffin sections. Haematoxylin and eosin staining was performed. The pathological sections of the colon were observed under an optical microscope. The criteria of Wallace and Keenan [16] were used to assess the histological damage: 0, intact tissue construction with no apparent damage; 1, damage limited to surface epithelium; 2, localized ulcer confined to mucosa; 3, focal, transmural inflammation and ulceration; 4, extensive transmural ulceration and inflammation adjacent to normal mucosa; and 5, extensive transmural ulceration and inflammation involving the entire section. All data are from three separate experiments and the scores assigned by three observers without knowing the state of the mice.
ELISA detection of interleukin (IL)‐4 and interferon (IFN)‐γ expression in colon tissues and spleen lymphocytes
Colon tissues were cut and weighed. The lysate was added and the samples were homogenized using a glass homogenizer. After lysis completion, the samples were centrifuged at 10 000–14 000 g for 3–5 min to obtain the supernatant. The ELISA kit (Bioss, Edinburgh, UK) manual was followed for cytokine detection. To prepare the spleen lymphocyte single‐cell suspension, lysis solution was added. Full lysis was performed, followed by centrifugation at 10 000–14 000 g for 3–5 min. The supernatant was collected, subpackaged and performed according to the kit instructions for cytokine detection and the number of cytokines was expressed per mg of total protein. All data are from three separate experiments.
Western blotting of NF‐κB p65 expression in colon tissues
Colon tissues were cut and weighed. The lysate was added, and the samples were homogenized using a glass homogenizer. After lysis completion, the samples were centrifuged at 10 000–14 000 gfor 3–5 min to obtain the supernatant. The protein concentration was examined using a bicinchoninic acid protein assay kit (Beyotime Biotechnology). A total of 50 µg of colon homogenate proteins was boiled with ×5 SDS‐PAGE sample loading buffer and separated using SDS‐PAGE. The proteins were blotted onto a nitrocellulose filter membrane. The membrane was placed into blocking buffer (5% non‐fat milk) for 2 h at room temperature. Subsequently, the membrane was incubated with the anti‐NF‐κB and anti‐β‐actin (diluted 1 : 4000 in blocking buffer, Bioss) at 4°C overnight. After washing three times using PBS with Tween 20 (PBST), the membrane was incubated with a peroxidase conjugated secondary antibody, which was diluted in 5% non‐fat milk (1 : 5000) on a shaker for 2 h at room temperature. After washing three times, ultrasensitive ECL chemiluminescence reagent (Sangon Biotech, Shanghai, China) was dropped to the membrane and the membrane exposed. The bands were quantified using densitometry and analysed with Image J.
Flow cytometry (FCM) detection of the expression of CD4+CD25+FoxP3+ Treg cells in the spleen and mesenteric lymph node (MLN)
The spleen and MLN lymphocyte single‐cell suspension was prepared and dispensed into tubes at 1 × 10⁶ cells/tube. The cells were resuspended in PBS and incubated for 30 min in the dark with fluorescein isothiocyanate (FITC) rat anti‐mouse CD4 and allophycocyanin (APC) rat anti‐mouse CD25 (Sungene Biotech, Tianjin, China). The resuspended cells were added with a fixation/permeabilization solution (Invitrogen, Carlsbad, CA, USA), incubated for 30–60 min, and washed again. After the cell resuspension, phycoerythrin (PE) rat anti‐mouse FoxP3 (Sungene Biotech) was added, and the solution was incubated for 20 min, then washed, and resuspended again for FCM testing. All data are from three separate experiments.
Statistical analysis
All results were expressed as the mean ± standard error. Data were evaluated using one‐way analysis of variance (anova) analysis, two‐way anova and spss version 13.0 software. Multiple comparison between the groups was performed using the Tukey post‐hoc test. P < 0·05 was considered statistically significant. All statistical analyses were performed using GraphPad Prism software.
Results
Weight changes
The TNBS modelling day was established as experimental day 0. The weight change of the mice was recorded daily until the experiment was finished. Results are shown in Fig. 2. In the prevention group, the body weight of the mice of the PBS+TNBS group continued to decline. On the third day, the mice weights dropped to a minimum and decreased by 7·10 ± 0·96% and then gradually rebounded until the seventh day. The body weight of the mice in the HT‐TsKaSPI+TNBS, TsKaSPI+TNBS and TsAdSPI+TNBS groups decreased slowly relative to the PBS+TNBS group. The change in the HT‐TsKaSPI+TNBS group was similar to that of the PBS+TNBS group; however, the degree of decrease was slightly lower than that of the PBS+TNBS group (P > 0·05) and significantly higher than that of the TsKaSPI+TNBS and TsAdSPI+TNBS groups (P < 0·001). By the second day, the body weight of the TsKaSPI+TNBS group mice decreased by 1·95 ± 0·83% and the TsAdSPI+TNBS group mice decreased by 2·72 ± 1·06%, then gradually increased. Meanwhile, the weight of mice in the control group increased daily and reached the highest value (14·04 ± 1·05%) on the seventh day. The increased trend of the PBS+TNBS, HT‐TsKaSPI+TNBS, TsKaSPI+TNBS and TsAdSPI+TNBS groups was significantly lower than that of the control group (P < 0·001). The body weight of mice in the HT‐TsKaSPI+PBS, TsKaSPI+PBS and TsAdSPI+PBS groups were gradually increased, and the increase was slightly lower than that in the control group (P > 0·05). In the therapy group, the weight of the mice in TNBS+TsKaSPI group increased by 3·49 ± 1·10% on the seventh day and the TNBS+TsAdSPI group mice increased by 6·09 ± 1·15%, whereas that of the TNBS+PBS group was decreased by 4·78 ± 1·04% and the TNBS+HT‐TsKaSPI group was decreased by 3·02 ± 0·82%. Their change tendency was significantly different from the control’ group (P < 0·001), but the change tendency of the mice in the PBS+HT‐TsKaSPI, PBS+TsKaSPI and PBS+TsAdSPI groups was similar to the control’ group (P > 0·05).
Figure 2.
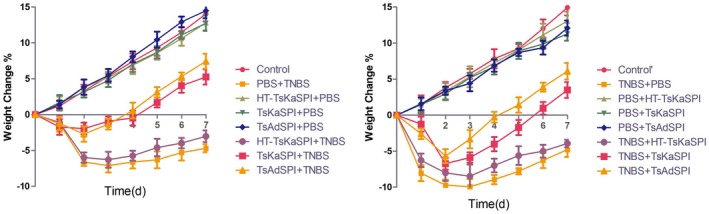
Changes in weight of the mice is expressed as the difference between the weight on the day and the initial weight. The weight of the mice in phosphate‐buffered saline (PBS)+2,4,6‐trinitrobenzenesulphonic acid solution (TNBS) and TNBS+PBS groups decreased until day 3 and in Trichinella spiralis Kazal‐type serine protease inhibitors (TsKaSPI)+TNBS, TsAdSPI+TNBS and TNBS+TsKaSPI, TNBS+TsAdSPI groups decreased until day 2. Afterwards, they slowly regained. Data are shown as mean ± standard deviation (s.d.) of three mice per group.
DAI score
Twenty‐four h after modelling, the mice in the PBS+TNBS and the TNBS+PBS groups showed various degrees of apathetic behaviour, delayed activity, loss of appetite, rough hair, diarrhoea, bloody stools or faecal occult blood, weight loss and other clinical manifestations. On the third day, these symptoms were most evident; all the symptoms of the mice in TsKaSPI+TNBS (2·44 ± 0) and TsAdSPI+TNBS groups (2·44 ± 0·16) were slighter than those of the PBS+TNBS group (2·89 ± 0·16) (P < 0·001), but those of the HT‐TsKaSPI+TNBS group (2·67 ± 0) were similar to the PBS+TNBS group (P > 0·05). The TNBS+TsKaSPI (2·56 ± 0·16) and TNBS+TsAdSPI (2·11 ± 0·15) group mice recovered more significantly than those of the TNBS+PBS (3·00 ± 0·27) group (P < 0·001). On the third day, the TNBS+HT‐TsKaSPI group mice (2·89 ± 0) were not recovered significantly (P > 0·05). Meanwhile, the DAI score of the mice in each group of immunity with only protein did not exceed 1·5, significantly lower than other groups (P < 0·001). The DAI scores of the 16 groups at different time‐points are shown in Fig. 3.
Figure 3.
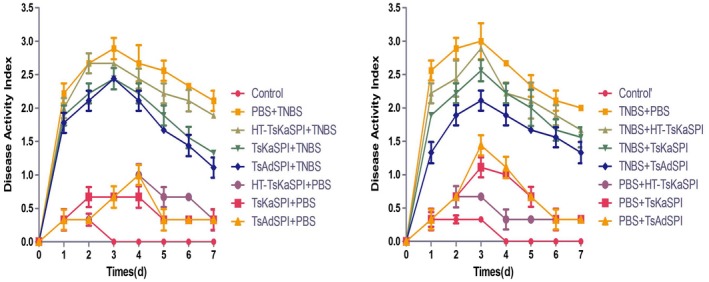
DAI assessment of Trichinella spiralis Kazal‐type serine protease inhibitors (TsKaSPI)+2,4,6‐trinitrobenzenesulphonic acid solution (TNBS) and TsAdSPI+TNBS groups was lower than that of the phosphate‐buffered saline (PBS)+TNBS) group. The same result was seen compared with the TNBS+TsKaSPI and TNBS+TsAdSPI with TNBS+PBS groups. Data are shown as mean ± standard deviation (s.d.) of three mice per group.
MPO activity
In the prevention group, MPO activity in the TsKaSPI+TNBS (0.66 ± 0·05) and TsAdSPI+TNBS groups (0·57 ± 0·04) was significantly lower than that of the PBS+TNBS group (1·37 ± 0·06) (P < 0·001). There was no significant difference between HT‐TsKaSPI+TNBS (1·15 ± 0·13) and PBS+TNBS groups (P > 0·05), and the TsKaSPI+TNBS and TsAdSPI+TNBS groups were significantly lower than that of the HT‐TsKaSPI+TNBS group (P < 0·01). At the same time, the HT‐TsKaSPI+PBS (0·39 ± 0·03), TsKaSPI+PBS (0·48 ± 0·05) and TsAdSPI+PBS (0·50 ± 0·05) groups were significantly higher than the control group (0·27 ± 0·03) (P < 0·01), and significantly lower than the PBS+TNBS group (P < 0·001). Meanwhile, MPO activity in the TNBS+HT‐TsKaSPI (1·16 ± 0·12) (P < 0·05), TNBS+TsKaSPI (0·80 ± 0·06) (P < 0·001) and TNBS+TsAdSPI (0·77 ± 0·06) (P < 0·001) groups were lower than that in the TNBS+PBS (1·40 ± 0·07) group in the therapy group. There were significant differences between the TNBS+HT‐TsKaSPI and TNBS+TsKaSPI, TNBS+TsAdSPI groups (P < 0·01). The PBS+HT‐TsKaSPI (0·38 ± 0·03) (P < 0·05), PBS+TsKaSPI (0·46 ± 0·03) (P < 0·001) and PBS+TsAdSPI (0·40 ± 0·05) (P < 0·01) groups were also higher than the control group (0·29 ± 0·03), and significantly lower than the PBS+TNBS group (P < 0·001) (Fig. 4).
Figure 4.
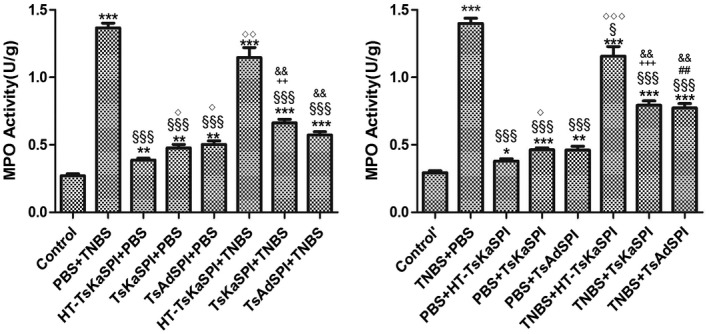
Myeloperoxidase (MPO) activity in 16 groups. Data are shown as mean ± standard deviation (s.d.) of three mice per group. *P < 0·05, **P < 0·01, ***P < 0·001 versus control and control’ groups; § P < 0·05, §§ P < 0·01, §§§ P < 0·001 versus phosphate‐buffered saline (PBS)+2,4,6‐trinitrobenzenesulphonic acid solution (TNBS) and TNB/phosphate‐buffered saline (PBS) groups; ◇ P < 0·05, ◇◇ P < 0·01, ◇◇◇ P < 0·001 for HT‐Trichinella spiralis Kazal‐type serine protease inhibitors (TsKaSPI)+PBS versus TsKaSPI+PBS, TsAdSPI+PBS, HT‐TsKaSPI+TNBS and also for PBS+HT‐TsKaSPI versus PBS+TsKaSPI, PBS+TsAdSPI, TNBS+HT‐TsKaSPI; + P < 0·05, ++ P < 0·01, +++ P < 0·001 for TsKaSPI+TNBS versus TsKaSPI+PBS, TNBS+TsKaSPI versus PBS+TsKaSPI groups; # P < 0·05, ## P < 0·01, ### P < 0·001 for TsAdSPI+TNBS versus TsAdSPI+PBS, TNBS+TsAdSPI versus PBS+TsAdSPI groups; & P < 0·05, && P < 0·01, &&& P < 0·001 for HT‐TsKaSPI+TNBS versus TsKaSPI+TNBS, TsAdSPI+TNBS and TNBS+HT‐TsKaSPI versus TNBS+TsKaSPI, TNBS+TsAdSPI. The results of performing two‐way analysis of variance (anova) showed that there was no interaction between the two factors of enema with TNBS or PBS and intraperitoneal injection with recombinant protein or PBS.
Colonic pathological changes
Macroscopic score of colonic damage
On the seventh day after the TNBS‐induced colitis model was established, macroscopic injury of the colon showed intestinal wall oedema congestion and stenosis, forming ulceration. In severe cases, transmurality and adhesion to the surrounding tissues were observed. Mucosal and submucosal segmental hyperaemia and oedema occurred. The damage score of the PBS+TNBS group was 7·00 ± 0·33, the TNBS+PBS group was 6·78 ± 0·19, and the HT‐TsKaSPI+TNBS (5·78 ± 0·51), TNBS+HT‐TsKaSPI (6·22 ± 0·19) were lower than PBS+TNBS and TNBS+PBS groups (P < 0·05). Slight congestion and oedema and occasionally a small ulcer were observed in the TsKaSPI+TNBS (4·22 ± 0·19), TsAdSPI+TNBS (3·78 ± 0·19), TNBS+TsKaSPI (5·00 ± 0·33) and TNBS+TsAdSPI (4·78 ± 0·19) groups. These values were significantly lower than those of the PBS+TNBS and TNBS+PBS groups (P < 0·01), while the other immune protein group had only mild intestinal damage. The macroscopic score is shown in Fig. 5.
Figure 5.
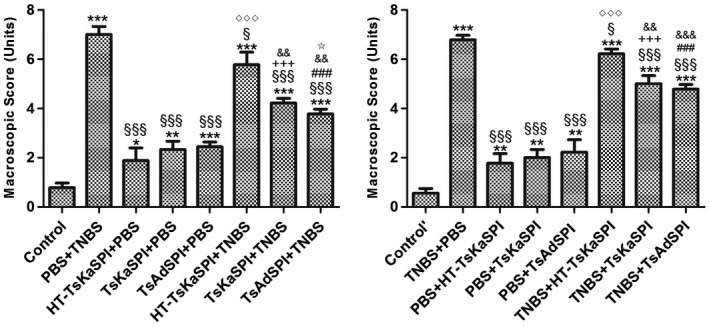
Macroscopic scores of the colons of 16 groups. Data are shown as mean ± standard deviation (s.d.) of three mice per group. *P < 0·05, **P < 0·01, ***P < 0·001 versus control and control’ groups; § P < 0·05, §§ P < 0·01, §§§ P < 0·001 versus phosphate‐buffered saline (PBS)/2,4,6‐trinitrobenzenesulphonic acid solution (TNB) and TNBS+PBS groups; ◇ P < 0·05, ◇◇ P < 0·01, ◇◇◇ P < 0·001 for HT‐ Trichinella spiralis Kazal‐type serine protease inhibitors (TsKaSPI)+PBS versus TsKaSPI+PBS, TsAdSPI+PBS, HT‐TsKaSPI+TNBS and also for PBS+HT‐TsKaSPI versus PBS+TsKaSPI, PBS+TsAdSPI, TNBS+TsKaSPI; + P < 0·05, ++ P < 0·01, +++ P < 0·001 for TsKaSPI+TNBS versus TsKaSPI+PBS, TNBS+TsKaSPI versus PBS+TsKaSPI group; # P < 0·05, ## P < 0·01, ### P < 0·001 for TsAdSPI+TNBS versus TsAdSPI+PBS, TNBS+TsAdSPI versus PBS+TsAdSPI groups; & P < 0·05, && P < 0·01, &&& P < 0·001 for HT‐TsKaSPI+TNBS versus TsKaSPI+TNBS, TsAdSPI+TNBS and TNBS+HT‐TsKaSPI versus TNBS+TsKaSPI, TNBS+TsAdSPI; ☆ < 0·01,☆☆ P < 0·01, ☆☆☆ P < 0·001 for TsKaSPI+TNBS versus TsAdSPI+TNBS, TNBS+TsAdSPI versus TNBS+TsKaSPI groups. There was no interaction between the two factors of enema with TNBS or PBS and intraperitoneal injection with recombinant protein or PBS by performing two‐way analysis of variance (anova).
Microscopic score of colonic damage
On the seventh day after the TNBS‐induced colitis model was established, inflammatory reaction symptoms, necrosis and shedding of intestinal epithelial cells, shortening and fusion of small intestine villi and infiltration of crypts were observed. Simultaneously, a large number of lymphocytes and neutrophils and varying numbers of eosinophils infiltrated into the mucosa and submucosa. The mucosal glands were not aligned or damaged (Fig. 6); the damage score of the PBS+TNBS and the TNBS+PBS groups were all 4·11 ± 0·19. The HT‐TsKaSPI+TNBS (3·56 ± 0·20), TNBS+HT‐TsKaSPI (3·56 ± 0·20) were slightly lower than the PBS+TNBS and TNBS+PBS groups (P < 0·05). However, the TsKaSPI+TNBS (2·67 ± 0·34), TsAdSPI+TNBS (2·22 ± 0·19) and TNBS+TsKaSPI (2·89 ± 0·19) and TNBS+TsAdSPI (2·67 ± 0·34) groups only exhibited mucosal lesions with infiltration of inflammatory cells and mild oedema. The microscopic damage in the above four groups were improved significantly compared with that in the PBS+TNBS and TNBS+PBS groups. The other protein‐only immunized groups also showed minimal changes in intestinal damage (Fig. 7).
Figure 6.
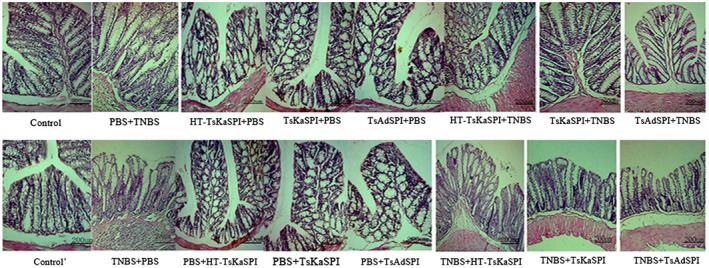
Light micrograph of haematoxylin and eosin (H&E)‐stained colonic section of sixteen groups. Scale bar represents 200 μm.
Figure 7.
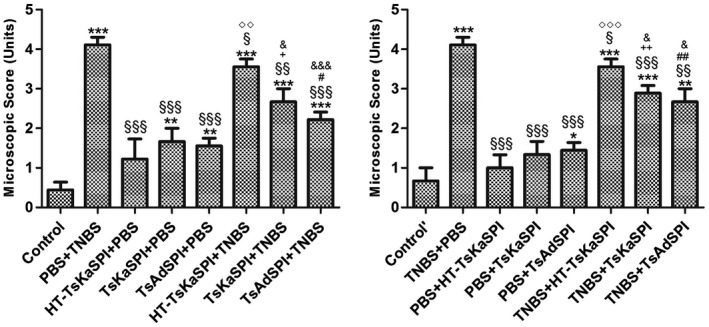
Microscopic scores of the colons of 16 groups. Data are shown as mean ± standard deviation (s.d.) of three mice per group. *P < 0·05, **P < 0·01, ***P < 0·001 versus control and control’ groups; § P < 0·05, §§ P < 0·01, §§§ P < 0·001 versus phosphate‐buffered saline (PBS)/2,4,6‐trinitrobenzenesulphonic acid solution (TNB) and TNBS+PBS groups; ◇ P < 0·05, ◇◇ P < 0·01, ◇◇◇ P < 0·001 for HT‐Trichinella spiralis Kazal‐type serine protease inhibitors (TsKaSPI)+PBS versus TsKaSPI+PBS, TsAdSPI+PBS, TsKaSPI+TNBS and also for PBS+TsKaSPI versus PBS+TsKaSPI, PBS+TsAdSPI, TNBS+TsKaSPI; + P < 0·05, ++ P < 0·01, +++ P < 0·001 for TsKaSPI+TNBS versus TsKaSPI+PBS, TNBS+TsKaSPI versus PBS+TsKaSPI groups; # P < 0·05, ## P < 0·01, ### P < 0·001 for TsAdSPI+TNBS versus TsAdSPI+PBS, TNBS+TsAdSPI versus PBS+TsAdSPI groups; & P < 0·05, && P < 0·01, &&& P < 0·001 for HT‐TsKaSPI+TNBS versus TsKaSPI+TNBS, TsAdSPI+TNBS and TNBS+HT‐TsKaSPI versus TNBS+TsKaSPI, TNBS+TsAdSPI. There was no interaction between the two factors of enema with TNBS or PBS and intraperitoneal injection with recombinant protein or PBS.
IFN‐γ and IL‐4 changes in the colon and spleen lymphocytes of mice
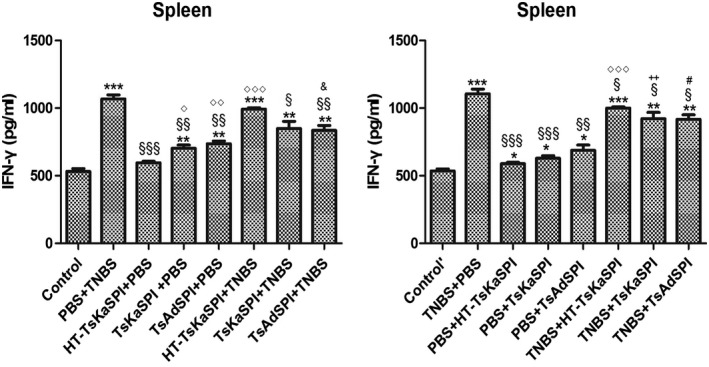
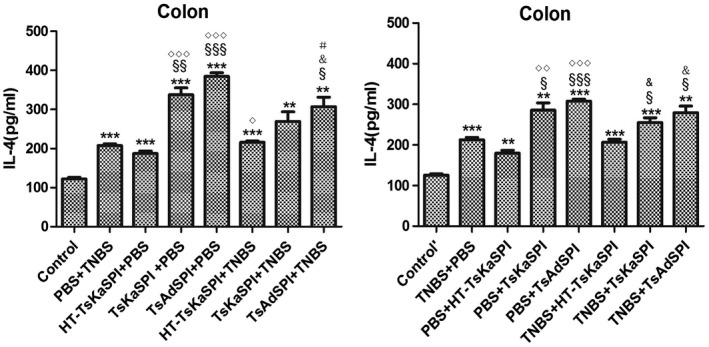
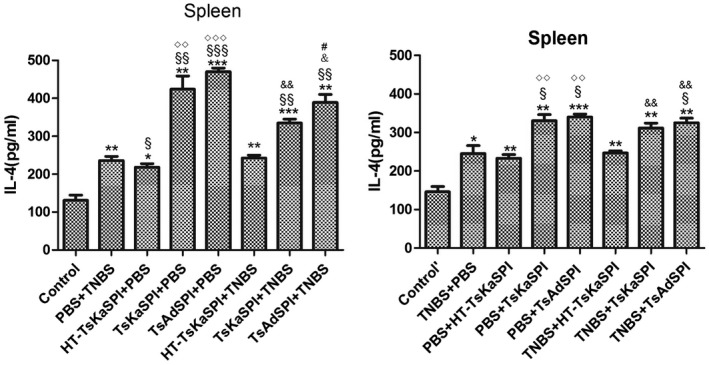
ELISA results showed that IFN‐γ levels in the colon tissue of the TsKaSPI+TNBS (776·93 ± 22·78) and TsAdSPI+TNBS (724·64 ± 38·20) groups were significantly lower than that of the PBS+TNBS group (907·05 ± 72·02) (P < 0·01) on the seventh day after modelling, and the same result was found compared to the TNBS+TsKaSPI (806·27 ± 19·26) and TNBS+TsAdSPI (744·64 ± 43·00) groups with the TNBS+PBS (922·61 ± 28·62) group (P < 0·001). There was no significant difference between the HT‐TsKaSPI+TNBS (895·62 ± 35·87) and PBS+TNBS, TNBS+HT‐TsKaSPI (904·16 ± 17·49) and TNBS+PBS groups (P > 0·05). The HT‐TsKaSPI+PBS (515·27 ± 13·22) (P < 0·05), TsKaSPI+PBS (570·72 ± 45·87) (P < 0·05) and TsAdSPI+PBS (593·04 ± 24·13) (P < 0·01) groups were all significantly higher than the control group (476·18 ± 8·95), while there was no significant difference between the PBS+HT‐TsKaSPI (507·27 ± 9·08), PBS+TsKaSPI (533·39 ± 44·63), PBS+TsAdSPI (553·04 ± 58·57) and control’ groups (484·91 ± 10·98) (P > 0·05) (Fig. 8a). Moreover, compared with the PBS+TNBS group (212·52 ± 10·21), IL‐4 expressions in the HT‐TsKaSPI+TNBS (216·03 ± 5·94) (P > 0·05), TsKaSPI+TNBS (255·30 ± 20·39) (P > 0·05) and TsAdSPI+TNBS (279·56 ± 28·09) (P < 0·05) groups increased significantly. Differences in IL‐4 expression were also observed compared to the TNBS+PBS (212·52 ± 10·21) with TNBS+TsKaSPI (255·30 ± 20·39) and TNBS+TsAdSPI (279·56 ± 28·09) groups (P < 0·05), and there was no significant difference between the PBS+TNBS and HT‐TsKaSPI+TNBS (216·03 ± 5·94), TNBS+PBS and TNBS+HT‐TsKaSPI groups (206·70 ± 12·28) (P > 0·05) (Fig. 8c). IL‐4 expression in the colon of the group with peri‐immune or immune with recombinant protein was higher than the other groups, whereas IFN‐γ expression in the PBS+TNBS and TNBS+PBS groups was higher than that of the other groups. The trends of IFN‐γ and IL‐4 expression in the splenic lymphocytes were similar (Fig. 8b,d).
Figure 8.
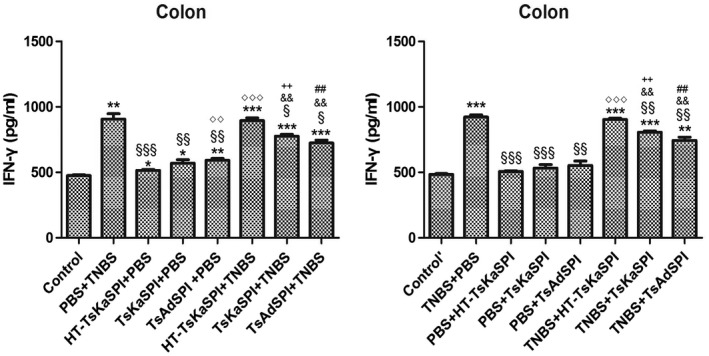
Interferon (IFN)‐γ concentration in the colon homogenate supernatants (a) and spleen lymphocyte single‐cell suspension (b) was tested by using enzyme‐linked immunosorbent assay (ELISA). IFN‐γ concentration increased in phosphate‐buffered saline (PBS)/2,4,6‐trinitrobenzenesulphonic acid solution (TNB) and TNBS+PBS groups and decreased in Trichinella spiralis Kazal‐type serine protease inhibitors (TsKaSPI)+TNBS, TsAdSPI+TNBS and TNBS+TsKaSPI, TNBS+TsAdSPI groups. Interleukin (IL)‐4 concentration in the colon homogenate supernatants (c) and spleen lymphocyte single cell suspension (d) was tested. IL‐4 level decreased in the PBS+TNBS and TNBS+PBS groups and increased in TsKaSPI+TNBS, TsAdSPI+TNBS, TNBS+TsKaSPI and TNBS+TsAdSPI groups. Data are shown as mean ± standard deviation (s.d.) of three mice per group. *P < 0·05, **P < 0·01, ***P < 0·001 versus control and control’ groups; § P < 0·05, §§ P < 0·01, §§§ P < 0·001 versus PBS+TNBS and TNBS+PBS groups; ◇ P < 0·05, ◇◇ P < 0·01, ◇◇◇ P < 0·001 for HT‐TsKaSPI+PBS versus TsKaSPI+PBS, TsAdSPI+PBS, HT‐TsKaSPI+TNBS and also for PBS+HT‐TsKaSPI versus PBS+TsKaSPI, PBS+TsAdSPI, TNBS+HT‐TsKaSPI; + P < 0·05, ++ P < 0·01, +++ P < 0·001 for TsKaSPI+TNBS versus TsKaSPI+PBS, TNBS+TsKaSPI versus PBS+TsKaSPI groups; # P < 0·05, ## P < 0·01, ### P < 0·001 for TsAdSPI+TNBS versus TsAdSPI+PBS, TNBS+TsAdSPI versus PBS+TsAdSPI groups; & < 0·05, && P < 0·01, &&& P < 0·001 for HT‐TsKaSPI+TNBS versus TsKaSPI+TNBS, TsAdSPI+TNBS and TNBS+LPS versus TNBS+TsKaSPI, TNBS+TsAdSPI. There was no interaction between the two factors of enema with TNBS or PBS and intraperitoneal injection with recombinant protein or PBS.
NF‐κB expression changes in colon tissues
In the prevention group, NF‐κB expression in the PBS+TNBS group was significantly higher than that in the other groups except the HT‐TsKaSPI+TNBS group (P < 0.01). However, the difference between the TsKaSPI+TNBS and TsAdSPI+TNBS groups was not significant (P > 0·05), but the expression of the TsKaSPI+TNBS and TsAdSPI+TNBS groups were significantly lower than the HT‐TsKaSPI+TNBS group (P < 0·05). In the therapy group, compared with the TNBS+HT‐TsKaSPI, TNBS+TsKaSPI, TNBS+TsAdSPI with TNBS+PBS groups, there was only a significant difference between the TNBS+TsAdSPI and TNBS+PBS groups (P < 0·01) (Fig. 9).
Figure 9.
The representative gel of Western blotting is shown in (a), and the graph of the quantified band density is also shown in (b). The expression of nuclear factor kappa B (NF‐κB) in colon tissues of phosphate‐buffered saline (PBS)/2,4,6‐trinitrobenzenesulphonic acid solution (TNB) group significantly higher than Trichinella spiralis Kazal‐type serine protease inhibitors (TsKaSPI)+TNBS and TsAdSPI+TNBS groups. The similar result was found in the large therapy group. *P < 0·05, **P < 0·01, ***P < 0·001 versus control and control’ groups; § P < 0·05, §§ P < 0·01, §§§ P < 0·001 versus PBS+TNBS and TNBS+PBS groups; ◇ P < 0·05, ◇◇ P < 0·01, ◇◇◇ P < 0·001 for HT‐TsKaSPI+PBS versus TsKaSPI+PBS, TsAdSPI+PBS, HT‐TsKaSPI+TNBS and also for PBS+HT‐TsKaSPI versus PBS+TsKaSPI, PBS+TsAdSPI, TNBS+TsKaSPI; + P < 0·05, ++ P < 0·01, +++ P < 0·001 for TsKaSPI+TNBS versus TsKaSPI+PBS, TNBS+TsKaSPI performing two‐way analysis of variance (anova) versus the PBS+TsKaSPI group; # P < 0·05, ## P < 0·01, ### P < 0·001 for TsAdSPI+TNBS versus TsAdSPI+PBS, TNBS+TsAdSPI versus PBS+TsAdSPI groups; & P < 0·05, && P < 0·01, &&& P < 0·001 for HT‐TsKaSPI+TNBS versus TsKaSPI+TNBS, TsAdSPI+TNBS and TNBS+HT‐TsKaSPI versus TNBS+TsKaSPI, TNBS+TsAdSPI. There was no interaction between the two factors of enema with TNBS or PBS and intraperitoneal injection with recombinant protein or PBS.
Changes in the percentage of CD4+CD25+FoxP3+ Treg cells in the spleen and MLN
The mice were killed on the seventh day after TNBS modelling. The spleen and MLN of each group were used to prepare the cell suspension. The CD4+CD25+FoxP3+ Treg cells in the spleen and MLN were detected using FCM (Fig. 10). In the spleen, the percentage of CD4+CD25+FoxP3+ Treg cells in CD4+ T lymphocytes in the PBS+TNBS (10·77 ± 1·15) group was significantly lower than that in the TsKaSPI+TNBS (14·77 ± 0·59) and TsAdSPI+TNBS (16·23 ± 0·27) groups (P < 0·01) and there was no difference between the PBS+TNBS and HT‐TsKaSPI+TNBS (11·54 ± 0·55) groups (Fig. 11a). Comparing the TNBS+PBS with TNBS+HT‐TsKaSPI, TNBS+TsKaSPI and TNBS+TsAdSPI groups showed that the percentage of CD4+CD25+FoxP3+ Treg cells in CD4+ T lymphocytes in the TNBS+TsKaSPI (13·06 ± 0·46) (P < 0·05) and TNBS+TsAdSPI groups (14·28 ± 0·47) (P < 0·01) increased significantly compared with that of the TNBS+PBS group (9·16 ± 1·45), and there was no difference between the TNBS+HT‐TsKaSPI (9·98 ± 0·90) and TNBS+PBS groups (P > 0·05), and the percentage of CD4+CD25+FoxP3+ Treg in CD4+ T lymphocytes in the TNBS+TsKaSPI and TNBS+TsAdSPI groups was lower than that of the TsKaSPI+TNBS and TsAdSPI+TNBS groups. A similar trend was observed in the percentage of CD4+CD25+FoxP3+ Treg cells in CD4+ T lymphocytes in MLNs (Fig. 11b).
Figure 10.
Demonstration of the gating strategy for the flow cytometric analysis of mouse CD4+CD25+forkhead box protein 3 (FoxP3)+ regulatory T cells (Treg) from spleens and mesenteric lymph node (MLN). In this experiment a single‐cell suspension was prepared from the spleen and MLN of each group of mice and stained with CD4 [fluorescein isothiocyanate (FITC)], CD25 [allophycocyanin (APC)] and FoxP3 [phycoerythrin (PE)] based on surface and intracellular staining protocols, respectively. Data were collected with fluorescence activated cell sorter (FACS)Diva flow cytometer and analysed. Lymphocytes are identified by their scatter properties [forward (FSC)‐A × side‐scatter (SSC)‐A plot]. Regulatory T cell (Treg) subpopulations were characterized by CD4 and CD25 surface expression and intracellular FoxP3 staining.
Figure 11.
The percentage of CD4+CD25+forkhead box protein 3 (FoxP3)+ regulatory T cell (Treg) cells in CD4+ T lymphocytes in spleens (a) and MLNs (b) of 16 groups. Data are shown as mean ± standard deviation (s.d.) of three mice per group. *P < 0·05, **P < 0·01, ***P < 0·001 versus control and control’ groups; § P < 0·05, §§ P < 0·01, §§§ P < 0·001 versus phosphate‐buffered saline (PBS)/2,4,6‐trinitrobenzenesulphonic acid solution (TNB) and TNBS+PBS groups; △ P < 0·05, △△ P < 0·01, △△△ P < 0·001 for Trichinella spiralis Kazal‐type serine protease inhibitors (TsKaSPI)+PBS versus TsAdSPI+PBS and PBS+TsKaSPI versus PBS+TsAdSPI groups; ◇ P < 0·05, ◇◇ P < 0·01, ◇◇◇ P < 0·001 for HT‐TsKaSPI+PBS versus TsKaSPI+PBS, TsAdSPI+PBS, HT‐TsKaSPI+TNBS and also for PBS+HT‐TsKaSPI versus PBS+TsKaSPI, PBS+TsAdSPI, TNBS+HT‐TsKaSPI; + P < 0·05, ++ P < 0·01, +++ P < 0·001 for TsKaSPI+TNBS versus TsKaSPI+PBS, TNBS+TsKaSPI versus PBS+TsKaSPI groups; # P < 0·05, ## P < 0·01, ### P < 0·001 for TsAdSPI+TNBS versus TsAdSPI+PBS, TNBS+TsAdSPI versus PBS+TsAdSPI groups; & P < 0·05, && P < 0·01, &&& P < 0·001 for HT‐TsKaSPI+TNBS versus TsKaSPI+TNBS, TsAdSPI+TNBS and TNBS+HT‐TsKaSPI versus TNBS+TsKaSPI, TNBS+TsAdSPI; ☆ P < 0·01,☆☆ P < 0·01, ☆☆☆ P < 0·001 for TsKaSPI+TNBS versus TsAdSPI+TNBS, TNBS+TsAdSPI versus TNBS+TsKaSPI groups. The two‐way results showed that there was no interaction between the two factors of enema with TNBS or PBS and intraperitoneal injection with recombinant protein or PBS.
Discussion
Parasite and parasite products exert an intervening effect on the occurrence and development of IBD. In 2009, Ruyssers et al. [17] proposed that worm‐soluble proteins exhibit a potential therapeutic effect on TNBS‐induced mouse colitis. In 2013, Ferreira et al. [18] found that the hookworm excretion/secretion products exert an inhibitory effect on a mouse colitis model. In 2014, Yang et al. [19] demonstrated that the T. spiralis adult worm excretion/secretion products relieved the severity of inflammation induced by DSS in a mouse colitis model. In 2014, Heylen et al. [20] confirmed that a Schistosoma mansoni protein can reduce the severity of experimental chronic colitis. Nevertheless, the effect of parasitic serine protease inhibitor intervention on TNBS‐induced colitis has not yet been reported. The aim of this experiment was to investigate the role of two recombinant T. spiralis serine protease inhibitors in a TNBS‐induced mouse colitis model.
The experimental results showed that the mice treated with TsKaSPI and TsAdSPI exhibited lessened the degree of intestinal damage, reduced DAI and MPO activity and ameliorated intestinal inflammation symptoms compared with the PBS+TNBS and TNBS+PBS groups. Thus, TsKaSPI and TsAdSPI can relieve TNBS‐induced colitis.
T.s SPI is expressed in adults, newborn larvae, pre‐implantation larvae and muscle larvae of T. spiralis, but the expression level and expression site are different. High levels of prokaryotic expression of recombinant proteins often form inclusion bodies in E. coli, and are problematic in the follow‐up purification of active soluble protein. Gao et al. [21] established a new cost‐effective method for purification of the recombinant protein; the experimental results proved that the KCl staining gel purification protein method of preparation protein can maintain its original antigenicity and can cause a complete immune response in mice. Therefore, our experiment selected this method to prepare recombinant proteins. The activity inhibition assay result showed that the TsKaSPI recombinant protein can inhibit the activity of intestinal digestive enzymes such as trypsin, chymotrypsin and elastase, and protect the worm from host digestive enzymes. Cathepsin G is the main component of neutrophil release at the site of inflammation and TsKaSPI can inhibit cathepsin G, indicating that TsKaSPI is closely related to inflammatory response; TsKaSPI inhibits thrombin activity, which indicates that it can inhibit haemagglutination. The activity inhibition assay of TsAdSPI recombinant protein showed that the recombinant protein could inhibit the trypsin, elastase and chymotrypsin involved in digestion, and the inhibition efficiency was 88, 72 and 42%, respectively. As both proteins are expressed in E. coli, E. coli‐expressed proteins nearly always have high levels of endotoxin, so a control protein which is inactive but expressed in a similar system should be used to show that the target proteins rather than contaminants therein mediate the effects. Therefore, the recombinant protein was boiled for 10 min to inactivate the protein to confirm whether lipopolysaccharide (LPS) in E. coli also had an effect on the experimental results. Meanwhile, obvious symptoms were shown 24 h after the colitis model was established. Therefore, the mice were immunized with the protein 24 h after the modelling and boosted once after 48 h.
T.s SPI induces the body to produce a Th2‐type mixed Th1/Th2 immune response, down‐regulates proinflammatory cytokine expression and up‐regulates anti‐inflammatory cytokine expression. In the TNBS‐induced CD model, local intestinal mucosal dysregulation is accompanied by systemic immune dysfunction, low expression of the anti‐inflammatory cytokine IL‐4 and high expression of the proinflammatory cytokine IFN‐γ. As a result, disease development is promoted [22, 23]. TsKaSPI and TsAdSPI can ameliorate CD possibly by balancing the Th1 and Th2 immune responses. Th1 cells mainly secrete IL‐2, IFN‐γ, IFN‐α and tumour necrosis factor (TNF)‐β. Th2 cells mainly secrete IL‐4, IL‐5, IL‐6 and IL‐10. In this experiment, IFN‐γ was selected as a representative of Th1‐type cytokines and IL‐4 as a representative of Th2‐type cytokines.
ELISA results showed that HT‐TsKaSPI immunization increased the expression of IFN‐γ and IL‐4, but the increase of IL‐4 was more significant than IFN‐γ. The expression of IFN‐γ and IL‐4 in the HT‐TsKaSPI+TNBS and TNBS+HT‐TsKaSPI were similar to the PBS+TNBS and TNBS+PBS groups. Thus, this proved that the effect of immune HT‐TsKaSPI on the experimental results is weak. TsKaSPI and TsAdSPI immunization reduced the IFN‐γ expression and increased the IL‐4 expression in mice with TNBS‐induced colitis, indicating that TsKaSPI and TsAdSPI shifted the CD‐induced mucosal immune response from Th1 to Th2. As a result, the intensity of the Th1‐type immune response was reduced, and the expression of proinflammatory cytokines decreased simultaneously and the expression of anti‐inflammatory cytokines increased. Thus, intestinal inflammation was relieved. These findings were consistent with the expected experimental results.
NF‐κB is a key transcription factor in the intestinal inflammatory response. The transcriptional levels of cytokines (such as TNF‐α, IL‐6, IL‐8) that play a key role in IBD are regulated by NF‐κB. Activated NF‐κB promotes the expression of various proinflammatory cytokines, increases the recruitment of inflammatory cells and plays an important role in intestinal mucosal dysregulation and cellular signal transduction in the intestinal inflammation of IBD [23, 24]. Western blotting results showed that the NF‐κB expression in the colon tissue of the PBS+TNBS group was significantly higher than that of the control TsKaSPI+TNBS and TsAdSPI+TNBS groups in the prevention group, and in the therapy group, there was only a difference between the TNBS+TsAdSPI and TNBS+PBS group. Compared the HT‐TsKaSPI+TNBS and PBS+TNBS and TNBS+HT‐TsKaSPI and TNBS+PBS groups, there was no significant difference, indicating that immunization with HT‐TsKaSPI had almost no effect on the experimental results. This result indicated that the over‐activation of NF‐κB aggravated the intestinal inflammation symptoms and SPI immunization can reduce the activation of NF‐κB. As a result, the secretion of proinflammatory cytokines was reduced and the intestinal inflammation was relieved.
The development of IBD is also associated with a large number of intestinal mucosal immune regulatory cells, in which the role of Treg cells in IBD is receiving increasing attention. Tregs are a group of T cell subsets with immunomodulatory functions; they can inhibit the activation and function of other immune cells and participate in the regulation of autoimmune diseases. Decreased numbers and dysfunctionalities of Treg cells can lead to the development of autoimmune diseases [25, 26]. FoxP3 is the core transcription factor that regulates the development and differentiation of Treg cells and can be expressed specifically in CD4+CD25+ Treg cells in the thymus and peripheral blood; it plays a key role in the expression, maturation and function of CD4+CD25+ Treg cells [27]. Only the CD4+CD25+ Treg cells that express FoxP3 exert immunomodulatory effects [28, 29]. Therefore, FoxP3 serves as a marker for identifying Treg cells.
Results showed that the percentage of CD4+CD25+Foxp3+ Treg cell in CD4+ T lymphocytes in the gate in the spleen of the PBS+TNBS group and TNBS+PBS group were significantly lower than those of the control group and control’ group. The percentage of CD4+CD25+FoxP3+ Treg cells in the TsKaSPI+TNBS and TsAdSPI+TNBS groups were higher than those of the PBS+TNBS group, and compared with the TNBS+TsKaSPI and TNBS+TsAdSPI with the TNBS+PBS group showed the same result. The percentage of CD4+CD25+FoxP3+ cells of the PBS+TsKaSPI and PBS+TsAdSPI groups was significantly lower than that of the TsKaSPI+PBS and TsAdSPI+PBS groups, we think this may be due to the fact that immunization with proteins at 24 and 48 h after colitis model establishment did not produce sufficient stimulation of the immune system. Initially, we believe that the effect of TsKaSPI and TsAdSPI interventions on IBD depends directly upon FoxP3+ Treg cells. There was no significant difference comparing the HT‐TsKaSPI+PBS and PBS+HT‐TsKaSPI groups with control and control’ groups, so the effect of LPS on the percentage of CD4+CD25+FoxP3+ Treg cells in CD4+ T lymphocytes could be excluded. Moreover, the overall trend of the percentage of CD4+CD25+FoxP3+ Treg cells in the MLN was similar to that of the spleen, but those in the MLN were higher overall than those in the spleen.
TsKaSPI and TsAdSPI was demonstrated to relieve IBD. In this experiment, the protective and therapeutic role of TsKaSPI and TsAdSPI in a mouse model of IBD was preliminarily studied. For autoimmune diseases with complex and diverse mechanisms, we need to study in more depth the mechanism of action of TsKaSPI and TsAdSPI from various aspects, which is conducive to the development of new and effective worm‐derived proteins/pharmaceuticals.
Discussion
Overall, TsKaSPI and TsAdSPI caused the body to produce a Th2‐type‐based immune response, increased IL‐4 expression, decreased IFN‐γ expression and decreased expression of NF‐κB in colon tissue. In addition, the percentage of CD4+CD25+FoxP3+ cells in the spleen and MLN increased. Therefore, TsKaSPI and TsAdSPI can relieve the intestinal inflammation of TNBS‐induced Th1‐type CD.
Disclosures
The authors declare that they have no competing interests.
Acknowledgements
We would like to thank all the staff members who provided laboratory assistance. This work was supported by the National Natural Science Foundation of China (31372427), The National Key Research and Development Program of China (2017YFD0501200) and Heilongjiang Province Natural Science Foundation of China (C2016030).
References
- 1. Blumberg RS, Strober W. Prospects for research in inflammatory bowel disease. JAMA 2001; 285:643–7. [DOI] [PubMed] [Google Scholar]
- 2. Braegger CP, Macdonald TT. Immune mechanisms in chronic inflammatory bowel disease. Ann Allergy 1994; 72:135–41. [PubMed] [Google Scholar]
- 3. Gettins PG. Serpin structure, mechanism and function. Chem Rev 2002; 102:4751–804. [DOI] [PubMed] [Google Scholar]
- 4. Maizels RM, Gomez‐Escobar N, Gregory WF, Murray J, Zang X. Immune evasion genes from filarial nematodes. Int J Parasitol 2001; 31:889–98. [DOI] [PubMed] [Google Scholar]
- 5. Zang X, Maizels RM. Serine proteinase inhibitors from nematodes and the arms race between host and pathogen. Trends Biochem Sci 2001; 26:191–97. [DOI] [PubMed] [Google Scholar]
- 6. Jiravanichpaisal P, Lee BL, Söderhäll K. Cell‐mediated immunity in arthropods: hematopoiesis, coagulation, melanization and opsonization. Immunobiology 2006; 211:213–36. [DOI] [PubMed] [Google Scholar]
- 7. Cao JX, Dai JQ, Dai ZM, Yin GL, Yang WJ. A male‐reproduction related Kazal‐type peptidase inhibitor gene in the prawn, Macrobrachium rosenbergii: molecular characterization and expression patterns. Mar Biotechnol 2007; 9:45–55. [DOI] [PubMed] [Google Scholar]
- 8. Molehin AJ, Gobert GN, McManus DP. Serine protease inhibitors of parasitic helminths. Parasitology 2012; 139:681–95. [DOI] [PubMed] [Google Scholar]
- 9. Huntington JA. Serpin structure, function and dysfunction. J Thromb Haemost 2011; 9:26–34. [DOI] [PubMed] [Google Scholar]
- 10. Nagano I, Wu Z, Nakada T, Matsuo A, Takahashi Y. Molecular cloning and characterization of a serine proteinase inhibitor from Trichinella sprialis . J Parasitol 2001; 123:77–83. [DOI] [PubMed] [Google Scholar]
- 11. Macen JL, Upton C, Nation N, McFadden G. A serine proteinase inhibitor encoded by myxoma virus, is a secreted glycoprotein that interferes with inflammation. Virology 1993; 195:348–63. [DOI] [PubMed] [Google Scholar]
- 12. Yenbutr P, Scott AL. Molecular cloning of a serine proteinase inhibitor from Brugia malayi . Infect Immun 1995; 63:1745–53. [DOI] [PMC free article] [PubMed] [Google Scholar]
- 13. Carrell RW, Stein PE, Fermi G, Wardell MR. Biological implications of a 3 A structure of dimeric antithrombin. Structure 1994; 2:257–70. [DOI] [PubMed] [Google Scholar]
- 14. Hong XQ, Mejia J, Kumar S, Perler FB, Carlow CK. Cloning and expression of Di T33 from Dirofilaria immitis: a specific and early marker of heart worm infection. Parasitology 1996; 112:331–8. [DOI] [PubMed] [Google Scholar]
- 15. Stallmach A, Marth T, Weiss B et al An interleukin 12 p40‐Ig G2b fusion protein abrogates T cell mediated inflammation: anti‐inflammatory activity in Crohn’s disease and experimental colitis in vivo . Gut 2004; 53:339–45. [DOI] [PMC free article] [PubMed] [Google Scholar]
- 16. Wallace JL, Keenan CM. An orally active inhibitor of leukotriene synthesis accelerates healing in a rat model of colitis. Am J Physiol 1990; 258:G527–534. [DOI] [PubMed] [Google Scholar]
- 17. Ruyssers NE, De Winter BY, De Man JG et al Therapeutic potential of helminth soluble proteins in TNBS‐induced colitis in mice. Inflamm Bowel Dis 2009; 15:491–500. [DOI] [PubMed] [Google Scholar]
- 18. Ferreira I, Smyth D, Gaze S et al Hookworm excretory/secretory products induce interleukin‐4 (IL‐4) + IL‐10 + CD4 + T cell responses and suppress pathology in a mouse model of colitis. Infection and Immune 2017; 106:2065. [DOI] [PMC free article] [PubMed] [Google Scholar]
- 19. Yang X, Yang Y, Wang Y et al. Excretory/secretory products from Trichinella spiralis adult worms ameliorate DSS‐induced colitis in mice. PLOS ONE 2014; 9:e96454. [DOI] [PMC free article] [PubMed] [Google Scholar]
- 20. Heylen M, Ruyssers NE, De Man JG et al Worm proteins of Schistosoma mansoni reduce the severity of experimental chronic colitis in mice by suppressing colonic proinflammatory immune responses. PLOS ONE 2014; 9:e110002. [DOI] [PMC free article] [PubMed] [Google Scholar]
- 21. Gao SY, Chan EH, Wang J. A method of purifying prokaryotic expression protein with ‘high cost performance’. Chin Agric Sci Bull 2010; 26:24–6. [Google Scholar]
- 22. Akazawa A. Increased expression of tumor necrosis factor‐alpha messenger RNA in the intestinal mucosa of inflammatory bowel disease, particularly in patients with disease in the active phase. Oastroenterol 2002; 37:345. [DOI] [PubMed] [Google Scholar]
- 23. Indaram AV, Visvalingam V, Locke M, Bank S. Mucosal cytokine production in radiation‐induced moiditis compared with inflammatory bowel disease. Am J Gastroenterol 2000; 95:1221–25. [DOI] [PubMed] [Google Scholar]
- 24. Karin M, Yamamoto Y, Wang QM. The IKK NF‐kappa B system: a treasure trove for drug development. Nat Rev Drug Discov 2004; 3:17–26. [DOI] [PubMed] [Google Scholar]
- 25. Tak PP, Firestein GS. NF‐kappaB: a key role in inflammatory diseases. Clin Invest 2001; 107:7–11. [DOI] [PMC free article] [PubMed] [Google Scholar]
- 26. Hsieh CS, Lee HM, Lio CW. Selection of regulatory T cells in the thymus. Nat Rev Immunol 2012; 12:157–67. [DOI] [PubMed] [Google Scholar]
- 27. Josefowicz SZ, Lu LF, Rudensky AY. Regulatory T cells: mechanisms of differentiation and function. Annu Rev Immunol 2012; 30:532–64. [DOI] [PMC free article] [PubMed] [Google Scholar]
- 28. Kamikozuru K, Fukunagak K, Hirota S et al The expression profile of functional regulatory T cells, CD4+CD25high+/Foxp3+, in patients with ulcerative colitis during active and quiescent disease. Clin Exp Immunol 2009; 156:320–7. [DOI] [PMC free article] [PubMed] [Google Scholar]
- 29. Fontenot JD, Rudensky AY. A well adapted regulatory contrivance: regulatory T cell development and the forkhead family transcription factor Foxp3. Nat Immunol 2005; 6:331–7. [DOI] [PubMed] [Google Scholar]