Abstract
Despite its importance to reproduction, certain mechanisms of early ovarian development remain a mystery. To improve our understanding, we constructed the first cell-based computational model of ovarian development in mice that is divided into two phases: Phase I spans embryonic day 5.5 (E5.5) to E12.5; and Phase II spans E12.5 to postnatal day 2. We used the model to investigate four mechanisms: in Phase I, (i) whether primordial germ cells (PGCs) undergo mitosis during migration; and (ii) if the mechanism for secretion of KIT ligand from the hindgut resembles inductive cell–cell signaling or is secreted in a static manner; and in Phase II, (iii) that changes in cellular adhesion produce germ cell nest breakdown; and (iv) whether localization of primordial follicles in the cortex of the ovary is due to proliferation of granulosa cells. We found that the combination of the first three hypotheses produced results that aligned with experimental images and PGC abundance data. Results from the fourth hypothesis did not match experimental images, which suggests that more detailed processes are involved in follicle localization. Phase I and Phase II of the model reproduce experimentally observed cell counts and morphology well. A sensitivity analysis identified contact energies, mitotic rates, KIT chemotaxis strength, and diffusion rate in Phase I and oocyte death rate in Phase II as parameters with the greatest impact on model predictions. The results demonstrate that the computational model can be used to understand unknown mechanisms, generate new hypotheses, and serve as an educational tool.
Keywords: ovarian development, computational model, ovary, cell-based model, mice, developmental biology
Summary Sentence
We have constructed a cell-based model that simulates the signaling and morphological development involved in early ovarian development in mice, from first detection of primordial germ cells to formation of primordial follicles.
Introduction
The ovary is crucial for female mammalian reproduction, supporting the growth and maturation of viable eggs. Proper development of the ovary, therefore, is necessary for normal ovarian function during reproductive maturity. Abnormal ovarian development may lead to adverse reproductive consequences, such as improper development of ovarian follicles, which could result in female infertility [1]. In mammals, early ovarian development occurs predominantly during the fetal period and plays a large role in the health and longevity of the female reproductive lifespan.
Early ovarian development, like many developmental processes, is driven by several molecular signaling pathways, which are dependent on the expression of select proteins [2]. In mice, development of germ cells, which are vital for normal ovarian function, begin on embryonic day 5.5 (E5.5) with the first detection of primordial germ cells (PGCs) in the embryo [3]. PGCs remain in the posterior region of the embryo, and undergo mitosis until migration via chemotaxis signaled by SDF1 and KIT ligand; on E8.5 e-cadherin expression decreases and SDF1 and KIT ligand expression increases from the gonadal ridge and hindgut epithelial cells, respectively [4–6]. It is generally accepted that PGCs undergo mitosis during migration to the gonadal ridge [5–7]; however, Seki et al. [8] alternatively proposed that PGCs hault the cell cycle in the G2 phase during migration. The mechanism of KIT ligand signaling is also unknown; i.e., whether KIT ligand is secreted continuously by all hindgut epithelial cells simultaneously, or if KIT ligand is secreted by hindgut epithelial cells sequentially on a spatial level from the posterior to the anterior, similar to inductive signaling.
Upon PGC arrival at the gonadal ridge between E10.5 and E12.5, migration halts and PGCs undergo a period of rapid proliferation and develop into oocytes when they arrest in the diplotene stage of meiosis [9]. Expression of sex differentiation factors also begins when PGCs arrive at the gonadal ridge. Formation of germ cell nests begins on E13.5 [10, 11]. By E14.5, apoptotic processes are turned on and the abundance of oocytes steadily declines [11]. Shortly before the formation of primordial follicles, germ cell cysts fragment and reassociate with other cysts [10]. Beginning E17.5, germ cell nests break down and primordial follicles begin to form [12, 13]. The mechanism for nest breakdown is unknown but associated with a decline in maternal estrogen [14]. The formation of primordial follicles is the final stage of our early ovarian development model.
Though proper development of the ovary is crucial for normal reproduction, certain mechanisms involved in early ovarian development are still unknown. The importance and contribution of multiple molecular signaling pathways active in early ovarian development can be understood by combining information from studies about distinct ovarian development processes. A computational model can then be used as a theoretical framework to bring together these studies into a holistic view, and could be used to predict the effects of toxicant exposure on the ovary [15].
Existing computational models for normal reproduction focus on various biological functions using a variety of model platforms: TableCurve-2D, R, and MATLAB. For example, Wallace and Kelsey [16] developed a model predicting the ovarian follicle pool over a woman's lifespan. Uslu et al. [17] created a model of ovarian follicle population dynamics, which simulates the survival or atresia of follicles. Iber and Geyter [18] constructed a bovine model of the spatial-temporal growth of ovarian follicles and the associated hormonal signaling under normal conditions. In the bovine model, data on multiple processes involved in folliculogenesis were combined to create a holistic model. Though many models of reproduction and related processes in mammals exist, there are no models of normal early ovarian development for any species.
Modeling early ovarian development requires a cell-based model because developmental processes occur at the cellular level (e.g., cellular proliferation, migration, formation of germ cell nests, and primordial follicles), and cannot be simplified to a broader biological scale. For example, formation and breakdown of germ cell nests and formation of primordial follicles involve the interactions of individual oocytes and granulosa cells. We therefore selected CompuCell3D (CC3D) [19] software to model these processes. CC3D is based on a Cellular Potts Model [20] that incorporates a Monte Carlo method to model single-cell behavior stochastically. Specifications of cellular behaviors (e.g., mitotic rates, cellular adhesion) are defined by functions in the model, either as predefined CC3D functions or user-customized scripts written for specific processes. In this study, we describe a cell-based computational model of early ovarian development in mice, which is the first model of its kind.
Materials and methods
Model development
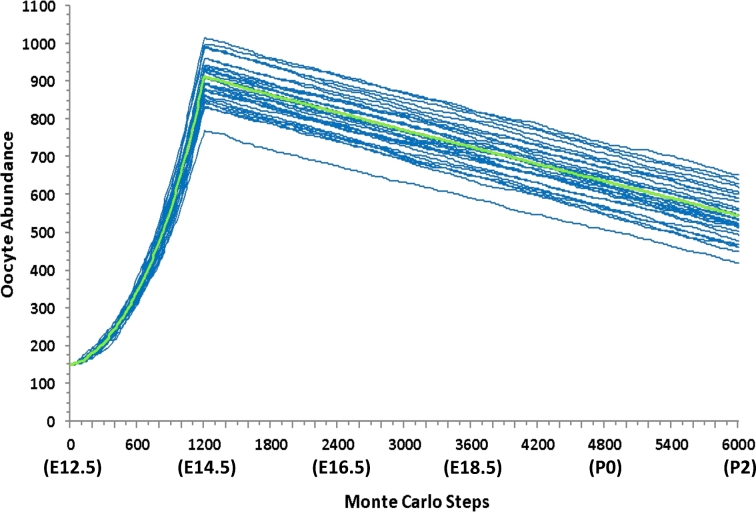
We attempted to create a single model of embryonic development from E5.5 to P2 with a focus on ovarian development. However, rapid growth of different cell populations within a defined morphology was too complicated for this first model because too many parameter values were unknown. To simplify the model, we separated it into two phases: Phase I represents the origin and migration of PGCs to the gonadal ridge, E5.5 to E12.5; and Phase II represents development of germ cells and tissues in the gonad, E12.5 to postnatal day 2 (P2). One day of development in vivo is represented by 600 Monte Carlo steps (MCS) in our CC3D model, and the time scale is consistent for both phases. The simulation length was 4200 MCS (7 days) for Phase I, and 6000 MCS (10 days) for Phase II. Phase II is meant to be a continuation of early ovarian development from Phase I, not a separate model. Simulations were run on a Mac Pro computer, with a 3.7 GHz Intel Xeon quadcore processor; Phase I took about 20 min and Phase II took 30 min. The abundance of PGCs in Phase I and oocytes in Phase II were recorded every 10 MCS with simulation snapshots taken every 150 MCS.
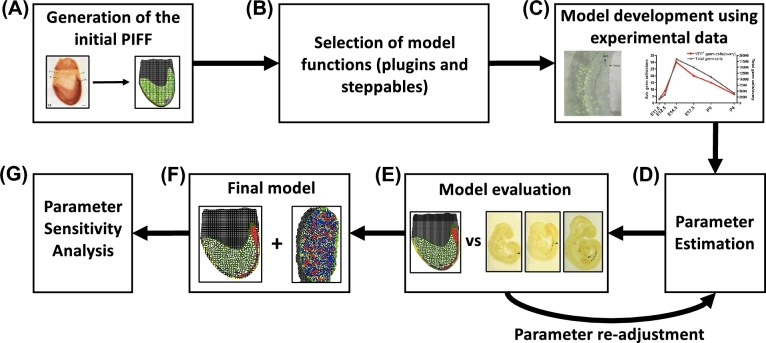
Figure 1 provides a diagram of model development for each step. Our model is two-dimensional, simulating what would be experimentally observed in a cross-section as opposed to the whole embryo or gonad. Whole-mount images were used to set up the layout of tissues and cells. We used Cell Draw, a program within CC3D, to trace the whole-mount images to map the tissues and cells that were included in the model. Cell Draw generated cell lattices in a picture interchange file format (PIFF), which is required for the CC3D model construction. Only cell types (i.e., germ cells, gonadal ridge, hindgut epithelium, hindgut, embryonic tissue, extraembryonic tissue, KIT signaling cells, granulosa cells, stromal cells, epithelial cells, mesonephros, extracellular matrix) vital to ovarian development in each phase were included in construction of the PIFF. The simulation domain size in Phase I and Phase II was 320 × 320 pixels and all cells defined in the PIFF had an initial volume of 4–6 pixels.
Figure 1.
Diagram outlining the model development process. The same process was used for the development of Phase I and Phase II of the model. (A) Tissues and cells in the starting PIFF were outlined using CellDraw from whole-mount images found in primary literature of the mouse embryo (Phase I) and the mouse gonad (Phase II). Left: A whole-mount image of a mouse embryo [21]; right: the initial PIFF for Phase I of the model. (B) Preset and customized CompuCell3D (CC3D) functions, termed plugins and steppables, were selected to describe specific biological processes and cell behavior in the model. (C) Functions’ parameter values were set using experimental data [10, 55]. (D) Estimate function parameter values to fit experimental data. (E) Evaluate model predictions by visual comparison with experimental data. If the model simulation does not resemble experimental data, repeat step D. Shown is a snapshot from Phase I of the model compared to experimental images [38]. (F) The final version of Phase I and Phase II. Shown are snapshots of Phase I (left) and Phase II (right). (G) A univariate sensitivity analysis was performed on the final parameter values selected for the model. [A colour version of this figure is available in the online version.]
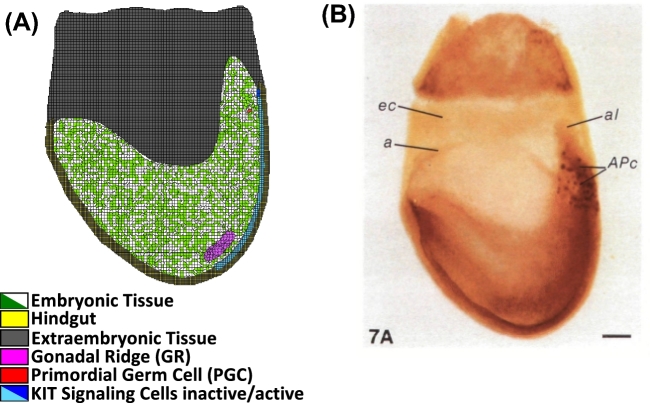
A whole-mount image of a mouse embryo on E7.5 stained with alkaline phosphatase was used for the spatial scaling of tissues and PGCs in the PIFF for Phase I (Figure 2B) [21]. For Phase II, the gonadal field in the PIFF was outlined from a whole-mount image of an XX mouse gonad on E12.5 containing a marker for follistatin (Figure 3B) [22]. Because the model was designed to represent a cross-section of the embryo or ovary, the abundance of PGCs and oocytes set in the model represents one-sixth of the total abundance reported in the literature. Phase I starts with one PGC, which is one-sixth of the reported number PGCs first observed experimentally [2, 23]. This is the smallest fraction that can be simulated, and it accounts for the fact that a cross-section of the ovary is being simulated. For Phase II, the quantity of germ cells in the PIFF was set from the average abundance of PGCs from Phase I simulation results (n = 25 simulations); granulosa and somatic cells, at a ratio of 1:2, respectively, were distributed randomly throughout the gonadal field. The cell types and tissues included in Phase I are medium, or extracellular matrix (τ0), PGCs (τ1), gonadal ridge (τ2), hindgut epithelial cells (τ3), hindgut (τ4), embryonic tissue (τ5), extraembryonic tissue (τ6), and KIT ligand signaling cells (τ7) and in Phase II are medium, or extracellular matrix (τ'0), oocyte (τ'1), granulosa cells (τ'2), stromal cells (τ'3), epithelial cells (τ'4), and mesonephros (τ'5).
Figure 2.
The initial lattice for Phase I (A) was designed from an image of a whole-mount mouse embryo (B) stained with alkaline phosphatase for PGC identification from [21] with permission. Cell types important to ovarian development from E5.5 to E12.5 were specified and identified by color: embryonic tissue (green/white), hindgut (yellow), extraembryonic tissue (gray), gonadal ridge (magenta), PGC (red), and KIT ligand signaling cells (blue). [A colour version of this figure is available in the online version.]
Figure 3.
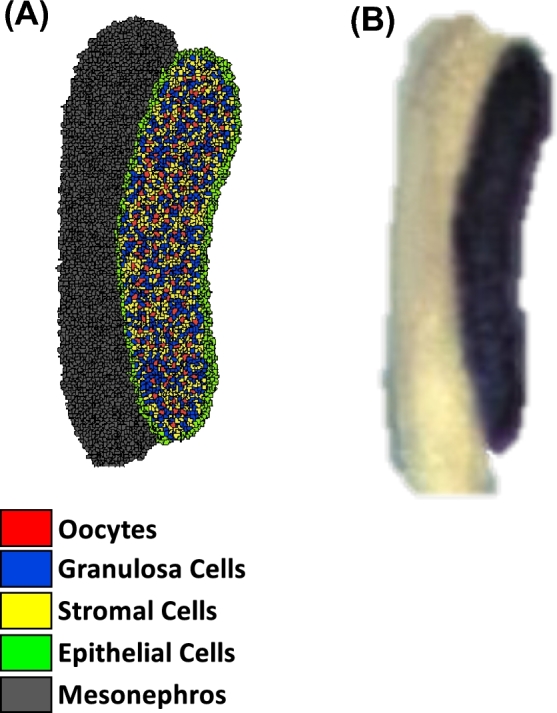
The initial lattice for Phase II (A) was designed from an image of a whole-mount XX mouse gonad (B) whole-mount ovary stained for follistatin to identify gonadal cells from [22] with permission. Cell types: oocytes (red), granulosa cells (blue), somatic cells (yellow), epithelial cells (green), and mesonephros (gray). [A colour version of this figure is available in the online version.]
CC3D provides functions (computer code/scripts) to simulate common biological processes (e.g. mitosis and chemotaxis), and allows users to write their own model functions. CC3D functions are categorized into steppables that are executed once per MCS, and plugins that are executed within a MCS to update cell volumes in the lattice. The CC3D functions used to control cell behavior in both Phase I and Phase II were the Volume Steppable, Initial Contact Energy Plugin, Contact Steering Steppable, Secretion Steppable, Diffusion Solver Steppable, and Mitosis Steppable. In Phase I, the CC3D Chemotaxis Plugin was used to simulate PGC migration. We wrote three steppables for this model: Cell Activation Steppable, Cell Death Steppable, and Cell Abundance Tracking Steppable [24]. More information about the CC3D functions can be found in Swat et al. [19].
Model parameters used for functions in Phase I are listed in Table 1 and a matrix of contact energies between cells are listed in Table 2. Contact energies describe the adhesion of cell types relative to other cell types in the simulation; a higher contact energy value indicates lower favorability for adhesion between two cell types, and a lower contact energy value indicates higher favorability for adhesion between two cell types. Similarly, for Phase II, parameters are listed in Table 3 and contact energies in Table 4. When possible, model parameters were defined a priori by experimental data. If experimental data for a model parameter could not be found, parameter values were estimated; that is, parameter values were selected to produce simulation outputs that quantitatively matched cell abundances and visually matched experimental images and descriptions.
Table 1.
Symbol, descriptions, values, references, and sensitivity rankings for model parameters in Phase I, organized by biological category.
| CC3D function | Parameter name | Parameter value | Reference | Sensitivity |
|---|---|---|---|---|
| Volume Steppable | PGC target volume | 16.5 pixels | [21] | Medium |
| Volume Steppable | PGC inverse cell compressibility | 5.0 | Estimated | Medium |
| Volume Steppable | Gonadal ridge target volume | 16.0 pixels | [21] | Medium |
| Volume Steppable | Gonadal ridge inverse cell compressibility | 5.0 | Estimated | Medium |
| Volume Steppable | KIT signaling cell target volume | 16.0 pixels | [21] | Medium |
| Volume Steppable | KIT signaling cell inverse cell compressibility | 5.0 | Estimated | Medium |
| Volume Steppable | Hindgut target volume | 16.0 pixels | [21] | Medium |
| Volume Steppable | Hindgut inverse cell compressibility | 5.0 | Estimated | Medium |
| Volume Steppable | Embryonic tissue target volume | 16.0 pixels | [21] | Medium |
| Volume Steppable | Embryonic tissue inverse cell compressibility | 5.0 | Estimated | Medium |
| Volume Steppable | Extraembryonic tissue target volume | 16.0 pixels | [21] | Medium |
| Volume Steppable | Extraembryonic tissue inverse cell compressibility | 5.0 | Estimated | Medium |
| Volume Steppable | PGC growth rate | 0.012 pixels MCS−1 | Estimated | Low |
| Volume Steppable | Cellular growth rate (not including PGC type) | 0.001 pixels MCS−1 | Estimated | Low |
| Mitosis Steppable | Mitotic rate of PGCs (300–1200 MCS) | 0.0025 MCS−1 | [23] | High |
| Mitosis Steppable | Mitotic rate of PGCs (1200–3600 MCS) | 0.0025 MCS−1 | [23] | High |
| Cell Death Steppable | PGC Death rate | All <400 μM SDF1 | Estimated | Medium |
| Cell Death Steppable | PGC Death rate coefficient | 20.0 | Estimated | Medium |
| Chemotaxis Plugin | KIT ligand chemotaxis strength coefficient for PGCS | 10.0 | Estimated | High |
| Chemotaxis Plugin | SDF1 chemotaxis strength coefficient for PGCs | 30.0 | Estimated | Medium |
| Diffusion Solver Steppable | KIT ligand Chemoattractant Diffusion Constant | 0.3 pixels MCS−1 | Estimated | Medium |
| Diffusion Solver Steppable | KIT ligand chemoattractant decay constant | 0.001 pixels MCS−1 | Estimated | Medium |
| Diffusion Solver Steppable | SDF1 chemoattractant diffusion constant | 0.99 pixels MCS−1 | Estimated | High |
| Diffusion Solver Steppable | SDF1 chemoattractant decay constant | 0.00001 pixels MCS−1 | Estimated | Medium |
| Secretion Steppable | KIT ligand chemoattractant secretion constant | 0.5 μM MCS−1 | Estimated | Low |
| Secretion Steppable | SDF1 chemoattractant secretion constant | 2.0 μM MCS−1 | Estimated | Medium |
Rankings of parameters in Phase I and Phase II, based on the evaluation of sensitivity analysis endpoints: developmental process accuracy, cell structure integrity, germ cell abundance, and the number of incomplete trials.
Table 2.
Contact energy between cell types in Phase I.
| J τ0 | J τ1 | J τ2 | J τ3 | J τ4 | J τ5 | J τ6 | J τ7 | |
|---|---|---|---|---|---|---|---|---|
| J τ0 | 24.0 | 27.0 | 27.0 | 27.0 | 24.0 | 24.0 | 27.0 | 27.0 |
| J τ1 | 16.0 | 27.0 | 20.0 | 27.0 | 28.0 | 33.0 | 27.0 | |
| J τ2 | 24.0 | 16.0 | 27.0 | 24.0 | 36.0 | 24.0 | ||
| J τ3 | 16.0 | 27.0 | 24.0 | 36.0 | 16.0 | |||
| J τ4 | 24.0 | 24.0 | 27.0 | 27.0 | ||||
| J τ5 | 24.0 | 24.0 | 24.0 | |||||
| J τ6 | 8.0 | 36.0 | ||||||
| J τ7 | 18.0 |
Table 3.
Symbol, descriptions, values, references, and sensitivity rankings for model parameters in Phase II, organized by biological category.
| CC3D Functions | Parameter name | Parameter value | Reference | Sensitivity |
|---|---|---|---|---|
| Volume Steppable | Oocyte target volume | 22.0 pixels | [22] | Medium |
| Volume Steppable | Oocyte inverse cell compressibility | 4.0 | Estimated | Low |
| Volume Steppable | Granulosa target volume | 21.0 pixels | [22] | Medium |
| Volume Steppable | Granulosa cells on inverse cell compressibility | 3.0 | Estimated | Low |
| Volume Steppable | Stromal target volume | 21.0 pixels | [22] | Medium |
| Volume Steppable | Stromal inverse cell compressibility | 3.0 | Estimated | Low |
| Volume Steppable | Epithelial target volume | 15.0 pixels | [22] | Medium |
| Volume Steppable | Epithelial inverse cell compressibility | 3.0 | Estimated | Low |
| Volume Steppable | Mesonephros target volume | 15.0 pixels | [22] | Medium |
| Volume Steppable | Mesonephros inverse cell compressibility | 3.0 | Estimated | Low |
| Mitosis Steppable | Mitotic rate of oocytes | 0.0018333 MCS−1 | [10] | Medium |
| Mitosis Steppable | Mitotic rate of granulosa cells | 0.0001 MCS−1 | Estimated | Medium |
| Mitosis Steppable | Mitotic rate of stromal cells | 0.00005 MCS−1 | Estimated | Medium |
| Mitosis Steppable | Mitotic rate of epithelial cells | 0.000005 MCS−1 | Estimated | Medium |
| Cell Death Steppable | Death rate (apoptosis) of oocytes | 0.13 oocytes MCS−1 | [10] | High |
| Cell Death Steppable | Death rate coefficient for oocytes | 550 000 000 | Estimated | Low |
| Secretion Steppable | Secretion constant of estrogen | 0.1 μM MCS−1 | Estimated | Low |
| Diffusion Solver Steppable | Estrogen diffusion constant | 0.99 pixels MCS−1 | Estimated | Low |
| Diffusion Solver Steppable | SDF1 chemoattractant decay constant | 0.00001 pixels MCS−1 | Estimated | Low |
Rankings of parameters in Phase I and Phase II, based on evaluation of sensitivity analysis endpoints: developmental process accuracy, cell structure integrity, and germ cell abundance.
Table 4.
Contact energy between cell types in Phase II.
| J τ'0 | J τ'1 | J τ'2 | J τ'3 | J τ'4 | J τ'5 | |
|---|---|---|---|---|---|---|
| J τ'0 | 37.5 | 37.5 | 37.5 | 37.5 | 17.5 | 19.5 |
| J τ'1 | 16.0 | 19.5 | 21.0 | 42.0 | 52.5 | |
| J τ'2 | 19.5 | 19.5 | 27.0 | 52.5 | ||
| J τ'3 | 19.5 | 27.0 | 52.5 | |||
| J τ'4 | 13.5 | 22.5 | ||||
| J τ'5 | 19.5 |
During model development, we tested four hypotheses about biological mechanisms during early ovarian development in mice. First, we tested whether PGCs continue to undergo mitosis during migration to the gonadal ridge. Second, while it is known that KIT ligand signaling is involved in PGC migration to the gonadal ridge, the mechanism by which that signaling occurs is not well understood. We tested whether KIT ligand signaling from hindgut epithelial cells occurs sequentially, i.e., expression starts in the posterior region of the hindgut nearest to the starting location of the PGCs and spreads to the gonadal ridge. The alternative hypothesis is that KIT ligand is secreted from all hindgut epithelial cells simultaneously and continuously throughout PGC migration. In both hypotheses, the chemoattractant was programmed to be secreted on E8 from the external surface of the cell, and the secretion rate, diffusion rate, and decay rate were estimated to best simulate PGC migration; the individual hindgut cells that secreted KIT ligand differed creating a spatially sequential secretion pattern or a static secretion pattern. Third, we investigated whether germ cell nest breakdown is governed by a change in cellular adhesion or chemoattractant signaling between oocytes and between granulosa cells and oocytes in association with a decrease of maternal estrogen. Lastly, we tested whether the localization of oocytes in the cortex region of the ovary (on P1) can be simulated by proliferation of granulosa cells.
Experimental data
Data used for model development in Phase I and Phase II were derived from experimental images, morphological descriptions, and quantitative data from existing literature. As mentioned above, the initial lattice for Phase I was constructed from a whole-mount image of a mouse embryo stained for alkaline phosphatase (Figure 2B) [21]. Morphological descriptions of the origin of PGCs and PGC migration used to specify cell behavior functions and guide parameter estimation in Phase I were obtained from multiple studies [5, 23, 25–31]. Additionally, quantitative data on PGC abundance from E5.5 to E12.5 were derived from studies by Ohinata et al [32], Payer et al. [33], and Bortvin et al. [34]. Cell abundance data were used to estimate the mitotic rate of PGCs and to test model accuracy by evaluating cell abundance throughout the simulation. In addition to experimental images, morphological descriptions in the literature were used to guide development of the model and assess parameter sensitivity, especially for periods of development with limited image data [1, 2, 10, 29].
The initial lattice for Phase II was constructed from an experimental image of a whole-mount XX mouse gonad stained for follistatin (Figure 3B) [22]. Morphological descriptions and images used to guide construction of Phase II were obtained from multiple studies [14, 35–37], and data on germ cell abundance used to estimate mitotic rate and cell death rate were derived from Lei and Spradling [10]. Based on the cell abundance data, mitosis and cell death were best represented as static rates. Types of cell death (i.e., apoptosis, autophagy) were not distinguished due to insufficient data and to preserve model simplicity. In Phase II, the secretion rate, diffusion rate, and decay rate were set to be within the range of default CC3D values. Studies have shown that germ cell nest breakdown is associated with a decrease in estrogen levels [14, 36]. Thus, in Phase II, we included a background level of estrogen in the ovary until birth (4800 MCS) representing the presence of maternal estrogen. The model simulates germ cell nest breakdown by changing cellular adhesion (i.e., contact energies), as a function of the decrease in the estrogen concentration.
Experimental images were used to evaluate the model by visual comparison with simulation output images. In Phase I, predicted PGC migration from E9 to E11 was verified with whole-mount mouse embryo images and immunohistological images stained for Oct-4 [38, 39]. Visual simulation outputs from model-predicted proliferation and apoptosis of germ cells, growth of the ovary, and morphological structures in Phase II were verified using immunohistological images of mouse ovaries with germ cell-specific markers and somatic cell markers. For immunofluorescence on frozen sections, ovaries from newborn mice were fixed in 4% paraformaldehyde in phosphate buffered saline (PBS) at 4°C overnight, dehydrated through a sucrose gradient, embedded, and cryosectioned at 10-μm increments. After preincubating with 5% normal donkey serum in PBS for 1 h, the sections were then incubated with either anti-FOXL2 (1:500, a gift from Dr Dagmar Wilhelm, Monash University, Australia), anti-PECAM-1 (1:500, BD Biosciences, USA) or anti-TRA98 (1:1000, MBL international, USA) primary antibodies in PBS-Triton X-100 solution with 5% normal donkey serum at 4°C overnight. The sections were then washed and incubated in the appropriate secondary antibody (1:500; Invitrogen, USA) before mounting in Vector Mount with DAPI (Vector Labs)(Table S1). Slides were imaged under a Leica DMI4000 confocal microscope. Additional immunohistological images from the literature were additionally used to evaluate model results [40]. In Phase I and Phase II, the average germ cell abundance of 25 simulations was compared with reported abundance [32–34].
Sensitivity analysis
We performed a sensitivity analysis to evaluate how changes in individual parameter values affect selected model outputs (we will refer to these as endpoints throughout this section). In addition to assessing the impact of estimated parameter values on the model output, the sensitivity analysis results provide information about sensitive developmental processes or critical time periods highlighting potential targets for disease and toxicology research.
For each parameter undergoing sensitivity analysis, 25 full simulations were run for a 10% increase to the original value and 25 full simulations for a 10% decrease. Changes in some parameter values resulted in incomplete simulations, thus, additional simulations were performed to obtain results from 25 full simulations. Four endpoints were chosen to evaluate parameter sensitivity: (i) PGC and oocyte abundance for Phase I and Phase II, respectively; (ii) cell structure integrity; (iii) developmental process accuracy; and (iv) the number of incomplete trials. The number of incomplete trials is the number of simulations that did not run to completion (i.e., if it took 30 simulation runs to produce 25 full simulations, there would be five incomplete simulations). For Phase I, we evaluated the following model parameters: PGC growth rate, SDF1 and KIT chemotaxis strength coefficients, inverse cell compressibility (for all cell types), cell target volumes, SDF1 secretion rate, KIT secretion rate, SDF1 diffusion rate, KIT diffusion rate, SDF1 decay rate, KIT decay rate, PGCs mitotic rate, and contact energy (for all cell types). Parameters evaluated in Phase II were contact energies, cell death rate, death rate coefficient, inverse cell compressibility, mitotic rate of all Phase II cell types, and cell target volumes.
Cell abundance was also used to assess the sensitivity of adjusted parameters in Phase I and Phase II. Abundance of PGCs and oocytes in Phase I and Phase II, respectively, was recorded every 10 MCS during the entire simulation length for 25 simulations. The average cell abundance of 25 simulations under normal conditions ± one standard deviation was considered the “normal range.” For each tested parameter, cell abundances were compared with the normal range; the number of simulations with cell abundances outside the normal range was recorded for sensitivity evaluation. The number of simulations that did not run to completion due to death of germ cells was also recorded as an incomplete trial. A parameter with a greater number of trials outside of the normal abundance range or more incomplete simulations was categorized with higher sensitivity.
Cell structure integrity and accuracy of developmental processes were analyzed visually by comparing screenshots and videos of the simulations with immunohistochemistry fluorescent images and stained whole-mount images. Experimental images used to verify the model in parameter estimation were also used for the sensitivity analysis. Parameters were considered sensitive for developmental process accuracy if the developmental stages occurred on a different timeline than reported in the literature, if morphology was altered, or if a developmental stage did not occur. Alterations to the normal cell size were also analyzed when assessing developmental process accuracy. Assessment of cell structure integrity was based on the shape of the cell surface. A normal cell appears as an oval shape with little to no fragmentation. A cell with a jagged surface and/or signs of fragmentation would be considered irregular and biologically inaccurate. See figure 4.1 in Wear [24] for examples of distinguishing between regular and irregular cell shapes.
Parameter sensitivity was determined by ranking parameters according the results of the four endpoints listed above; Phase I and Phase II parameters were evaluated separately. For Phase I, parameters showing the highest sensitivity (in the top one-third) in at least three of the four endpoint categories were ranked as highly sensitive. Phase II parameters were ranked in the same way, but only assessing three endpoint categories. Parameters with the highest sensitivity for one to two of the endpoints were categorized as having medium sensitivity, and parameters without sensitivity, not in the top one-third, for an endpoint were considered low sensitivity.
Results
Phase I model development
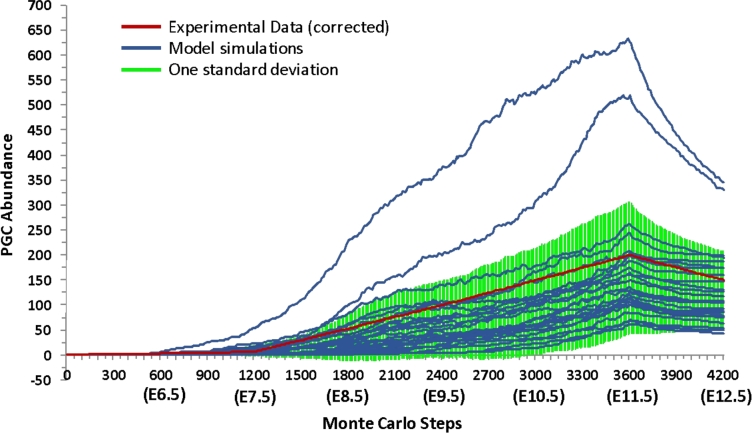
We tested the hypothesis that PGCs continue to undergo mitosis during the migratory period by simulating continued mitosis from E9 to E11 and simulating halted mitosis from E9 to E11. The average final number of PGCs incorporating continued mitosis was 132 PGCs (Figure 4), and the average final number of PGCs with halted mitosis was about 10 PGCs. These results suggest that PGCs continue to undergo mitosis during migration because they agree better with experimental adjusted results (150 PGCs) [10]. Thus, the model simulates continued mitosis of PGCs during migration.
Figure 4.
The abundance of PGCs in Phase I of the simulation. Each blue line represents one of 25 simulation runs. The green area represents one standard deviation from the mean simulation run. Experimental data adjusted to represent one-sixth of the total abundance of PGCs are shown in red. [A colour version of this figure is available in the online version.]
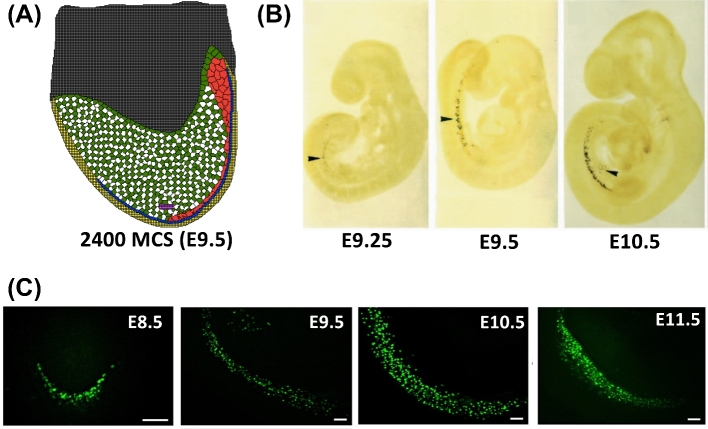
With respect to KIT ligand signaling from the hindgut epithelium, we found that spatial sequential signaling resulted in PGCs migrating toward the gonadal ridge in a manner consistent with experimental observations (Figure 5). Static KIT ligand expression from all hindgut epithelial cells during migration resulted in decreased PGC migration to the gonadal ridge with PGCs appearing to be adhered to the hindgut (Figure 6). Due to the greater alignment with experimental results obtained by the sequential signaling model, we incorporated sequential signaling of KIT ligand in the final model.
Figure 5.
Phase I model simulation output compared to experimental images. Model cell types: embryonic tissue (green/white), hindgut (yellow), extraembryonic tissue (gray), gonadal ridge (magenta), PGC (red), and KIT ligand signaling cells (blue). The experimental images show a horizontally flipped view compared to the simulation output. (A) Phase I simulation output at 2400 MCS (= E9.5) showing migration of PGCs (red) to the gonadal ridge (magenta). PGCs move from the upper posterior region of the embryo to the gonadal ridge in the lower center of the embryo. (B) Experimental images of mouse embryos show migration of PGCs from E9.25 to E10.5 through Oct-4-lacZ transgene expression, from [38] with permission. PGCs in the experimental images migrate from the top-left of the embryo (posterior region) to the lower middle (gonadal ridge). (C) Experimental images of mouse embryos show migration of PGCs from E9.25 to E10.5 through Oct-4-GFP expression, from [39] with permission. PGCs in the experimental image migrate from the top-left of the embryo (posterior region) to the lower-right (gonadal ridge). Experimental images show an increase in Oct-GFP expression, indicating an increase in the abundance of migrating PGCs. [A colour version of this figure is available in the online version.]
Figure 6.
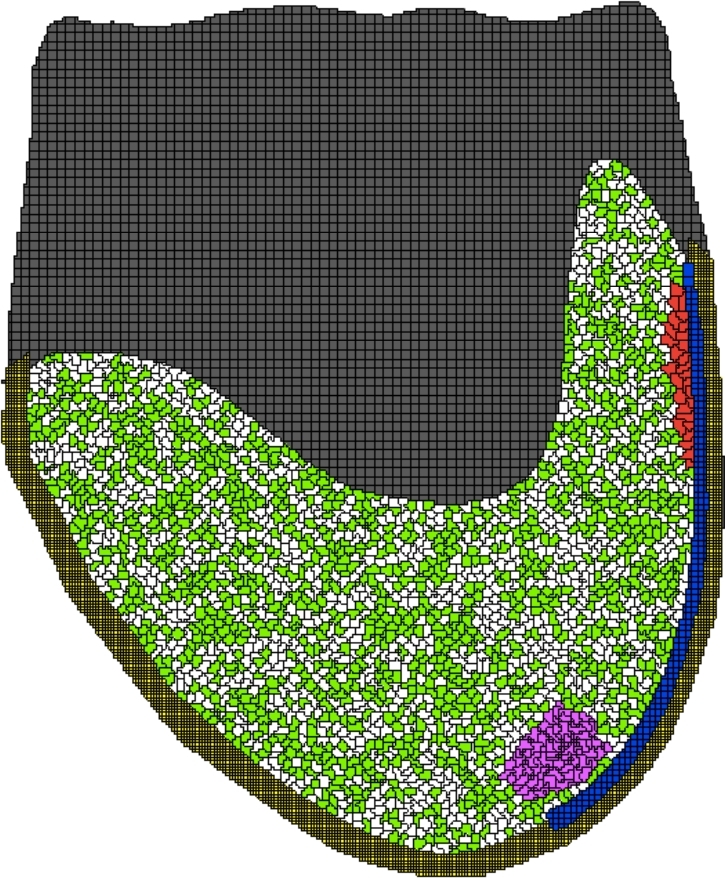
On E9.5, PGCs adhere to the hindgut epithelial cells (blue) and do not efficiently migrate to the gonadal ridge (magenta) in a simulation snapshot where KIT ligand secretion is constant—all epithelial hindgut cells start secreting KIT ligand at the same time. Cell types: embryonic tissue (green/white), hindgut (yellow), extraembryonic tissue (gray), gonadal ridge (magenta), PGC (red), and KIT ligand signaling cells (blue). [A colour version of this figure is available in the online version.]
Phase II model development
We tested whether germ cell nest breakdown could be the result of a change in cellular adhesion among oocytes, and between granulosa cells and oocytes associated with a depletion of maternal estrogen. In Phase II, an estrogen field is programmed to be present in the ovary until birth (4800 MCS). We found that programming a decrease in estrogen concentration to zero at birth (P0), which governs a corresponding change in the contact energies between oocytes (+15.0), and between oocytes and granulosa cells (–4.0), resulted in simulation results consistent with experimental images. Prior to birth, primordial follicle structures were observed in the simulation at low abundances; at 3000 MCS (E16.5) 2.84% of oocytes were in primordial follicle structures and at 4200 MCS (E18.5) 3.77% of oocytes were in primordial follicle structures. Figure 7 shows oocytes in germ cell nests and Figure 8 shows germ cell nests breaking apart to form primordial follicles. We tested chemoattractant signaling (i.e., a diffusible signal causing granulosa cells to migrate to oocytes) as an alternative mechanism leading to germ cell nest breakdown; however, simulation results were inconsistent with experimental images (Figure 9). Without additional mechanistic information about germ cell nest breakdown, we found changes in cellular adhesion to be reasonable and consistent with the literature.
Figure 7.
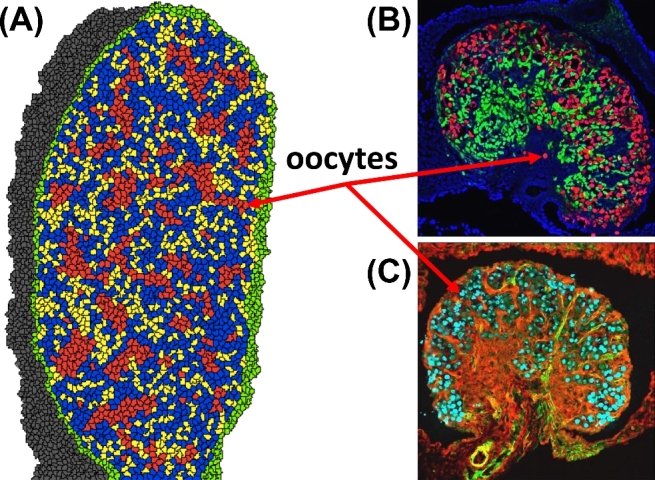
(A) Phase II simulation output at 3600 MCS (= E18.5) shows oocytes (red) in germ cell nest structures and some primordial follicle structures. Cell types: oocytes (red), granulosa cells (blue), somatic cells (yellow), epithelial cells (green), and mesonephros (gray). (B) Experimental image of a developing E18.5 mouse ovary show oocytes (red) stained for TRA98, granulosa cells (green) stained for FOXL2, and DAPI (blue) nuclear counterstain. (C) Another experimental image of a developing E18.5 mouse ovary show oocytes (cyan) stained for TRA98, interstitium (green) stained for αSMA, somatic cells (red) stained for WT1. [A colour version of this figure is available in the online version.]
Figure 8.
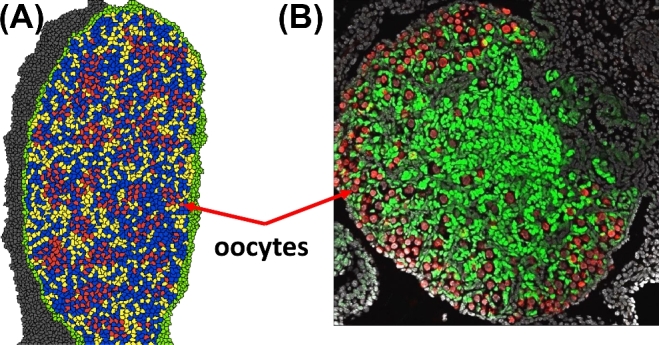
(A) Phase II simulation output at 4800 MCS (=E18.5/P0) shows oocytes (red) with primordial follicles forming. Cell types: oocytes (red), granulosa cells (blue), somatic cells (yellow), epithelial cells (green), and mesonephros (gray). (B) An experimental image of a developing mouse ovary at birth (P0) shows the formation of primordial follicles. Cellular staining: oocytes (red) through TRA98, granulosa cells (green) through FOXL2, and other cell types (gray) through DAPI. [A colour version of this figure is available in the online version.]
Figure 9.
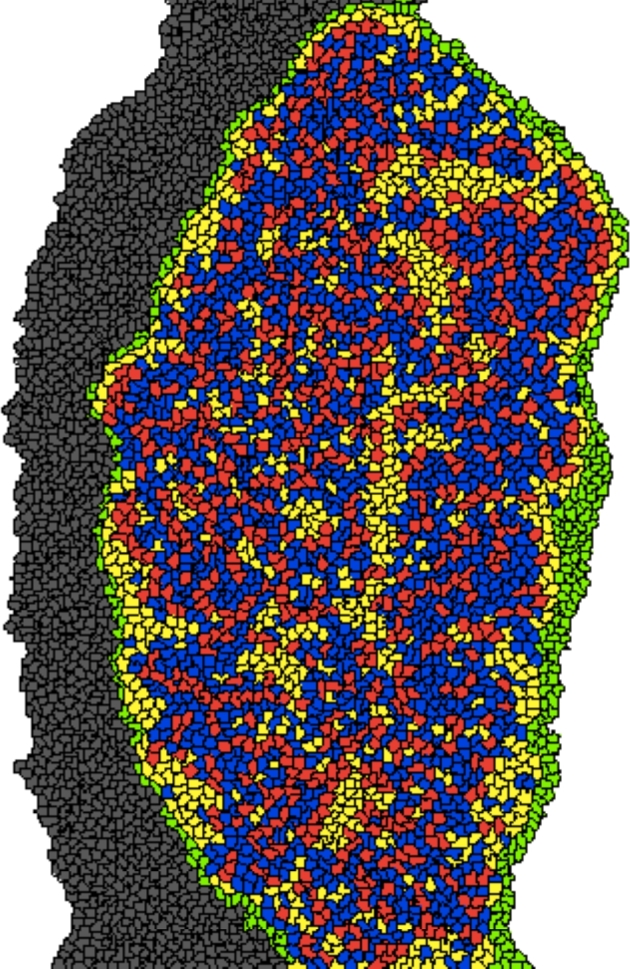
On P2, oocytes (red) appear connected in small groups and not all oocytes are surrounded by granulosa cells (blue). The morphology is not consistent with primordial follicle morphology. Cell types: oocytes (red), granulosa cells (blue), somatic cells (yellow), epithelial cells (green), and mesonephros (gray). [A colour version of this figure is available in the online version.]
The last hypothesis that was tested was if the localization of primordial follicles to the cortex region of the ovary was due to the proliferation of granulosa cells pushing the primordial follicles to the cortex. Studies have reported the presence of granulosa cell proliferation prior to and after birth [41–43]. The increased mitotic rate of granulosa cells resulted in a greater abundance of granulosa cells; however, primordial follicles were not localized to the cortex. Follicles were randomly scattered throughout the ovary, similar to the positioning observed with the normal mitotic rate. Thus, a simple increase in the mitotic rate of all granulosa cells cannot account for the localization of oocytes to the cortex.
Parameter estimation
Model parameters that were not defined by experimental data a priori were adjusted to produce outcomes consistent with experimental studies. That is, for parameters that cannot be measured directly, we adjusted values until the model outputs matched experimental data for cell abundances and experimental images (see Tables 2–5 for parameter values). Parameters estimated for both phases were contact energies, inverse cell compressibility, growth rates, secretion rates, diffusion rates, decay rates, and chemotaxis strength coefficients. The contact energies were adjusted to represent relative adhesion between cell types and cell motility. In Phase I, the secretion rates, diffusion rates, decay rates, chemotaxis strength coefficients, inverse cell compressibilities, and growth rates were adjusted to produce simulation outputs that resulted in PGCs migrating in a parade-like manner to the gonadal ridge without causing irregularities in the cells or subsequently undergoing cell death. The mitotic rate of somatic cells in Phase II were set to mimic growth of the whole ovary as observed in experimental images (Figures 10 and 11). The mitotic rate and cell death rate for oocytes were derived from experimental data [10].
Figure 10.
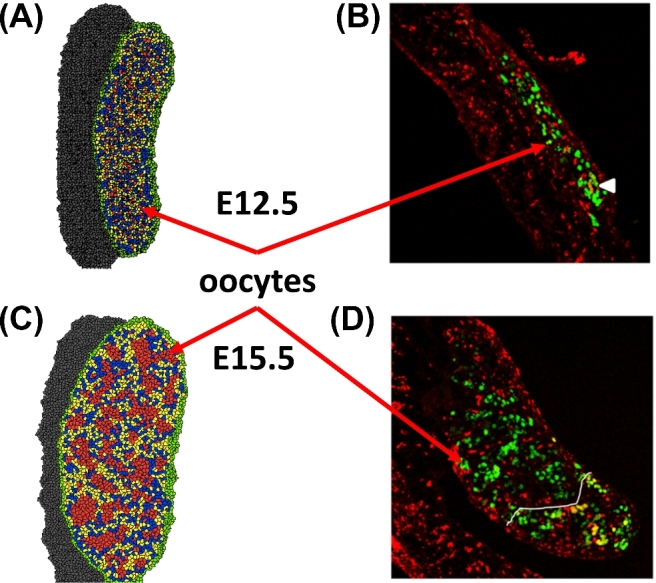
Phase II simulation snapshots compared to experimental data. Model cell types are as follows: oocytes (red), granulosa cells (blue), somatic cells (yellow), epithelial cells (green), and mesonephros (gray). (A) Phase II simulation output at 0 MCS (=E12.5) shows oocytes (red) when they first reach the gonad. (B) Mouse E12.5 ovaries show oocytes through Oct-4-GFP (green) and CCND1 (red) transgene expression, from [40] with permission. The mesonephros in the experimental image (section in image showing only cyclin D1 staining) is large compared to the size of the gonad (section with both Oct-4-GFP and cyclin D1 staining). (C) Phase II simulation output at 4800 MCS (E15.5) shows oocytes (red) in germ cell nests. (D) Mouse E15.5 ovaries show oocytes through Oct-4-GFP (green) and CCND1 (red) transgene expression, from [40] with permission. [A colour version of this figure is available in the online version.]
Figure 11.
The abundance of oocytes in Phase II of the simulation. Each blue line represents one of 25 simulation runs. The green area represents one standard deviation from the mean simulation run. [A colour version of this figure is available in the online version.]
Sensitivity analysis
A sensitivity analysis was conducted to determine the influence of model parameters on the chosen endpoints. The analysis revealed that contact energies, mitotic rate, KIT chemotaxis strength coefficient, SDF1 chemotaxis strength coefficient, KIT diffusion coefficient, SDF1 diffusion coefficient, and SDF1 decay rate have the greatest influence on the visual endpoints (cell structure and tissue integrity), and were categorized as sensitive parameters with respect to developmental process accuracy and cell structure integrity (for more information see chapter 4 of Wear [20]). Cell abundance in Phase I followed the same pattern in each simulation, steadily increasing from 0 to 3600 MCS (E5.5–11.5), then slightly decreasing until the end of the simulation at 4200 MCS (E12.5) (see Figure 4). Thus, none of the Phase I parameters were found to be sensitive with respect to cell abundance. The majority of simulations for each adjusted parameter were within the normal range. Inverse cell compressibilities, target volumes, and SDF1 secretion rate had the most simulations (19, 18, and 12 out of 25 simulations, respectively) outside the normal range, while KIT chemotaxis strength coefficient, contact energies, and KIT decay coefficient had the highest frequency of incomplete trials (18 of 43, 18 of 43, and 16 of 41 simulations, respectively), a simulation that did not run to completion. No correlations were found between the number of simulations outside the normal range and the number of incomplete simulations in Phase I.
A parameter was categorized as having high, medium, or low sensitivity (see Tables 2 and 4) based on how many endpoints it influenced significantly. In Phase I, highly sensitive parameters influenced at least three of the four endpoints (Table S2). We found contact energies, mitotic rate, KIT chemotaxis strength coefficient, and the SDF1 diffusion rate to be highly sensitive parameters.
In Phase II, highly sensitive parameters influenced two of three endpoints assessed since there were no incomplete simulations for any of the tested parameters in Phase II (Table S3). Phase II parameters were ranked as having high sensitivity if they influenced at least two endpoints, medium for one endpoint, and low for no endpoints. In Phase II, death rate was the only highly sensitive parameter with respect to the three endpoints assessed. Simulations for each parameter tested in Phase II showed a rapid proliferation of oocytes from 0 to 1200 MCS and a steady, linear decrease from 1200 to 6000 MCS (see cell abundances from figure 4.15 to 4.20 in Wear [24]). Phase II parameters showed an increase in the number of simulations outside the normal range when compared to Phase I parameters. Sensitivity analysis results for the Phase II target volume had zero simulations in the normal range. Oocyte abundance was greatly affected by manipulations to target volume and mitotic rate, resulting in an increase in abundance, relative to the normal range, with a 10% increase in the parameter value and a decrease in abundance with a 10% decrease to the value. No correlations were observed between oocyte abundance and visual endpoints in Phase II, indicating the influence of parameters are specific to certain outcomes and do not affect all endpoints of ovarian development.
Discussion
Model simulation results provide insight on the four mechanisms of ovarian development tested. Though it is generally accepted that PGCs proliferate during migration, contrasting hypotheses provided an opportunity to use our model to test both hypotheses. Model results agree with the data from experimental studies that PGC proliferation continued during their migration to the gonadal ridge. Experimental studies in mice report increased PGC abundance during migration, indicating continued PGC proliferation during migration [44, 45]. Stressors (e.g., chemical toxicants) altering mitotic rates may influence the hypothesis on PGC mitosis from E5.5 to E12.5. Tam and Snow [46] reported a constant proliferation rate of PGCs under normal conditions, while exposure to chemicals (mitomycin C) can alter the proliferation rate during migration. Mitotic rates may also vary depending on their location in the migratory path or their proximity to somatic cells [47], though this is not incorporated into our model to preserve simplicity. Further research is needed to discern the mitotic rates of PGCs during migration.
We found that spatial sequential secretion (i.e., secretion starting at the posterior hindgut, closest to the starting location of PGCs and spreading to the hindgut nearest to the gonadal ridge) of KIT ligand resulted in a PGC migration pattern that best fit the observed data. The mechanisms underlying sequential signaling as modeled here are presumed to be similar to inductive cellular signaling via a diffusible signal [48]. Signals governing PGC migration have been experimentally verified in mouse knockout studies; however, the mechanisms of signaling have been largely unexplored.
Another possible mechanism for PGC migration signaling could be through an attractant signal and repellent signal model [49]. In drosophila, PGC migration is governed by a source chemoattractant signal located at the migration destination and a chemo repellant signal located at the initial position of migration [50]. An attractant/repellent mechanism of signaling for PGC migration has not been verified in mouse. Without any known repellent signals involved, this mechanism was not simulated to preserve model simplicity.
In Phase II, the contact energy values for granulosa cells and oocytes were altered to produce germ cell nests and primordial follicles. A low percentage (3%–4%) of oocytes were observed in primordial follicle structures in the simulation prior to birth. Experimental data show <5% oocytes in primordial follicle structures prior to birth [51]. The model aligns with experimental data showing some primordial follicle formation prior to birth with the majority of primordial follicle formation occurring after birth. The mechanisms for germ cell nest breakdown and primordial follicle formation are unknown, so a change in contact energies between oocytes and between oocytes and granulosa cells was programmed to govern the process. Alternate contact energies where adhesion between oocytes is decreased and adhesion between oocytes and granulosa cells is increased may produce similar outputs; however, it was outside the scope of this study to assess all combinations of parameter values that could produce the same results. In the model, programming chemoattractant signaling as the mechanism for germ cell nest breakdown did not produce results that aligned with experimental images (Figure 9). This is consistent with the literature that reports the expression of several genes influencing germ cell nest breakdown in mice [14, 36]; none of which are chemoattractant signals. Experimental research is needed to validate our assumption that germ cell nest breakdown is governed by changes in cellular adhesion between oocytes and granulosa cells in association with a decrease in maternal estrogen.
One aspect of our model that does not match observed morphology well is the distribution of primordial follicles at birth (Figure 7). Phase II results show primordial follicles scattered throughout the ovary, while experimental images show primordial follicles localized to the cortex region of the ovary. We tested whether increasing the mitotic rate of granulosa cells would cause follicle localization in the cortex region, but this did not result in the same morphological pattern observed experimentally. The inconsistency between model results and experimental results could be explained by the increased proliferation of a specific subpopulation of granulosa cells residing in the medullar region, which would push primordial follicles to the cortex region. Additional research is needed to understand their roles in controlling ovary morphology.
Parameter estimation and sensitivity analysis
Parameter values were defined from data in the literature or they were estimated by fitting the model to available data. Some parameters, e.g., contact energies, have not been measured experimentally but they are essential model parameters. In such cases, parameter values from other CC3D models [52–54] were used to as a starting point to find parameter values that allowed our model to fit the experimental data. We did this for contact energies, inverse cell compressibilities, and chemotaxis strength coefficients, then parameters were readjusted in order to preserve cell structure integrity. To best fit observed tissue structures, contact energies between PGCs and epithelial and hindgut cells had to be lower than contact energies between extracellular matrix and epithelial and hindgut cell. Lower contact energies mean stronger adhesion between those cell types; the contact energy values define the adhesion of one cell type to other cell types. Contact energy values were within the range of contact energy values in the CC3D models mentioned previously, although experimental data for the expression concentrations of adhesion molecules are needed to better define contact energies. Values for inverse cell compressibilities and chemotaxis strength coefficients were also set based on published CC3D models, then readjusted producing a model that aligned well with cell abundance data and experimental images.
The sensitivity analysis played an important role in model development. Identification of highly sensitive parameters helps with parameter estimation and assists with simplification of the model. In the sensitivity analysis, most parameters exhibiting abnormal cell structure integrity also displayed abnormal development. For example, altering the death rate of oocytes ±10% in Phase II caused oocyte fragmentation, which led to abnormal formation of germ cell nests. Parameters with high sensitivity to cell structure also had high sensitivity to development, which may indicate a relationship in the two endpoints. Increasing all the contact energies two times the original values, keeping the relative differences in value the same, resulted in stagnant, nonmotile cells in the simulation. Lowering all the contact energies to half the original values resulted in fragmentation and irregularities in cell structures. Sensitivity analysis results indicate that irregular cell structure will lead to a disruption in the developmental process, although irregular cell structure is not necessary to produce an abnormal developmental process outcome (e.g., KIT chemotaxis strength coefficient in Phase I and contact energies in Phase II). A greater percentage of parameters in Phase I affected development and cell structure, likely due to the number of parameters defined in Phase I compared to Phase II. To keep the model representative of the existing data, early ovarian development processes were modeled parsimoniously, relying on the fewest number of parameters (i.e., contact energies) to control the morphological changes observed. The overall magnitude and relative magnitude of contact energies in Phase I and II were kept within range to promote continuity between the phases.
In Phase II, we found mitotic rate and target volume to be highly sensitive to parameter value manipulation based on the germ cell abundance endpoint. Mitotic rate directly controls the abundance of cells, explaining its sensitivity. Target volume, when reduced by 10% to 19.8 pixels, may not be large enough for cells to undergo mitosis and when increased by 10% to 24.2 pixels, may not have enough physical space within the tissue to undergo division. Target volume was also identified as a sensitive parameter in Phase I, with respect to cell abundance. Interestingly, the mitotic rate did not have high sensitivity in Phase I, where inverse cell compressibility was the most sensitive. In Phase I, parameters relating to volume have greater control over PGC abundance than a parameter directly controlling cell proliferation. This observation may be explained by a relationship between multiple parameters; however, it cannot be determined from the results of the univariate analysis.
Results from this analysis can be used to focus future experimental research on the parameters with high sensitivity (e.g., collecting in vivo data for a specific parameter, focus research on stressors that affect a parameter with high sensitivity) as the level of sensitivity may indicate how critical a specific biological mechanism or developmental period is for ovarian development. The sensitivity analysis also increases the understanding of parameter influence on model behavior, allowing it to be a more compelling tool for assessing hypotheses and predicting adverse outcomes.
We constructed a cell-based computational model of early ovarian development in mice using the most up-to-date information in the literature. The model serves as a tool to understand early ovarian development by testing hypothesized mechanisms (e.g., PGC proliferation during mitosis), producing new hypothesized mechanisms (e.g., mechanism governing germ cell breakdown), and predicting the primordial follicle population. Four hypothesized biological mechanisms were tested during model development, and future work could involve testing additional hypotheses.
Given that our model reproduces observed cell counts and developmental processes reasonably well, it could be used as a predictive tool to test how perturbations of model parameters affect model results, e.g., due to toxicant exposure. Future toxicological applications of the model will incorporate data from in vitro assays and extrapolate biological effects to predict adverse outcomes in ovarian development and function. The prospective model will specifically provide insight to the developmental timescale, morphological alterations, and the size of the primordial follicle pool. Variations to the primordial pool can be predicted from disruption during early ovarian development, leading to insights about the reproductive lifespan. To our knowledge, this is the first cell-based model of early ovarian development in mice and as additional data become available the model can be updated to include new features and developmental processes including an extension to later phases of ovarian development and higher quality predictions of fertility.
Supplementary data
Supplementary data are available at BIOLRE online.
Table S1. Antibody Table.
Table S2. Assessment of Phase I parameter sensitivity based on four endpoints: developmental process accuracy, cell structure integrity, PGC abundance, and incomplete trials. A checkmark (✓) indicates the parameter showed sensitivity and a line (–) indicates the parameter did not show sensitivity when adjusted ±10%.
Table S3. Assessment of Phase II parameter sensitivity based on three endpoints: developmental process accuracy, cell structure integrity, and oocyte abundance. A checkmark (✓) indicates the parameter showed sensitivity and a line (–) indicates the parameter did not show sensitivity when adjusted ± 10%.
Video S1. Phase I of the early ovarian development model, which represents embryonic day 5.5 (E5.5) to E12.5. The lattice is updated every Monte Carlo step (MCS) and the simulation runs for 4200 MCS, equivalent to 7 days.
Video S2. The video shows Phase II of the early ovarian development model, which represents embryonic day 12.5 (E12.5) to postnatal day 2 (P2). The lattice is updated every Monte Carlo step (MCS) and the simulation runs for 6000 MCS, equivalent to 10 days.
Supplementary data are available at BIOLRE online.
References
- 1. Sarraj MA, Drummond AE. Mammalian foetal ovarian development: Consequences for health and disease. Reproduction 2012; 143:151–163. [DOI] [PubMed] [Google Scholar]
- 2. Edson MA, Nagaraja AK, Matzuk MM. The mammalian ovary from genesis to revelation. Endocr Rev 2009; 30:624–712. [DOI] [PMC free article] [PubMed] [Google Scholar]
- 3. Ying Y, Zhao GQ. Cooperation of endoderm-derived BMP2 and extraembryonic ectoderm-derived BMP4 in primordial germ cell generation in the mouse. Dev Biol 2001; 232:484–492. [DOI] [PubMed] [Google Scholar]
- 4. Bendel-Stenzel MR, Gomperts M, Anderson R, Heasman J, Wylie C. The role of cadherins during primordial germ cell migration and early gonad formation in the mouse. Mech Devel 2000; 91:143–152. [DOI] [PubMed] [Google Scholar]
- 5. Molyneaux KA, Zinszner H, Kunwar PS, Schaible K, Stebler J, Sunshine MJ, O’Brien W, Raz E, Littman D, Wylie C, Lehmann R. The chemokine SDF1/CXCL12 and its receptor CXCR4 regulate mouse germ cell migration and survival. Development 2003; 130:4279–4286. [DOI] [PubMed] [Google Scholar]
- 6. Runyan C, Schaible K, Molyneaux K, Wang Z, Levin L, Wylie C. Steel factor controls midline cell death of primordial germ cells and is essential for their normal proliferation and migration. Development 2006; 133:4861–4869. [DOI] [PubMed] [Google Scholar]
- 7. McCoshen JA, McCallion DJ. A study of the primordial germ cells during their migratory phase in steel mutant mice. Experientia 1975; 31:589–590. [DOI] [PubMed] [Google Scholar]
- 8. Seki Y, Yamaji M, Yabuta Y, Sano M, Shigeta M, Matsui Y, Saga Y, Tachibana M, Shinkai Y, Saitou M. Cellular dynamics associated with the genome-wide epigenetic reprogramming in migrating primordial germ cells in mice. Development 2007; 134:2627. [DOI] [PubMed] [Google Scholar]
- 9. Borum K. Oogenesis in the mouse. Exp Cell Res 1961; 24:495–507. [DOI] [PubMed] [Google Scholar]
- 10. Lei L, Spradling AC. Mouse primordial germ cells produce cysts that partially fragment prior to meiosis. Development 2013; 140:2075–2081. [DOI] [PMC free article] [PubMed] [Google Scholar]
- 11. Pepling ME, Spradling AC. Mouse ovarian germ cell cysts undergo programmed breakdown to form primordial follicles. Dev Biol 2001; 234:339–351. [DOI] [PubMed] [Google Scholar]
- 12. Pepling ME, Sundman EA, Patterson NL, Gephardt GW, Medico L Jr., Wilson KI. Differences in oocyte development and estradiol sensitivity among mouse strains. Reproduction 2010; 139:349–357. [DOI] [PubMed] [Google Scholar]
- 13. Hirshfield AN. Comparison of granulosa cell proliferation in small follicles of hypophysectomized, prepubertal, and mature rats. Biol Reprod 1985; 32:979–987. [DOI] [PubMed] [Google Scholar]
- 14. Chen Y, Jefferson WN, Newbold RR, Padilla-Banks E, Pepling ME. Estradiol, progesterone, and genistein inhibit oocyte nest breakdown and primordial follicle assembly in the neonatal mouse ovary in vitro and in vivo. Endocrinology 2007; 148:3580–3590. [DOI] [PubMed] [Google Scholar]
- 15. Raies AB, Bajic VB. In silico toxicology: Computational methods for the prediction of chemical toxicity. Wiley Interdiscip Rev Comput Mol Sci 2016; 6:147–172. [DOI] [PMC free article] [PubMed] [Google Scholar]
- 16. Wallace WH, Kelsey TW. Human ovarian reserve from conception to the menopause. PLoS One 2010; 5:e8772. [DOI] [PMC free article] [PubMed] [Google Scholar]
- 17. Uslu B, Dioguardi CC, Haynes M, Miao D-Q, Kurus M, Hoffman G, Johnson J. Quantifying growing versus non-growing ovarian follicles in the mouse. J Ovarian Res 2017; 10:3. [DOI] [PMC free article] [PubMed] [Google Scholar]
- 18. Iber D, Geyter CD. Computational modelling of bovine ovarian follicle development. BMC Syst Biol 2013; 7:60. [DOI] [PMC free article] [PubMed] [Google Scholar]
- 19. Swat MH, Thomas GL, Belmonte JM, Shirinifard A, Hmeljak D, Glazier JA. Multi-scale modeling of tissues using CompuCell3D. Method Cell Biol 2012; 110:325–366. [DOI] [PMC free article] [PubMed] [Google Scholar]
- 20. Merks RMH, Glazier JA. A cell-centered approach to developmental biology. Physica A 2005; 352:113–130. [Google Scholar]
- 21. Ginsburg M, Snow MH, McLaren A. Primordial germ cells in the mouse embryo during gastrulation. Development 1990; 110:521–528. [DOI] [PubMed] [Google Scholar]
- 22. Manuylov NL, Smagulova FO, Leach L, Tevosian SG. Ovarian development in mice requires the GATA4-FOG2 transcription complex. Development 2008; 135:3731–3743. [DOI] [PubMed] [Google Scholar]
- 23. De Sousa Lopes SM, Hayashi K, Surani MA. Proximal visceral endoderm and extraembryonic ectoderm regulate the formation of primordial germ cell precursors. BMC Dev Biol 2007; 7:140. [DOI] [PMC free article] [PubMed] [Google Scholar]
- 24. Wear HM. Modeling the mammalian ovary: a cell-based computational model of early ovarian development in mice and preliminary data for a model of folliculogenesis in rhesus monkeys. Scholar Archive. 3832. Portland, Oregon: OHSU Digital Commons: Oregon Health & Science University; 2016. Thesis. http://digitalcommons.ohsu.edu/etd/3832. [Google Scholar]
- 25. Lanner F. Lineage specification in the early mouse embryo. Exp Cell Res 2014; 321:32–39. [DOI] [PubMed] [Google Scholar]
- 26. Di Carlo A, De Felici M. A role for E-cadherin in mouse primordial germ cell development. Dev Biol 2000; 226:209–219. [DOI] [PubMed] [Google Scholar]
- 27. Doitsidou M, Reichman-Fried M, Stebler J, Köprunner M, Dörries J, Meyer D, Esguerra CV, Leung T, Raz E. Guidance of primordial germ cell migration by the chemokine SDF-1. Cell 2002; 111:647–659. [DOI] [PubMed] [Google Scholar]
- 28. Gu Y, Runyan C, Shoemaker A, Surani A, Wylie C. Steel factor controls primordial germ cell survival and motility from the time of their specification in the allantois, and provides a continuous niche throughout their migration. Development 2009; 136:1295–1303. [DOI] [PubMed] [Google Scholar]
- 29. Molyneaux K, Wylie C. Primordial germ cell migration. Int J Dev Biol 2004; 48:537–544. [DOI] [PubMed] [Google Scholar]
- 30. Raz E. Guidance of primordial germ cell migration. Curr Opin Cell Biol 2004; 16:169–173. [DOI] [PubMed] [Google Scholar]
- 31. Richardson BE, Lehmann R. Mechanisms guiding primordial germ cell migration: strategies from different organisms. Nat Rev Mol Cell Biol 2010; 11:37–49. [DOI] [PMC free article] [PubMed] [Google Scholar]
- 32. Ohinata Y, Payer B, O’Carroll D, Ancelin K, Ono Y, Sano M, Barton SC, Obukhanych T, Nussenzweig M, Tarakhovsky A. Blimp1 is a critical determinant of the germ cell lineage in mice. Nature 2005; 436:207–13. [DOI] [PubMed] [Google Scholar]
- 33. Payer B, Saitou M, Barton SC, Thresher R, Dixon JP, Zahn D, Colledge WH, Carlton MB, Nakano T, Surani MA. Stella is a maternal effect gene required for normal early development in mice. Curr Biol 2003; 13:2110–2117. [DOI] [PubMed] [Google Scholar]
- 34. Bortvin A, Goodheart M, Liao M, Page DC. Dppa3 / Pgc7 / stella is a maternal factor and is not required for germ cell specification in mice. BMC Dev Biol 2004; 4:1–5. [DOI] [PMC free article] [PubMed] [Google Scholar]
- 35. Haglund K, Nezis IP, Stenmark H. Structure and functions of stable intercellular bridges formed by incomplete cytokinesis during development. Commun Integr Biol 2011; 4:1–9. [DOI] [PMC free article] [PubMed] [Google Scholar]
- 36. Tingen C, Kim A, Woodruff TK. The primordial pool of follicles and nest breakdown in mammalian ovaries. Mol Hum Reprod 2009; 15:795–803. [DOI] [PMC free article] [PubMed] [Google Scholar]
- 37. Trombly DJ, Woodruff TK, Mayo KE. Suppression of notch signaling in the neonatal mouse ovary decreases primordial follicle formation. Endocrinology 2009; 150:1014–1024. [DOI] [PMC free article] [PubMed] [Google Scholar]
- 38. Yeom YII, Fuhrmann G, Ovitt CE, Brehm A, Ohbo K, Gross M, Hübner K, Schöler HR. Germline regulatory element of Oct-4 specific for the totipotent cycle of embryonal cells. Development 1996; 122:881–894. [DOI] [PubMed] [Google Scholar]
- 39. Francis RJB, Lo CW. Primordial germ cell deficiency in the connexin 43 knockout mouse arises from apoptosis associated with abnormal p53 activation. Development 2006; 133:3451–3460. [DOI] [PubMed] [Google Scholar]
- 40. Heaney JD, Anderson EL, Michelson MV, Zechel JL, Conrad PA, Page DC, Nadeau JH. Germ cell pluripotency, premature differentiation and susceptibility to testicular teratomas in mice. Development 2012; 139:1577–1586. [DOI] [PMC free article] [PubMed] [Google Scholar]
- 41. Maatouk DM, Mork L, Chassot A-A, Marie-Christine C, Capel B. Disruption of mitotic arrest precedes precocious differentiation and transdifferentiation of pregranulosa cells in the perinatal Wnt4 mutant ovary. Dev Biol 2013; 383:295–306. [DOI] [PMC free article] [PubMed] [Google Scholar]
- 42. Mork L, Maatouk DM, McMahon JA, Guo JJ, Zhang P, McMahon AP, Capel B. Temporal differences in granulosa cell specification in the ovary reflect distinct follicle fates in mice. Biol Reprod 2012; 86:37. [DOI] [PMC free article] [PubMed] [Google Scholar]
- 43. Gustin SE, Hogg K, Stringer JM, Rastetter RH, Pelosi E, Miles DC, Sinclair AH, Wilhelm D, Western PS. WNT/β-catenin and p27/FOXL2 differentially regulate supporting cell proliferation in the developing ovary. Dev Biol 2016; 412:250–260. [DOI] [PubMed] [Google Scholar]
- 44. Sekl Y, Yamaji M, Yabuta Y, Sano M, Shigeta M, Matsui Y, Saga Y, Tachibana M, Shinkai Y, Saitou M. Cellular dynamics associated with the genome-wide epigenetic reprogramming in migrating primordial germ cells in mice. Development 2007; 134:2627–2638. [DOI] [PubMed] [Google Scholar]
- 45. Wylie CC, Heasman J. Migration, proliferation and potency of primordial germ cells. Semin Dev Biol 1993; 4:161–170. [Google Scholar]
- 46. Tam PPL, Snow MHL. Proliferation and migration of primordial germ cells during compensatory growth in mouse embryos. J Embryol Exp Morph 1981; 64:133. [PubMed] [Google Scholar]
- 47. Wong T-T, Collodi P. Effects of specific and prolonged expression of zebrafish growth factors, Fgf2 and lif in primordial germ cells in vivo. Bioch Bioph Res Co 2013; 430:347–351. [DOI] [PMC free article] [PubMed] [Google Scholar]
- 48. Greenwald I. LIN-12/Notch signaling: lessons from worms and flies. Genes Dev 1998; 12:1751–1762. [DOI] [PubMed] [Google Scholar]
- 49. Shamloo A, Manchandia M, Ferreira M, Mani M, Nguyen C, Jahn T, Weinberg K, Heilshorn S. Complex chemoattractive and chemorepellent Kit signals revealed by direct imaging of murine mast cells in microfluidic gradient chambers. Integr Biol 2013; 5:1076–1085. [DOI] [PMC free article] [PubMed] [Google Scholar]
- 50. Cai D, Montell DJ. Diverse and dynamic sources and sinks in gradient formation and directed migration. Curr Opin Cell Biol 2014; 30:91–98. [DOI] [PMC free article] [PubMed] [Google Scholar]
- 51. Dutta S, Burks DM, Pepling ME. Arrest at the diplotene stage of meiotic prophase I is delayed by progesterone but is not required for primordial follicle formation in mice. Reprod Biol Endocrin 2016; 14:82. [DOI] [PMC free article] [PubMed] [Google Scholar]
- 52. Belmonte JM, Clendenon SG, Oliveira GM, Swat MH, Greene EV, Jeyaraman S, Glazier JA, Bacallao RL. Virtual-Tissue computer simulations define the roles of cell adhesion and proliferation in the onset of kidney cystic disease. Mol Biol Cell 2016; 27:3673–3685. [DOI] [PMC free article] [PubMed] [Google Scholar]
- 53. Winner KRK, Steinkamp MP, Lee RJ, Swat M, Muller CY, Moses ME, Jiang Y, Wilson BS. Spatial modeling of drug delivery routes for treatment of disseminated ovarian cancer. Cancer Res 2016; 76:1320. [DOI] [PMC free article] [PubMed] [Google Scholar]
- 54. Swat MH, Thomas GL, Shirinifard A, Clendenon SG, Glazier JA. Emergent stratification in solid tumors selects for reduced cohesion of tumor cells: a multi-cell, virtual-tissue model of tumor evolution using CompuCell3D. PLoS One 2015; 10:e0127972. [DOI] [PMC free article] [PubMed] [Google Scholar]
- 55. Molyneaux KA, Stallock J, Schaible K, Wylie C. Time-lapse analysis of living mouse germ cell migration. Dev Biol 2001; 240:488–498. [DOI] [PubMed] [Google Scholar]
Associated Data
This section collects any data citations, data availability statements, or supplementary materials included in this article.
Supplementary Materials
Supplementary data are available at BIOLRE online.


