

Abstract
The aim of this study was to investigate the effect of pitch shape modifications on heart rate responses and time-motion characteristics in soccer players during 5-a-side small-sided games (SSGs). Players completed four different SSG dimensions: (1) short narrow pitch (SN; 40 × 25 m), (2) short wide pitch (SW; 66 × 25 m), (3) long narrow pitch (LN; 40 × 50 m), and (4) long wide pitch (LW; 66 × 50 m). Twenty amateur soccer players (age: 21 ± 5 yr; stature: 176.8 ± 1.9 cm; body mass: 72.7 ± 3.7 kg) were monitored using a heart rate monitor and a 10 Hz GPS device. Mean maximum heart rate (%HRmax), rating of perceived exertion (RPE), peak running speed, total distance covered (TD), distance covered in four speed categories, number of moderate and high accelerations (Ac), decelerations (Dc), changes of direction (COD) and player load were recorded. Increasing the pitch length had a greater effect compared to increasing the pitch width especially on RPE (3.8, 6.3, 4.9 and 6.6 AU to SN, LN, SW and LW, respectively) and time-motion characteristics such as TD (101, 127, 108 and 131 m·min-1 to SN, LN, SW and LW, respectively), peak speed (4.8, 6.1, 5.2 and 6.2 m·s-1 to SN, LN, SW and LW, respectively), and the number of accelerations, decelerations, and changes of direction. The data demonstrates that increasing the length rather than the width of 5-a-side SSG has a greater impact on players’ responses in terms of increasing workloads.
Key words: soccer, specific training, GPS, heart rate, pitch dimensions
Introduction
Small-sided games (SSGs) are now a common feature of soccer training (Ford et al., 2010) as they enable a greater understanding of which indices impact players’ responses (Ade et al., 2014). The SSG playing area is a structural element that is modified most frequently when planning training drills. Typical modifications include variations in the length and width of the pitch and the relative space per player (Casamichana and Castellano, 2010) or maintaining the same pitch dimension but dividing it into different areas (Gonçalves et al., 2017). Varying pitch dimensions has been a focus of previous research (Hill-Haas et al., 2011) given that it can modify the demands placed on players. Researchers have primarily focused on the size of the playing area (Casamichana and Castellano, 2010; Castellano et al., 2015; Hodgson et al., 2014; Kelly and Drust, 2009; Owen et al., 2004; Rampinini et al., 2007; Tessitore et al., 2006) with or without goals (Castellano et al., 2013d). The rationale for this is clear as both variables have been found to affect the physical and technical demands placed on players (Casamichana and Castellano, 2010) and interactive team behavior (Frencken et al., 2013).
Nevertheless, studies demonstrate contradictory findings regarding players’ responses to different SSG pitch dimensions. While some studies have found that SSGs played in large areas result in greater workloads (Aroso et al., 2004; Casamichana and Castellano, 2010; Hodgson et al., 2016; Rampinini et al., 2007; Owen et al., 2004; Williams and Owen, 2007), others either found similar results for smaller pitches (Tessitore et al., 2006) or reported no differences at all (Kelly and Drust, 2009). The inconsistency reported for various SSG pitch dimensions means that a greater understanding is needed of how these metrics impact players physiological responses and time-motion characteristics (Stone and Kilding, 2009). Variations in the number of players per team (Rampinini et al., 2007) or the presence of goalkeepers (Castellano et al., 2013d) could be behind these inconsistencies. Typically, small pitch dimensions result in more accelerations-decelerations (Castellano et al., 2015; Hodgson et al., 2016) and less distance covered at high speed (Casamichana and Castellano, 2010).
When designing soccer drills, the pitch area can be modified by changing its length (distance between the goals) or its width (distance between the two side lines). Nevertheless the decision to change the width or the length of the pitch, should be made using systematic and scientific reasoning. Usually coaches change the two dimensions at the same time in order to replicate a competitive pitches length:width ratio (higher length than width). But in regular soccer matches, teams tend to play wider than longer (Castellano et al., 2013a) and this spatial distribution changes during competitive matches (Castellano et al., 2013b). Therefore, it could be interesting to propose a task in the field where the distance between the targets is shorter than the distance between side lines. However, limited data exist on how changing just the distance between the goal without changing dimensions of the field affects players’ responses.
Most studies have examined pitch dimension modifications while keeping the ratio between length and width constant. Nevertheless, there is a lack of knowledge on the effect of variation in the shape of the field manipulating just the width or the length, keeping constant the other one. The shapes of the fields used in the previously described works proposed greater lengths (distance between goals) than widths (distance between side lines), with the length:width ratio always above 1 (longed fields instead of flattened ones). These ratios range from 1.2:1 to 1.5:1 in most studies (Hill-Hass et al., 2011). However, there is no evidence on the physical and physiological demands when the pitch is wider than longer (length:width ratio is less than 1).
Thus, this study investigated the effect of pitch shape modifications on heart rate responses and time-motion characteristics in soccer players during 5-a-side SSGs (plus goalkeepers). The findings will help coaches and physical trainers to prescribe SSGs in a more systematic manner, taking into account how the shape of the playing field influences the players' responses.
Methods
Participants
Twenty male amateur soccer players (age: 21 ± 5 yr; stature: 176.8 ± 1.9 cm; body mass: 72.7 ± 3.7 kg; Yo-Yo intermittent recovery test 1 (Yo-Yo IRT1): 2256 ± 298 m) from the same regional level team participated in the study. They had played federation soccer for an average of 11 yr prior to the study. Standard training involved three sessions per week (each lasting ~90 min) and a weekly league match. All players were informed of the research design, as well as the potential benefits and risks, and written consent was obtained prior to participation. Ethical approval was granted by an Institutional Human Research Ethics Committee.
Measures
Physiological responses
Physiological responses were assessed using internal training load measures such as heart rate and RPE. Heart rates were recorded every 5 s using a telemetric device (Polar Team Sport System, Polar Electro, Oy, Finland). Maximum heart rate (HRmax) was determined for each player by means of the Yo-Yo IRT1 (Bangsbo et al., 2008) and heart rate responses were expressed as mean values of a percentage of the individual maximum heart rate (%HRmax). To assess RPE (Foster, 1998), each player was asked to complete the Borg 10-point Category Ratio (CR10) scale at the end of each SSG (Fanchini et al., 2015).
Time-Motion Characteristics
Time-motion characteristics were measured using portable global positioning system devices operating at 10 Hz (GPS, MinimaxX v.4.0, Catapult, Australia). Once recorded, data was analyzed using proprietary software (Catapult Sprint v.5.1.0, Catapult, Australia). The following were recorded: total distance covered per minute (TD), peak speed (maximum speed reached by each player), triaxial accelerometer data (player load; PL), distance covered in five speed categories, and the number of accelerations, decelerations, and changes of direction in two acceleration categories. Similarly to previous studies, five speed categories were used for analysis: 0–6.9, 7.0–12.9, 13.0–17.9, 18.0-20.9 and >21.0 km·h-1 (Hill-Haas et al., 2009; Impellizzeri et al., 2009). Accelerations, decelerations, and changes of direction were categorized as moderate or high using the respective values of >3 m·s-2 and >4 m·s-2 (Akenhead et al., 2013; Davies et al., 2013). These methods had previously been determined as reliable and valid for monitoring high-intensity activities in soccer (Castellano et al., 2011; Varley et al., 2012).
Procedures
The study variables were the pitch length and width. Players completed four different SSG shapes: (1) short narrow pitch (SN; 40 × 25 m), (2) short wide pitch (SW; 66 × 25 m), (3) long narrow pitch (LN; 40 × 50 m), and (4) long wide pitch (LW; 66 × 50 m). The results of the SSGs played on the long and short pitches (SN vs LN and SW vs LW) were used to investigate the impact of pitch length modifications on players’ responses. Likewise, the results of the SSGs played on the narrow and wide pitches (SN vs SW and LN vs LW) were used to study the impact of changes to pitch width. With exception of the offside rule, standard eleven-a-side soccer rules were followed.
The study was conducted under similar environmental conditions across a two-week period in May (2012-13 season). In the weeks leading up to the study, the players were familiarized with the various SSG design and micro technologies. In the week immediately before the study, each player performed the Yo-Yo Intermittent Recovery Test level 1 (Yo-Yo IRT1) to determine the maximum heart rate (HRmax; Krustrup et al., 2003). The test was performed on the same day on an outdoor artificial pitch with all players wearing boots.
Two training sessions, separated by a week, were held on an outdoor artificial pitch at similar times of the day (8:30 pm) to avoid the effects of circadian variations on performance (Drust et al., 2005). Each session started with a 15-min warm-up followed by four six-min SSGs, with a passive recovery period of eight min between games to prevent fatigue. The games involved the same number of players (five per side plus goalkeepers), but were played on different sized pitches. The order of the SSG was as follows: SN, SW, LN and LW (Table 1). Whilst the distance between goals was always greater than the distance between the side lines in league matches, three of the pitches designed for this study were wider than they were long because players tended to occupy the width of the pitch more often than the length during match-play (Castellano et al., 2013a). Ten players plus two goalkeepers participated in both sessions. Goalkeepers were not monitored. There were no substitutions, but the 10 outfield players who participated in the second session were different to those who participated in the first session. Accordingly, 20 recordings were made for each SSG (excluding goalkeepers), resulting in a total of 80 recordings.
Table 1.
Permutations of small-sided games in relation to width and length
| Week | Session | Rep | Teams | Format | Width | Length | Surface Area/player |
|---|---|---|---|---|---|---|---|
| 1 | 1 | A vs B | SN | 40 m | 25 m | 100 m2 | |
| 1 | 2 | A vs B | SW | 66 m | 25 m | 165 m2 | |
| 1 | |||||||
| 1 | 3 | A vs B | LN | 40 m | 50 m | 200 m2 | |
| 1 | 4 | A vs B | LW | 66 m | 50 m | 330 m2 | |
| 2 | 1 | C vs D | SN | 40 m | 25 m | 100 m2 | |
| 2 | 2 | C vs D | SW | 66 m | 25 m | 165 m2 | |
| 2 | 2 | 3 | C vs D | LN | 40 m | 50 m | 200 m2 |
| 2 | 4 | C vs D | LW | 66 m | 50 m | 330 m2 |
Rep – repetition; SN – short narrow; SW – short wide; LN – long narrow; LW – long wide.
To avoid potential imbalances and ensure equality between the two teams, players were classified and grouped according to the following variables: min of competitive play, performance on the Yo-Yo IRT1, playing position, and a subjective appraisal from the coach (Casamichana and Castellano, 2010). Coaches were present during all SSGs to offer encouragement to the players (Rampinini et al., 2007). In addition, eight balls were distributed around the edge of the pitch to maximize effective playing time (Casamichana and Castellano, 2010). Players were advised to maintain their normal nutritional and fluid intake during the study period.
Statistical Analyses
Data are presented as means ± standard deviations. A paired-sample t test with a significance level of p ≤ .05 was used for all comparisons. Effect Sizes (ES) were computed using a Cohen D calculation to determine the magnitude of the difference between the SSGs. The descriptive terms associated with ES were trivial (0.0–0.19), small (0.2–0.59), moderate (0.6–1.19), large (1.2–1.9), and very large (>2.0) (Batterham and Hopkins, 2006; Hopkins et al., 2009). A magnitude-based inference approach was also adopted to assess differences between SSGs using the following qualitative probabilities: almost certainly not (<1%), very unlikely (<5%); unlikely/probably not (<25%), possibly/possibly not (25–75%), likely/probably (>75%), very likely (>95%), and almost certainly (>99%). A significant effect was set at >99% and a substantial effect at >75% (Aughey, 2011; Suarez-Arrones et al., 2013; Maszczyk et al., 2014).
Results
Time-motion characteristics and the physiological responses to changes in pitch length are shown in Table 2. From the qualitative assessment, there were almost certain differences for RPE, TD, peak speed and PL when pitch width was changed from narrow to wide. The differences observed for the heart rate were almost certainly in the narrow SSGs and likely in the wide SSGs. Additionally, substantial differences were found for moderate and high accelerations and for high decelerations in the narrow SSGs, while the frequency of decelerations decreased when the length of the pitch was increased. In the wide SSGs, there was a significantly higher frequency of moderate-intensity COD on the short pitch as well as a higher frequency of high-intensity decelerations.
Table 2.
Physiological responses and time-motion characteristics to changes in pitch length during small-sided games.
| Variable | SN | LN | Dif | ES ±90% CL | Qualitative Assessment |
|---|---|---|---|---|---|
| %HRmax (%) | 83.4 ± 5.1 | 87.7 ± 4.0 | 5% | 0.81 ± 0.22 | Almost certainly |
| RPE (AU) | 3.8 ± 1.5 | 6.3 ± 1.4 | 66% | 1.34 ± 0.43 | Almost certainly |
| TD (m·min-1) | 101.2 ± 11.8 | 126.6 ± 13.4 | 25% | 1.78 ± 0.20 | Almost certainly |
| Peak speed (m·s-1) | 4.8 ± 0.4 | 6.1 ± 0.6 | 27% | 2.67 ± 0.61 | Almost certainly |
| Player load (AU) | 75.0 ± 13.2 | 85.1 ± 12.5 | 14% | 0.70 ± 0.15 | Almost certainly |
| Moderate accelerations (n) | 1.8 ± 1.7 | 1.9 ± 1.9 | 6% | 0.12 ± 0.47 | Unclear |
| High accelerations (n) | 2.0 ± 1.6 | 1.2 ± 1.0 | -40% | 0.68 ± 0.74 | Likely |
| Moderate decelerations (n) | 3.3 ± 2.5 | 2.7 ± 1.4 | -18% | 0.44 ± 0.48 | Likely |
| High decelerations (n) | 1.15 ± 1.6 | 0.7 ± 0.8 | -39% | 0.66 ± 0.91 | Likely |
| Moderate-intensity COD (n) | 8.6 ± 4.6 | 6.9 ± 2.4 | -20% | 0.29 ± 0.39 | Unclear |
| High-intensity COD (n) | 3.0 ± 2.3 | 2.4 ± 1.5 | -20% | 0.33 ± 0.50 | Unclear |
| %HRmax (%) | 84.3 ± 4.8 | 86.5 ± 4.5 | 3% | 0.43 ± 0.30 | Likely |
| RPE (AU) | 4.9 ± 1.0 | 6.6 ± 1.2 | 35% | 1.26 ± 0.51 | Almost certainly |
| TD (m·min-1) | 107.7 ± 12.8 | 131.4 ± 14.4 | 22% | 1.60 ± 0.31 | Almost certainly |
| Peak speed (m·s-1) | 5.2 ± 0.7 | 6.2 ± 0.6 | 19% | 1.30 ± 0.54 | Almost certainly |
| Player load (AU) | 78.8 ± 12.9 | 86.2 ± 14.7 | 9% | 0.53 ± 0.29 | Very likely |
| Moderate accelerations (n) | 2.0 ± 1.6 | 1.4 ± 1.3 | -30% | 0.05 ± 0.70 | Unclear |
| High accelerations (n) | 1.7 ± 1.5 | 0.9 ± 1.1 | -47% | 0.26 ± 0.64 | Unclear |
| Moderate decelerations (n) | 1.8 ± 1.3 | 1.4 ± 1.4 | -22% | 0.03 ± 0.54 | Unclear |
| High decelerations (n) | 1.5 ± 1.0 | 0.4 ± 0.6 | -73% | 0.76 ± 0.78 | Likely |
| Moderate-intensity COD (n) | 7.3 ± 3.9 | 4.5 ± 2.1 | -38% | 0.66 ± 0.40 | Very likely |
| High-intensity COD (n) | 2.0 ± 1.1 | 1.8 ± 1.6 | -10% | 0.14 ± 0.48 | Unclear |
CL – confidence level; Dif – difference; ES – effect size; AU – arbitrary units; TD, total distance covered per minute: n – frequency; SN – short narrow; SW – short wide; LN – long narrow; LW – long wide.
Figure 1.
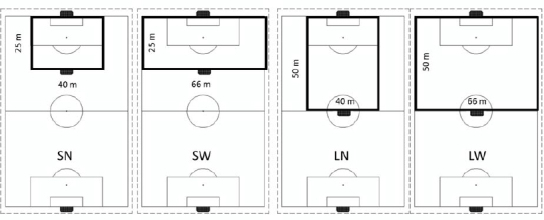
Dimensions for each small-sided game format. SN indicates short narrow, SW is short wide, LN is long narrow and LW is long wide.
Table 3 shows the responses for changes in SSG pitch width. Comparisons were made between the two short pitches (SN vs SW) and the two long pitches (LN vs LW), separately. Differences in long pitch SSGs were found only for the number of moderate-intensity COD, while in the short pitch, differences were found for RPE, moderate decelerations, TD, and peak speed. Substantial differences were detected for PL and high-intensity COD.
Table 3.
Physiological responses and time-motion characteristics to changes in pitch width during SSGs.
| Variable | SN | SW | Dif | ES ±90% CL | Qualitative Assessment |
|---|---|---|---|---|---|
| %HRmax (%) | 83.4 ± 5.1 | 84.3 ± 4.8 | 1% | 0.18 ± 0.23 | Unclear |
| RPE (AU) | 3.8 ± 1.5 | 4.9 ± 1.0 | 29% | 0.76 ± 0.36 | Almost certainly |
| TD (m·min-1) | 101.2 ± 11.8 | 107.7 ± 12.8 | 6% | 0.49 ± 0.26 | Very likely |
| Peak speed (m·s-1) | 4.8 ± 0.4 | 5.2 ± 0.7 | 8% | 1.02 ± 0.69 | Very Likely |
| Player load (AU) | 75.0 ± 13.2 | 78.8 ± 12.9 | 5% | 0.28 ± 0.16 | Likely |
| Moderate accelerations (n) | 1.8 ± 1.7 | 2.0 ± 1.6 | 11% | 0.01 ± 0.55 | Unclear |
| High accelerations (n) | 2.0 ± 1.6 | 1.7 ± 1.5 | -15% | 0.12 ± 0.60 | Unclear |
| Moderate decelerations (n) | 3.3 ± 2.5 | 1.8 ± 1.3 | -45% | 1.07 ± 0.43 | Almost certainly |
| High decelerations (n) | 1.15 ± 1.6 | 1.5 ± 1.0 | 30% | 0.24 ± 0.78 | Unclear |
| Moderate-intensity COD (n) | 8.6 ± 4.6 | 7.3 ± 3.9 | -15% | 0.37 ± 0.45 | Unclear |
| High-intensity COD (n) | 3.0 ± 2.3 | 2.0 ± 1.1 | -33% | 0.61 ± 0.58 | Likely |
| %HRmax (%) | 87.7 ± 4.0 | 86.5 ± 4.5 | -1% | 0.43 ± 0.30 | Unclear |
| RPE (AU) | 6.3 ± 1.4 | 6.6 ± 1.2 | 5% | 0.21 ± 0.43 | Unclear |
| TD (m·min-1) | 126.6 ± 13.4 | 131.4 ± 14.4 | 4% | 0.30 ± 0.25 | Unclear |
| Peak speed (m·s-1) | 6.1 ± 0.6 | 6.2 ± 0.6 | 2% | 0.20 ± 0.28 | Unclear |
| Player load (AU) | 85.1 ± 12.5 | 86.2 ± 14.7 | 1% | 0.06 ± 0.21 | Unlikely |
| Moderate accelerations (n) | 1.9 ± 1.9 | 1.4 ± 1.3 | -26% | 0.02 ± 0.65 | Unclear |
| High accelerations (n) | 1.2 ± 1.0 | 0.9 ± 1.1 | -25% | 0.00 ± 0.60 | Unclear |
| Moderate decelerations (n) | 2.7 ± 1.4 | 1.4 ± 1.4 | -48% | 0.38 ± 0.68 | Unclear |
| High decelerations (n) | 0.7 ± 0.8 | 0.4 ± 0.6 | -43% | 0.29 ± 0.61 | Unclear |
| Moderate-intensity COD (n) | 6.9 ± 2.4 | 4.5 ± 2.1 | -35% | 0.72 ± 0.28 | Almost certainly |
| High-intensity COD (n) | 2.4 ± 1.5 | 1.8 ± 1.6 | -25% | 0.14 ± 0.48 | Unclear |
CL confidence level; Dif – difference; ES – effect size; AU – arbitrary units; TD – total distance covered per minute: n – frequency; SN – short narrow; SW – short wide; LN – long narrow; LW – long wide.
Figure 2 shows the distances covered in the different speed categories for each of the SSGs. An increase in pitch width was shown to influence physical loads, with an increase in the distance covered on the shortest pitches in the range <7.0 km·h-1 (299 ± 22 vs 285 ± 36 m; ES = 0.66 ± 0.42), yet on the longest pitches the value ranged between 7.0 and 12.9 km·h-1 (263 ± 55 vs 290 ± 66 m; ES = 0.43 ± 0.30), 13.0 and 17.9 km·h-1 (48 ± 27 vs 69 ± 33 m; ES = 0.57 ± 0.36) and 18 and 20.9 km·h-1 (27 ± 18 vs 36 ± 16 m; ES = 0.44 ± 0.31).
Figure 2.
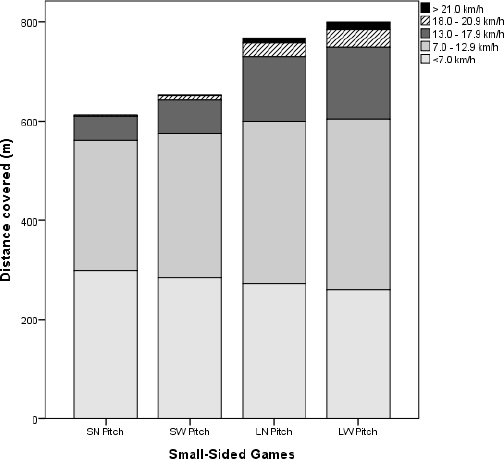
Distance covered in different speed categories for each small-sided game format. SN indicates short narrow, SW is short wide, LN is long narrow and LW is long wide.
Increasing pitch length revealed a significant increase in the distance covered on the narrow pitch <7.0 km·h-1 (299 ± 22 vs 272 ± 42 m; ES = 0.63 ± 0.25), 7.0 - 12.9 km·h-1 (263 ± 55 vs 329 ± 65 m; ES = 1.24 ± 0.28), 13.0 - 17.9 km·h-1 (48 ± 27 vs 131 ± 39 m; ES = 3.4 ± 0.70) and 18.0 - 21.0 km·h-1 (2 ± 4 vs 27 ± 18 m; ES = 2.8 ± 1.12). On the wide pitch, differences were observed for the distance covered <7.0 km·h-1 (285 ± 36 vs 260 ± 24 m; ES = 0.92 ± 0.64) and 7.0 - 12.9 km·h-1 (290 ± 66 vs 345 ± 69 m; ES = 0.84 ± 0.47), and also for 13.0 - 17.9 km·h-1 (69 ± 33 vs 145 ± 41 m; ES = 1.32 ± 0.34) and 18.0 - 21.0 km·h-1 (8 ± 8 vs 36 ± 16 m; ES = 1.76 ± 0.54).
Discussion
This study examined the influence of separately modifying the width and the length of a SSG pitch on physiological and time-motion characteristics of soccer players. Although studies have demonstrated that increasing the total surface area of a pitch increases the physiological demands (Aroso et al., 2004; Casamichana and Castellano, 2010; Owen et al., 2004; Rampinini et al., 2007; Williams and Owen, 2007), it is not known whether modifying just one dimension (width or length) has the same effect. The main finding from the present study is that modifying length places greater physiological demands on players than modifying width. It would therefore appear that distance between goals has a greater impact on physiological loads than distance between the side lines. However, not all load indicators move in the same direction, highlighting the need to study how different variables respond during the monitoring of training sessions (Casamichana et al., 2013). The principal application of this research is that all formats of SSG had high cardiovascular demands, but coaches wishing to focus on neuromuscular responses associated with accelerations, decelerations, and changes of direction should design SSGs to be played on short pitches, whereas those wishing to work on high-speed movements should design SSGs on larger pitches, giving priority to length rather than width for the same playing surface.
In the present study, physiological responses varied minimally and we only observed differences between SN and LN (5% increase in %HRmax). The %HRmax values observed in all four SSGs (range, 83-87%) were consistent with rates reported by other studies of SSGs in soccer (Brandes et al., 2011; Hill-Haas et al., 2009). The SSG format also appears to be an effective means of improving endurance in soccer players (Dellal et al., 2008; Rampinini et al., 2007).
In the present study, similar variations were observed for the distance covered, peak speed, and player loads, with increases seen for all variables in SSGs played on the longer pitches. However, when the width of the pitch was increased, an increase in physical demands placed on players was only observed on the short pitch. One possible explanation for these results is that goal-scoring situations are more common in SSGs (Casamichana and Castellano, 2010), meaning that players are predominantly located in the centre of the playing area, leaving the wide areas free. This is a similar situation to that seen in goal areas during competitive matches (Castellano et al., 2013a). It is also important to note that our results may have been influenced by the fact that the increase in the length of the pitch accounted for a 100% increase (from 25 to 50 m), while that of the width accounted for an increase of just 60% (from 40 to 66 m). The findings of our study appear to support the theory that players’ loads are strongly impacted by the vertical component due to strikes in running (Davies et al., 2013), while 2D players’ loads may be a better reflection of agility demands (Davies et al., 2013).
Using a longer pitch increased distances covered in the different speed categories, regardless of width. The distance covered increased in all speed categories for games played on the narrow pitches and increased substantially in all categories on the wide pitches. However, the distance covered was higher in the stop-walk category in games played on short pitches than in those played on long pitches, regardless of width. With respect to the increase in width, a substantial increase in distance covered was observed in the lower speed categories (-5% for stop-walk category, 9% for the 7.0-12.9 km·h-1 category and 31% for 13.0-17.9 km·h-1 category) for the games played on the short pitch. For the long pitch, a substantial difference (35%) was seen only in the 18-20.9 km·h-1 category. Perhaps doubling the length of the narrow pitch (from 40 × 25 m, i.e. 100 m2 per player to 40 × 50 m, i.e. 165 m2 per player) was sufficient to increase physical demands. However, increasing the width of the long pitch from 40 × 50 m (200 m2 per player) to 66 × 50 m (330 m2 per player) resulted in hardly any changes in players’ responses, possibly because the members of both attacking and defending teams tended to cluster closer together in the central areas in search of a goal opportunity (Castellano et al., 2013a).
Analysing the frequency of accelerations of different intensity during training could provide information on neuromuscular training responses (Osgnach et al., 2010). Indeed, accelerations are an increasing focus of research in both competitive soccer games and training sessions (Akenhead et al., 2013; Castellano and Casamichana, 2013). The present results seem to indicate that increasing the length of narrow pitches leads to a substantial reduction in the frequency of high accelerations (2.0 vs 1.2; ES = 0.7), high decelerations (1.15 vs 0.7; ES = 0.7) and moderate accelerations (3.3 vs 2.7; ES = 0.4), In contrast, the present study only observed a substantial reduction in the number of high accelerations (1.5 vs 0.4; ES = 0.8) when the length of the narrow pitch was increased. In SSGs on short pitches, where players are closer to both their opponents and to the goal, there are more actions leading up to a shot (Casamichana and Castellano, 2010), possibly explaining the higher frequency of accelerations. Another possible explanation for the higher number of accelerations on short narrow pitches is related to the density of players relative to the surface area of the pitch (100 m2 in SN and 200 m2 in the LN). In other words, in higher density situations, players would be required to make more agility maneuvers (Davies et al., 2013) due to the proximity of their opponents. This is also relevant to match play with central players in the English Premier League producing shorter high-intensity and sprinting bouts than wide players due to great player density in central regions (Bush et al., 2015).
Some of the principal limitations of our study were that the order of the SSGs was not randomized. Although players were accustomed to this quantity and type of SSGs, fatigue could have affected the players’ responses. To avoid this situation, a recovery period of 8 min was included in the study. Previous studies suggest recovery times >4 min do not impact the physical and physiological demands of multiple SSGs (Köklü et al., 2015). Finally, this study fails to provide information on the technical and tactical demands, which would have provided additional insight into strategic behavior during various SSGs (Casamichana and Castellano, 2010; Castellano et al., 2016, 2017).
Interestingly, width does not appear to alter the frequency of accelerations or decelerations, as we only found differences for moderate decelerations, which decreased when the width of the short pitch (25 m) was changed from 40 to 66 m. Thus, coaches wishing to increase accelerations should focus on SSGs played on short pitches. These results confirm the finding of Castellano and Casamichana (2013) that different-intensity accelerations were more common in SSGs than in friendly soccer matches.
References
- Ade J, Harley J, Bradley PS. The physiological response, time-motion characteristics and reproducibility of various speed endurance drills in elite youth soccer players: small sided games vs generic running. Int J Sports Physiol Perform. 2014;9:471. doi: 10.1123/ijspp.2013-0390. –. [DOI] [PubMed] [Google Scholar]
- Akenhead R, Hayes P, Thompson K, French D. Diminutions of acceleration and deceleration output during professional football match play. J Sci Med Sport. 2013;16(6):556. doi: 10.1016/j.jsams.2012.12.005. –. [DOI] [PubMed] [Google Scholar]
- Aroso J, Rebelo N, Gomes-Pereira J. Physiological impact of selected game related exercises. J Sports Sci. 2004;22(6):522. [Google Scholar]
- Aughey RJ. Increased high-intensity activity in elite Australian football finals matches. Int J Sports Physiol Perform. 2011;6(3):367. doi: 10.1123/ijspp.6.3.367. –. [DOI] [PubMed] [Google Scholar]
- Bangsbo J, Laia FM, Krustrup P. The Yo-Yo Intermittent Recovery Test: A Useful Tool for Evaluation of Physical Performance in Intermittent Sports. Sports Med. 2008;38(1):37. doi: 10.2165/00007256-200838010-00004. –. [DOI] [PubMed] [Google Scholar]
- Batterham AM, Hopkins WG. Making meaningful inferences about magnitudes. Int J Sports Physiol Perform. 2006;1(1):50. –. [PubMed] [Google Scholar]
- Brandes M, Heitmann A, Müller L. Physical responses of different small-sided game formats in elite youth soccer players. J Strength Cond Res. 2011;26:1353. doi: 10.1519/JSC.0b013e318231ab99. –. [DOI] [PubMed] [Google Scholar]
- Bush M, Barnes C, Hogg B, Archer D, Bradley PS. Evolution of Match Performance Parameters for Various Playing Positions in the English Premier League. Hum Movement Sci. 2015;39:1. doi: 10.1016/j.humov.2014.10.003. –. [DOI] [PubMed] [Google Scholar]
- Casamichana D, Castellano J. Time-motion heart rate perceptual and motor behaviour demands in small-sides soccer games: Effects of pitch size. J Sports Sci. 2010;28(14):1615. doi: 10.1080/02640414.2010.521168. –. [DOI] [PubMed] [Google Scholar]
- Casamichana D, Castellano J, Calleja-González J, San Román J, Castagna C. Relationship between indicators of training load in soccer players. J Strength Cond Res. 2013;27(2):269. doi: 10.1519/JSC.0b013e3182548af1. –. [DOI] [PubMed] [Google Scholar]
- Castellano J, Álvarez D, Blanco-Villaseñor A. Analyzing the space for interaction in soccer. Rev Psi Deporte. 2013a;22(2):437. –. [Google Scholar]
- Castellano J, Álvarez-Pastor D, Figueira B, Coutinho D, Sampaio J. Identifying the effects from the quality of opposition in a Football team positioning strategy. I J Perform Ana Sport. 2013b;13(3):822. –. [Google Scholar]
- Castellano J, Casamichana D. Differences in the number of accelerations between small-sided games and friendly matches in soccer. J Sports Sci Med. 2013c;12:209. –. [PMC free article] [PubMed] [Google Scholar]
- Castellano J, Casamichana D, Calleja-González J, Román JS, Ostojic SM. Reliability and Accuracy of 10 Hz GPS Devices for Short-Distance Exercise. J Sports Sci Med. 2011;10:233. –. [PMC free article] [PubMed] [Google Scholar]
- Castellano J, Casamichana D, Dellal A. Influence of game format and number of players on heart rate responses and physical demands in small-sided soccer games. J Strength Cond Res. 2013d;27(5):12951303. doi: 10.1519/JSC.0b013e318267a5d1. [DOI] [PubMed] [Google Scholar]
- Castellano J, Fernández E, Echeazarra I, Barreira D, Garganta J. Influence of pitch length on inter- and intra-team behaviors in youth soccer. Anales psic. 2017;33(3):486. –. [Google Scholar]
- Castellano J, Puente A, Casamichana D, Etxeazarra I. Influence of the number of players and the relative pitch area per player on heart rate and physical demands in youth soccer. J Strength Cond Res. 2015;29(6):1683. doi: 10.1519/JSC.0000000000000788. –. [DOI] [PubMed] [Google Scholar]
- Castellano J, Silva P, Usabiaga O, Barreira D. The influence of scoring targets and outer-floaters on attacking and defending team dispersion, shape and creation of space during small-sided soccer games. J Hum Kinet. 2016;51:153. doi: 10.1515/hukin-2015-0178. –. [DOI] [PMC free article] [PubMed] [Google Scholar]
- Davies M, Young W, Farrow D, Bahnert A. Comparison of agility demands of small-sided games in elite Australian football. Int J Sports Physiol Perform. 2013;8:139. doi: 10.1123/ijspp.8.2.139. –. [DOI] [PubMed] [Google Scholar]
- Dellal A, Chamari K, Pintus A, Girard O, Cotte T, Keller D. Heart rate responses during small-sided games and short intermittent running training in elite soccer players: a comparative study. J Strength Cond Res. 2008;22:1449. doi: 10.1519/JSC.0b013e31817398c6. –. [DOI] [PubMed] [Google Scholar]
- Drust B, Waterhouse J, Atkinson G, Edwards B, Reilly T. Circadian rhythms in sports performance--an update. Chronobiology international. 2005;22(1):21. doi: 10.1081/cbi-200041039. –. [DOI] [PubMed] [Google Scholar]
- Fanchini M, Ghielmetti R, Coutts AJ, Schena F, Impellizzeri FM. Effect of training-session intensity distribution on session rating of perceived exertion in soccer players. Int J Sports Physiol Perform. 2015;10(4):426. doi: 10.1123/ijspp.2014-0244. –. [DOI] [PubMed] [Google Scholar]
- Ford PR, Yates I, Williams AM. An analysis of practice activities and instructional behaviours used by youth soccer coaches during practice: exploring the link between science and application. J Sports Sci. 2010;28(5):483. doi: 10.1080/02640410903582750. –. [DOI] [PubMed] [Google Scholar]
- Foster C. Monitoring training in athletes with reference to overtraining syndrome. Med Sci Sports Exerc. 1998;30(7):1164. doi: 10.1097/00005768-199807000-00023. –. [DOI] [PubMed] [Google Scholar]
- Frencken W, Van der Plaats J, Visscher C, Lemmink K. Size matters: Pitch dimensions constrain interactive team behaviour in soccer. J Syst Sci Complex. 2013;26(1):85. –. [Google Scholar]
- Gonçalves B, Esteves P, Folgado H, Ric A, Torrents C, Sampaio J. Effects of pitch area-restrictions on tactical behavior, physical and physiological performances in soccer large-sided games. J Strength Cond Res. 2017;31(9):2398. doi: 10.1519/JSC.0000000000001700. –. [DOI] [PubMed] [Google Scholar]
- Hill-Haas S, Dawson B, Coutts A, Rowsell G. Physiological responses and time-motion characteristics of various small-sided soccer games in youth players. J Sports Sci. 2009;27:1. doi: 10.1080/02640410902761199. –. [DOI] [PubMed] [Google Scholar]
- Hill-Haas S, Dawson B, Impellizzeri FM, Coutts A. Physiology of small sided games training in football. A systematic review. Sports Med. 2011;41(3):199. doi: 10.2165/11539740-000000000-00000. –. [DOI] [PubMed] [Google Scholar]
- Hodgson C, Akenhead R, Thomas K. Time-motion analysis of acceleration demands of 4v4 small-sided soccer games played on different pitch sizes. Hum Mov Sci. 2014;33:25. doi: 10.1016/j.humov.2013.12.002. –. [DOI] [PubMed] [Google Scholar]
- Hopkins WG, Marshall SW, Batterham AM, Hanin J. Progressive statistics for studies in sports medicine and exercise science. Med Sci Sports Exerc. 2009;41:3. doi: 10.1249/MSS.0b013e31818cb278. –. [DOI] [PubMed] [Google Scholar]
- Impellizzeri FM, Marcora SM, Castagna C, Reilly T, Sassi A, Iaia FM, Rampinini E. Physiological and performance effects of generic versus specific aerobic training in soccer players. Int J Sports Med. 2006;27(6):483. doi: 10.1055/s-2005-865839. –. [DOI] [PubMed] [Google Scholar]
- Kelly DM, Drust B. The effect of pitch dimensions on heart rate responses and technical demands of small-sided soccer games in elite players. J Sci Med Sport. 2009;12(4):475. doi: 10.1016/j.jsams.2008.01.010. –. [DOI] [PubMed] [Google Scholar]
- Köklü Y, Alemdaroğlu U, Dellal A, Wong DP. Effect of different recovery durations between bouts in 3-aside games on youth soccer players' physiological responses and technical activities. J Sports Med Phys Fitness. 2015;55(5):430. –. [PubMed] [Google Scholar]
- Krustrup P, Mohr M, Amstrup T, Rysgaard T, Johansen J, Pedersen P, Bangsbo J. The Yo-Yo intermittent recovery test: physiological response, reliability, and validity. Med Sci Sports Exerc. 2003;35(4):697. doi: 10.1249/01.MSS.0000058441.94520.32. –. [DOI] [PubMed] [Google Scholar]
- Maszczyk A, Gołaś A, Pietraszewski P, Roczniok R, Zając A, Stanula A. Application of Neural and Regression Models in Sports Results Prediction. Procedia - Soci Behavio Sci. 2014;117:482. –. [Google Scholar]
- Osgnach C, Poser S, Bernardini R, Rinaldo R, di Prampero PE. Energy cost and metabolic power in elite soccer: a new match analysis approach. Med Sci Sports Exerc. 2010;42(1):170. doi: 10.1249/MSS.0b013e3181ae5cfd. –. [DOI] [PubMed] [Google Scholar]
- Owen A, Twist C, Ford F. Small-sided games: the physiological and technical effect of altering pitch size and player numbers. Insight. 2004;7(2):50. –. [Google Scholar]
- Rampinini E, Impellizzeri F, Castagna C, Abt G, Chamari K, Sassi A, Marcora SM. Factors influencing physiological responses to small-sided soccer games. J Sports Sci. 2007;25:659. doi: 10.1080/02640410600811858. –. [DOI] [PubMed] [Google Scholar]
- Stone M, Kilding A. Aerobic conditioning for team sport athletes. Sports Med. 2009;39(8):615. doi: 10.2165/00007256-200939080-00002. –. [DOI] [PubMed] [Google Scholar]
- Suarez-Arrones L, Núñez J, Munguía-Izquierdo D, Portillo J, Mendez-Villanueva A. Impact of Several Matches Within a Day on Physical Performance in Rugby Sevens Referees. Int J Sports Physiol Perform. 2013;8:496. doi: 10.1123/ijspp.8.5.496. –. [DOI] [PubMed] [Google Scholar]
- Tessitore A, Meeusen R, Piacentini M, Demarie S, Capranica L. Physiological and technical aspects of ''6-aside'' soccer drills. J Sports Med Phys Fitness. 2006;46(1):36. –. [PubMed] [Google Scholar]
- Varley MC, Fairweather IH, Aughey RJ. Validity and reliability of GPS for measuring instantaneous velocity during acceleration, deceleration, and constant motion. J Sports Sci. 2012;30:121. doi: 10.1080/02640414.2011.627941. –. [DOI] [PubMed] [Google Scholar]
- Williams K, Owen A. The impact of players numbers on the physiological responses to small sided games. J Sports Sci Med. 2007;6(10):100. Supl. [Google Scholar]