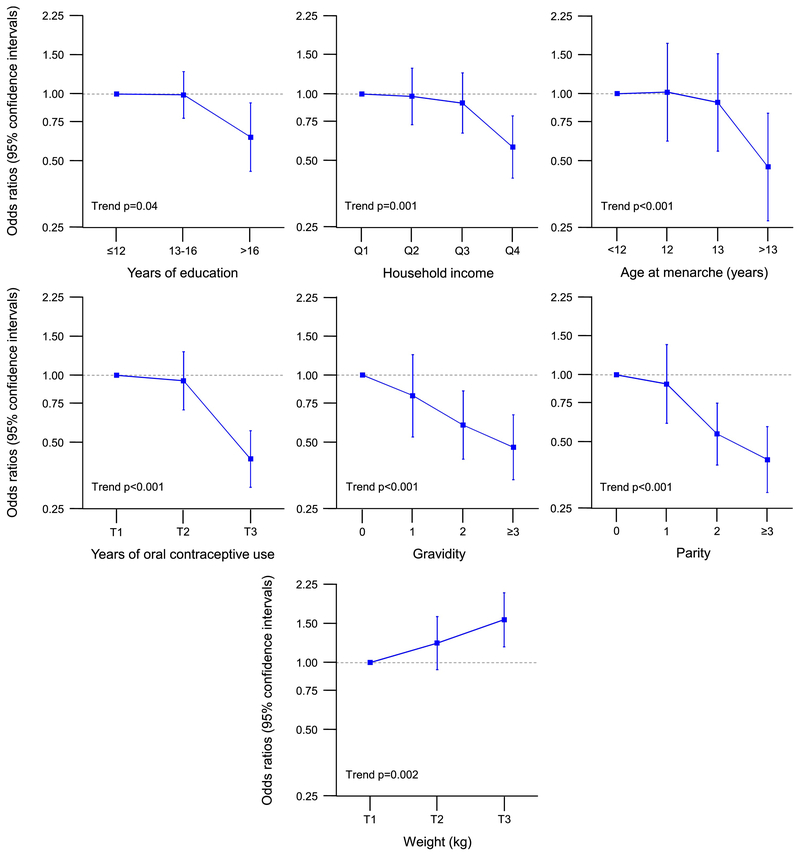
Fig. 3.
Dose-effect trend analyses for women who underwent bilateral oophorectomy with a benign ovarian indication (all ages; Table 3 and Supplementary Table 1; only significant trends). The results are shown as odds ratios and 95% confidence intervals adjusted for race, education, and income (when applicable). Q1–Q4 = four quartiles; T1–T3 = three tertiles.

