. 2018 Oct 26;7:e37344. doi: 10.7554/eLife.37344

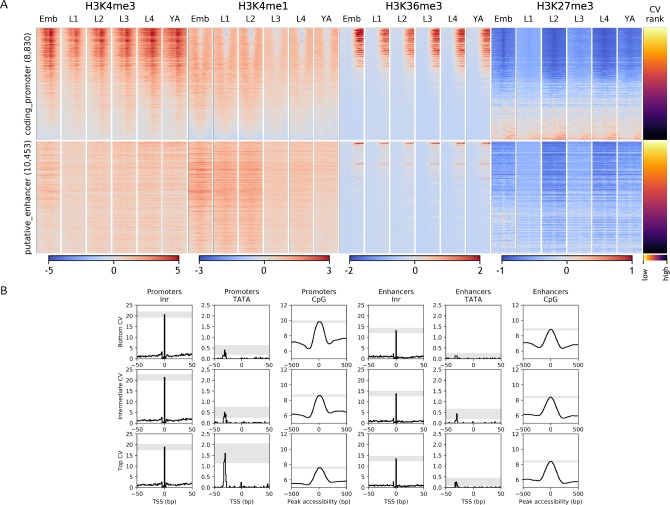
Figure 3. Chromatin state and sequence features of promoters and enhancers.

(A) Heatmaps of indicated histone modifications and CV values at coding promoters (top), and enhancers (bottom), aligned at element midpoints. Elements are ranked by mean H3K4me3 levels. Low CV values indicate broad expression across development and cell types and high CV values indicate regulated expression. Promoters of genes with low CV values have high H3K4me3 levels. (B) Distribution of initiator Inr motif, TATA motif, and CpG content at coding promoters and enhancers, separated by H3K4me3 level (top, middle, and bottom thirds). Grey-shaded regions represent 95% confidence intervals of the sample mean at the genomic position with the highest signal.

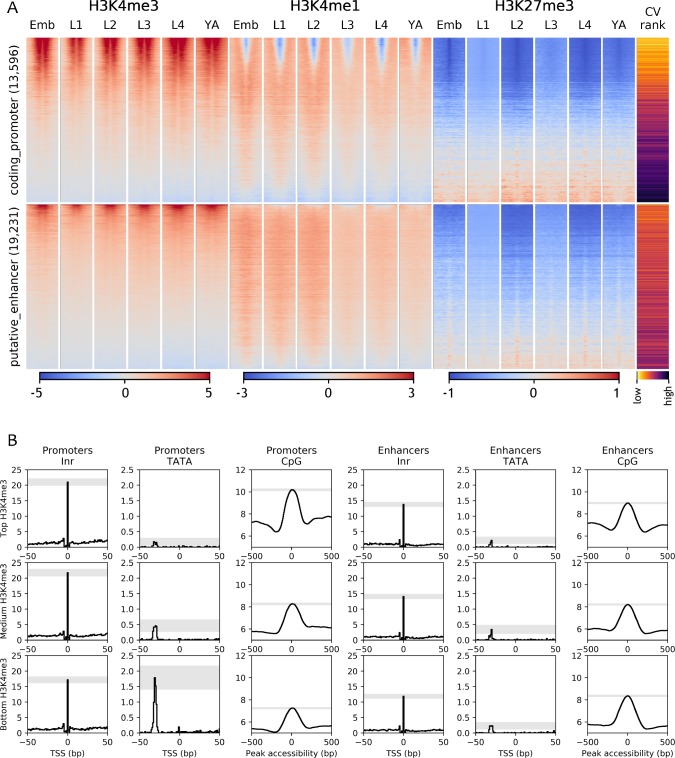
Figure 3.

Figure 3—figure supplement 1. Chromatin state and sequence features of promoters and enhancers sorted by CV value.

Figure 3—figure supplement 1.

(A) Heatmaps of indicated histone modifications and CV values at coding promoters (top), and enhancers (bottom). Elements are ranked by CV value. Low CV values indicate broad expression across development and cell types and high CV values indicate regulated expression. H3K4me3, H3K4me1, and H3K27me3 signals are aligned at element midpoints; H3K36me3 is aligned at the start of the associated gene annotation. (B) Distribution of initiator Inr motif, TATA motif, and CpG content at coding promoters and enhancers, separated by CV value (top (high CV), middle, and bottom (low CV)). Grey-shaded regions represent 95% confidence intervals of the sample mean at the genomic position with the highest signal.