Abstract
Introduction:
Connecting local hemodynamics, biomechanics and tissue properties in cerebral aneurysms is important for understanding the processes of wall degeneration and subsequent aneurysm progression and rupture. This challenging problem requires integration of data from multiple sources.
Methods:
This paper describes tools and techniques developed to integrate data from multiple sources, including clinical information, 3D imaging, intra-operative videos, ex-vivo micro-CT, and multi-photon microscopy. Central to this approach is a 3D tissue model constructed from micro-CT images of aneurysm samples resected during neurosurgery. This model is aligned to vascular models constructed from 3D clinical images and is used to map and compare flow, biomechanics, and tissue data.
Results:
The approach is illustrated with data of three human intracranial aneurysms. These case studies demonstrated the ability of this approach to study relationships between different factors affecting the aneurysm wall, and produced provocative observations that will be further studied with larger series. For instance, “atherosclerotic” and “hyperplastic” looking parts of the aneurysm corresponded to thicker walls and occurred in regions of recirculating flow and low wall shear stress (WSS); thin regions were associated with inflow jets, flow impingement and high WSS; blebs had walls of varying structure, including calcified, thin or hyperplastic walls.
Conclusions:
The current approach enables the study of interactions of multiple factors thought to be responsible for the progressive degradation and weakening of the aneurysm wall during its evolution.
This paper describes tools and techniques for integrating data from multiple sources, including clinical information, 3D imaging, intra-operative videos, ex-vivo micro-CT, and multi-photon microscopy. Central is a micro-CT based 3D tissue model of aneurysm samples resected during neurosurgery. This model is aligned to vascular models from 3D clinical images and used to map and compare flow, biomechanics, and tissue data. This enables studying interactions of multiple factors thought to be responsible for the progressive wall degradation and weakening.
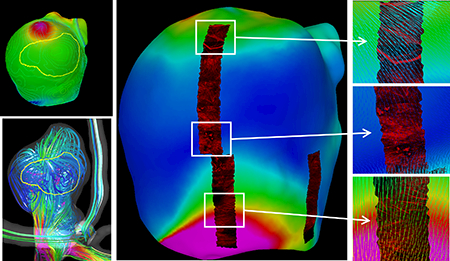
Introduction
Effective assessment of rupture risk of intracranial aneurysms as well as the development of novel therapies and devices for their treatment require detailed understanding of the mechanisms that drive the degeneration and weakening of the aneurysm wall. Despite important advances identifying numerous risk factors for aneurysm growth and rupture [1–3], including patient demographics, aneurysm anatomical location, geometry and hemodynamics, these mechanisms remain poorly understood. The main reason is the lack of studies connecting these risk factors to the biological processes that govern the progressive degeneration and remodeling of the wall that drive the aneurysm towards rupture or stabilization. This is a challenging task because it requires studies that combine data from multiple sources and scales, including clinical and patient demographic information, geometrical and anatomical data, biomechanical data, and tissue data. This challenge is further compounded by the small size of the samples [4] and the great heterogeneity that can be found within even a single aneurysm.
A few previous studies have connected hemodynamics and tissue appearance observed in intra-operative videos [5,6], hemodynamics and histological analysis of the vascular wall [7,8], hemodynamics and local geometrical features of the wall such as blebs [9,10], hemodynamics and tissue mechanical strength [11], and hemodynamics and rupture points [12–14]. Many of these studies only considered global hemodynamic or single tissue characteristics. However, the aneurysm wall is heterogeneous [4,15] and therefore it is necessary to study the connections between the local flow conditions and the local wall characteristics to understand aneurysm progression.
The purpose of this article is to describe a framework for integrating and processing data from multiple sources and enable studies that connect clinical, anatomical, biomechanical and tissue microstructural data. In particular, building upon previous work [16], we describe several additional techniques and tools developed to quantify and compare different characteristics of the aneurysm wall and biomechanical environment, and illustrate them on data from human aneurysms.
Methods
Strategy Overview
An overview of the strategy for connecting data from multiple sources is schematically presented in Figure 1. This approach considers patients with intracranial aneurysms that are selected for surgical clipping. Prior to surgery, clinical and demographic information is gathered through a patient questionnaire. Pre-operative 3D images, 3D rotational angiography (3DRA) or computed tomographic angiography (CTA), are used to construct patient-specific vascular models, which are then used to calculate flow and stress fields using computational fluid dynamics (CFD) and computational solid mechanics (CSM). Regions of the aneurysm with different visual appearance, thought to be indicative of different wall characteristics such as thinning (red appearance) or atherosclerotic/hyperplastic remodeling (yellow or white appearance), are identified in intra-operative videos. When appropriate from the perspective of patient safety, aneurysm tissue samples are resected after clipping. These tissue samples are imaged ex-vivo with micro-CT, and a 3D tissue model is reconstructed from these images. Several tissue characteristics are quantified directly from the micro-CT reconstructions, such as local tissue thickness and wall calcifications. The tissue sample is also imaged with multi-photon microscopy (MPM) to visualize the collagen fiber architecture and cellular content throughout the thickness of the wall in a non-destructive manner in intact samples. During MPM imaging, reference points are identified on the tissue sample to enable alignment of the MPM images on the 3D micro-CT tissue reconstruction. Next, further detailed information about cellular content and other local properties of the wall are obtained using histology. The tissue model is then aligned to the 3D vascular model constructed from the pre-operative images to enable direct comparison of local biomechanical fields and tissue characteristics. In this way, the tissue model is used as a reference onto which all the local biomechanics and wall properties are mapped and quantitatively compared. In what follows we provide more details of each of the procedures involved in this framework.
Figure 1:
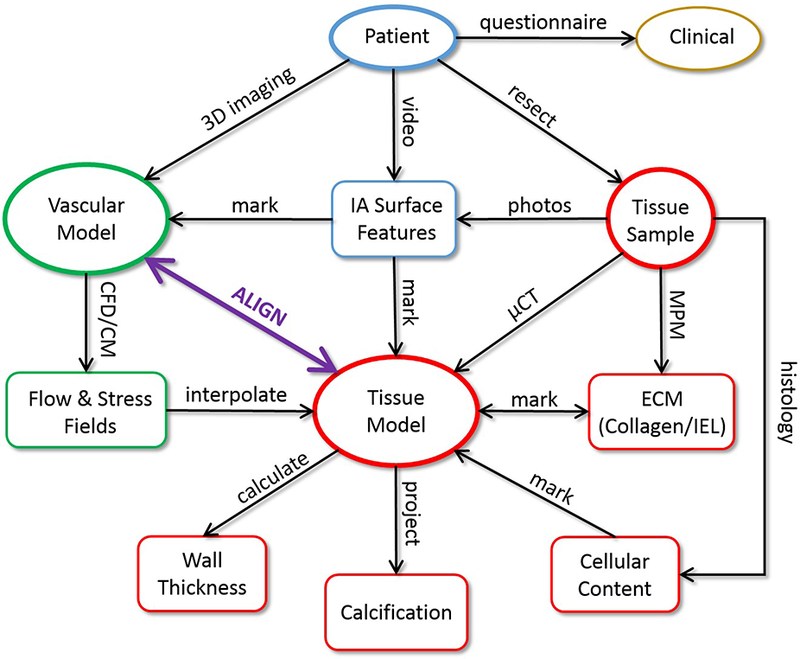
Strategy Overview: 1) patient imaged before surgery, 2) during surgery: aneurysm tissue resected, operation recorded on video, 3) vascular model constructed from 3D pre-surgical images, 4) tissue sample imaged ex-vivo with micro-CT and tissue model reconstructed, 5) tissue model aligned to vascular model, 6) aneurysm surface features identified on surgical video and/or ex-vivo photos of tissue sample and marked on vascular or tissue model, 7) flow and stress fields interpolated to tissue model, 8) tissue sample imaged with MPM, imaging region marked on tissue model using ink markings as guidance, ECM characterized from MPM image stacks, 9) tissue sample analyzed with histology using beads for localization, 10) wall thickness and calcifications quantified on tissue model, 11) local comparison of flow conditions, biomechanics and wall characteristics on different regions of the aneurysm.
Vascular Model Reconstruction, Flow and Biomechanical Modeling
Three-dimensional vascular models of the aneurysms and connected arteries are reconstructed from pre-operative 3D anatomical images using previously developed techniques [17]. Briefly, the luminal vascular surface is reconstructed by threshold segmentation, iso-surface extraction and deformable models. The reconstructed surface is smoothed with a non-shrinking algorithm to eliminate noise, and the vessels are truncated perpendicularly to their axes.
The reconstructed vascular models are used for CFD modeling of blood flow. For this purpose, volumetric meshes composed of tetrahedral elements with a minimum resolution of 0.2 mm are generated filling the intravascular space using an advancing front method. Using these meshes, numerical solutions of the incompressible unsteady Navier-Stokes equations are obtained using finite element methods [18]. Pulsatile flow conditions are prescribed at the model inlet using Womersley profiles [19]. For the purposes of this work, due to lack of patient-specific flow measurements, typical flow waveforms are derived from phase-contrast MR measurements obtained in normal subjects and scaled with a power law of the inlet area [20]. Outflow boundary conditions that produce flow splits consistent with Murray’s law are prescribed at the outlets [21]. Blood is approximated as a Newtonian incompressible fluid of density and viscosity . Vessel walls are approximated as rigid for the CFD studies. Flow simulations are carried out for two cardiac cycles, and the results of the second cycle are used to calculate several fields to characterize the intra-saccular hemodynamic environment [22]. Field variables (time-averaged over the cardiac cycle) defined on the aneurysm wall include: wall shear stress (WSS), oscillatory shear index (OSI), WSS gradient and divergence, relative residence time (RRT), gradient oscillatory number (GON), and dynamic pressure (PRE). Quantities defined for the aneurysm cavity include: inflow rate (Q), mean velocity (VEL), kinetic energy (KE), vorticity (VOR), shear strain rate (SSR), vortex core-line length (CORELEN) – a measure of flow complexity, and POD entropy (PODENT) – a measure of flow instability [23].
The reconstructed vascular models can also be used for CSM modeling of wall biomechanics. For this purpose, volumetric grids composed of prismatic elements are generated by extrusion of the reconstructed luminal surface in the outward normal direction to model the vessel wall thickness. Typical values of wall thickness for the aneurysm and cerebral arteries derived from the literature can be prescribed in most models, due to lack of patient-specific measurements. When aneurysm sample reconstructions can be mapped back to the 3D vascular models (i.e. if the samples are large enough and have surface features that allow alignment) the wall thickness can be estimated from the tissue model as described below. Similarly, hyperelastic material properties of the aneurysm and arteries can be prescribed from the literature [24]. Solutions to the equilibrium equations for the nonlinear hyperelastic materials are obtained using the finite element method, with zero displacement boundary conditions at the boundaries of the solid domain. Results for the intramural stress fields are considered here with respect to the magnitude and direction of the principal stresses [14].
3D Models of Resected Aneurysm Tissue
Aneurysm samples are harvested following surgical clipping (in cases where there is sufficient tissue above the clipped region) from three sites – Alleghany General Hospital (AGH) (Pittsburgh, PA, USA), University of Illinois at Chicago (UIC) (Chicago, IL, USA) and Helsinki University Hospital (HUH) (Helsinki, Finland). Harvested tissue from UIC and AGH were placed in a vial with a 0.9% saline solution, transported to the University of Pittsburgh and then fixed in 4% paraformaldehyde within 12 h of harvest. Samples from HUH are transported to PITT after fixation in 10% formalin. The tissue samples are then imaged with high resolution micro-CT, that produces a 3D stack of images with a 3μm isotropic resolution using previously described techniques [16]. Prior to imaging, small ink markings are placed on the tissue sample which can be viewed during subsequent MPM and histological analysis. In order to image these same locations under micro-CT, 200 – 300 μm size polystyrene beads (Polysciences Inc., Warrington, PA) are fixed on top of the ink markings prior to micro-CT scanning. A tissue surface model is then reconstructed from the micro-CT images using a Simpleware ScanIP (Synopsis, Mountain View, CA) to perform segmentation and Gaussian smoothing, followed by a coarse surface mesh generation. This geometry is then split into inner (luminal) and outer (abluminal) surfaces using cutting planes. These surfaces are further processed to eliminate small imperfections and repair topological defects. The process is illustrated in Figure 2.
Figure 2:
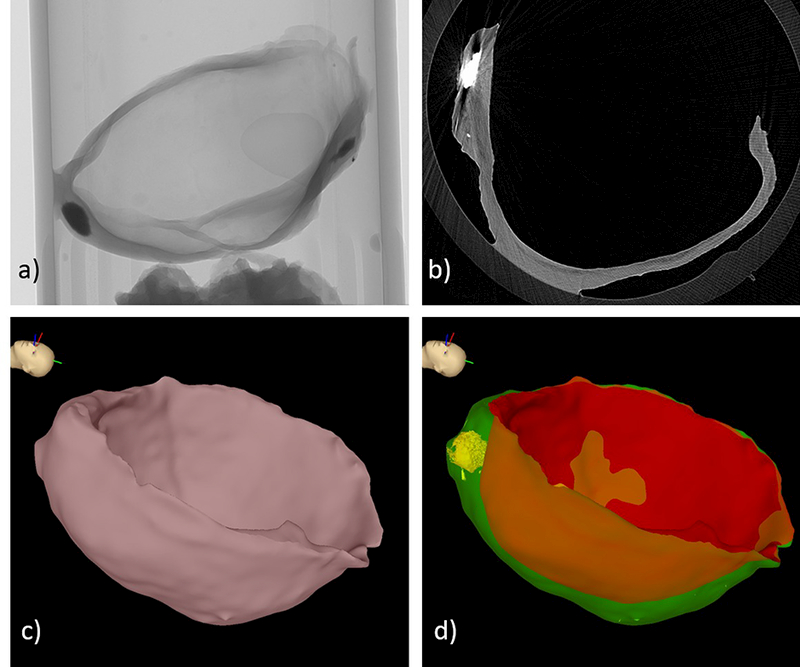
Construction of tissue model: a) micro-CT scan, b) micro-CT image slice, c) surface reconstruction of entire sample, d) inner (red) and outer (green) tissue surfaces, and calcification (yellow).
Vascular and Tissue Alignment
The 3D tissue models (reconstructed from the ex-vivo micro-CT images) are aligned to the corresponding 3D vascular models (reconstructed from the pre-operative 3D anatomical images) using a newly developed tool called CheAlignSurf (Figure 3). The user loads the two surface models, which are rendered together with user specified transparencies and colors. Then, the user interactively rotates and translates the tissue model using graphical widgets such as a trackball sphere and translation cross-hairs, to align it to the vascular model (Figure 3a). These widgets are fairly intuitive to use. The alignment is guided by the following aids: 1) the shape of the aneurysm and tissue sample, which are made to coincide visually, 2) ink markings made with a surgical pen before resection, which are then virtually marked on the vascular and tissue models using a previously developed tool (ChePen3D) [16], and 3) images of the aneurysm either from the pre-operative anatomical imaging or frames of surgical videos. In the latter case, an image is loaded and rendered with transparency along with the 3D vascular and tissue models. The models are oriented to coincide with the images and then the tissue model is aligned to the vascular model using features observed in the images for guidance (Figure 3b).
Figure 3:
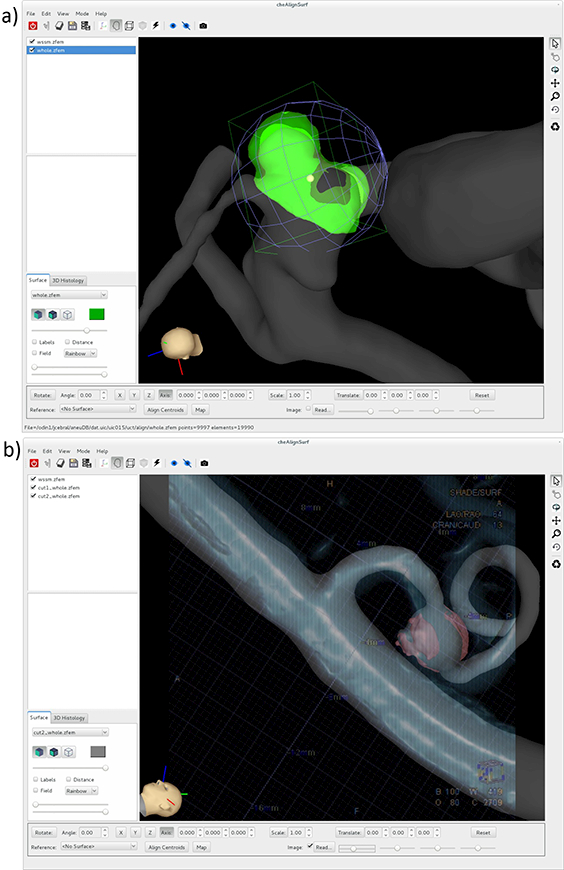
Alignment of tissue model to vascular model: a) interactively matching surface features and landmarks, b) matching surface features guided by 2D angiography image.
Once the tissue model is aligned to the vascular model, flow and intramural stress fields computed using CFD or CSM for the vascular surface are interpolated to the tissue surface model. The surface-to-surface interpolation algorithm first finds for each point of the tissue surface, the closest element of the vascular model. This “host” element is found efficiently using a bin data structure to store the elements of the vascular model. The host element is always found by an exhaustive search, and the element with the closest distance is kept as the host. Once the host element is found, the fields are interpolated to the tissue point using the shape functions of the host element evaluated at the position of the tissue point projected to the plane of the element. Thus, hemodynamic and stress fields are obtained on the tissue surface, which can then be directly compared with local tissue properties defined on the tissue model.
Identifying Aneurysm Wall Regions
During surgical interventions, when the aneurysm is exposed, regions of the aneurysm wall with different visual appearances can be observed. These different appearances are thought to be indicative of local changes in the wall structure. For example, red regions correspond to thin translucent walls, while yellow and white regions are believed to correspond to “atherosclerotic” and “hyperplastic” remodeling regions, respectively [25,26]. For comparison with local flow conditions and local biomechanical stresses, these regions of the wall are identified in intra-operative videos. In particular, the 3D vascular model reconstructed from the pre-operative images is interactively marked using ChePen3D. Using this tool, the 3D vascular model is rotated to the same orientation of the surgical view, and the different regions are labeled (painted) with different colors. Furthermore, the tool was extended from [16] to read static frames of the surgical video that are then made semi-transparent and superposed to the 3D model. Once the 3D model is aligned with the semi-transparent surgical view, the different wall regions of the sample can be directly painted on the 3D model using the video frame for guidance. While this approach makes the region labeling process less subjective, not all regions of the aneurysm walls are exposed at the same time in the same frame. Therefore, usually several frames or video segments are used to identify all visible aneurysm regions, which can be a tedious process.
A similar approach can be used to identify and label regions of the resected tissue sample with different visual appearances. In this case, the 3D tissue model reconstructed from the ex-vivo micro-CT images is labeled using ex-vivo photos of the tissue sample for guidance.
Measuring Wall Thickness
Local wall thickness can be computed as a distance map between the inner and outer surfaces of the tissue model reconstructed from the micro-CT images [16]. However, this approach can fail when the inner and outer surfaces are not exactly parallel, which often happens when the inner and outer surfaces have different local curvature. To address this problem, a new approach was developed. The distance from a point to a surface is calculated by finding the “host” element on the surface, i.e. the element for which all three shape functions evaluated at the point coordinates are between 0 and 1: , for =1,2,3, where are the shape functions, and is the point position on the element plane (Figure 4a). The algorithm proceeds as follows. First, the distance vectors from the inner surface points to the outer surface elements are calculated (Figure 4b, red arrows). Then, the distance vectors from the outer surface points to the inner surface elements are computed (green arrows). Using these vectors, new “medial points” are introduced half way to these distance vectors (red and green dots). Next, the distance vectors from these medial points to the inner and outer surfaces are calculated (Figure 4c). The wall thickness at the medial points is approximated as the sum of the length of the distance vectors to the inner and outer surfaces. The wall thickness field defined on the medial points is then projected to the corresponding host elements of the inner and outer surfaces. Thus, thickness fields are obtained on both the inner and outer surfaces. If these surfaces are roughly parallel, the vectors from the medial points to each surface are aligned and the method coincides with a simple distance map between the two surfaces. Two examples of wall thickness calculations are presented in Figure 5.
Figure 4:

Computing wall thickness and quantifying calcification: a) finding the “host” element of a point for point-to-surface distance calculation, b) extruding “medial” points from inner and outer surfaces, c) calculating the distance from “medial” points to inner and outer surfaces and thickness calculation, d) identifying wall layers containing calcifications, e) projecting calcifications to tissue surfaces for quantification.
Figure 5:
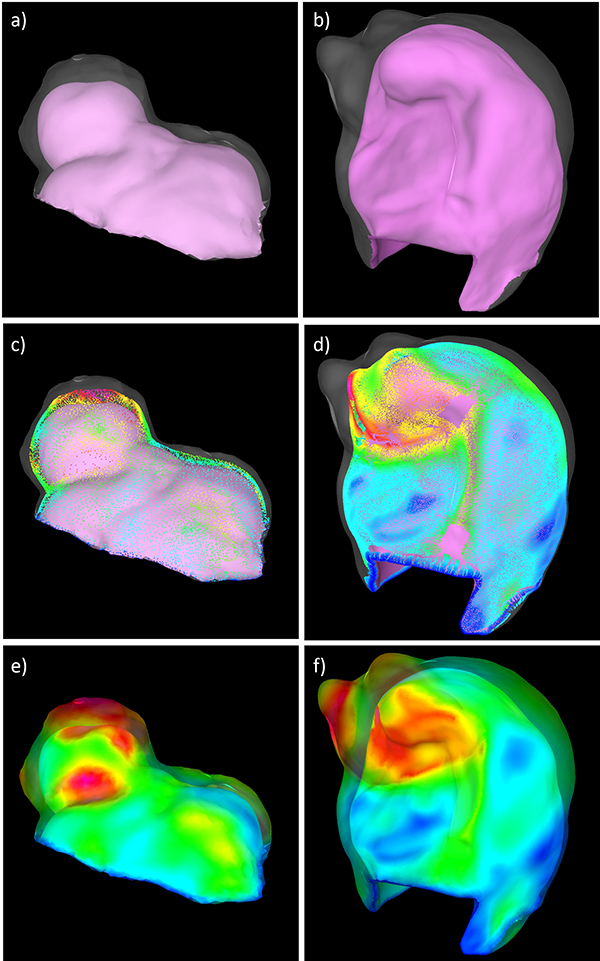
Computing wall thickness from micro-CT reconstructions in two aneurysm tissue samples (left and right columns): a,b) inner and (transparent) outer surfaces of tissue model, c,d) medial points introduced half-way along surface-to-surface distance vectors, and e,f) wall thickness projected to inner and (transparent) outer tissue surfaces.
Characterizing Calcifications
In addition to the inner and outer surfaces of the tissue sample, calcifications are also reconstructed from the high resolution micro-CT scans (see Figure 2). In these images, calcifications appear as high intensity spots of varying sizes within the aneurysm wall. Similarly to the tissue surfaces, calcifications are reconstructed with thresholding and iso-surface extraction. The distribution of calcifications across the thickness of the aneurysm wall is then characterized as follows. For each point of the calcification reconstruction the distance vector to the inner (red arrows in Figure 4d) and outer (green arrows) surfaces are found. As before, the wall thickness at each calcification point is approximated as the sum of the length of these two vectors:
where is the thickess, is the vector from the calcification point to the inner surface, and is the distance to the outer surface. The location of the calcification point across the thickness is defined as:
which takes the value 0 at the inner surface and 1 at the outer surface. The calcification point is then assigned to the inner (closest to luminal side), middle, or outer (closest to abluminal side) layer of the wall:
The elements of the inner and outer surfaces receiving distance vectors from the calcification points (i.e. “host” elements) are marked (Figure 4d) and connected components of marked elements are identified and labeled. In this manner, the “shadows” or projections of the calcifications on each surface are identified and used to quantify the size of the calcification (e.g. the projected area), the density of calcifications (number of independent components per unit area), the wall thickness at the location of the calcifications (average thickness on each independent component), and the location of calcifications across the thickness (layers). The process is illustrated in Figure 4c, and an example is shown in Figure 6.
Figure 6:
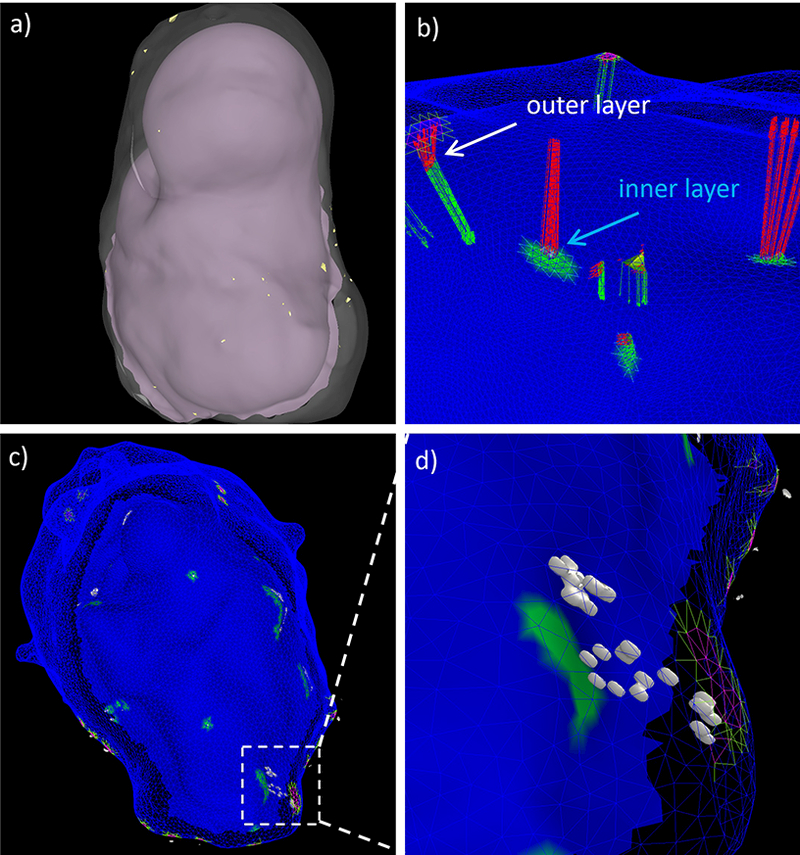
Projecting micro calcifications: a) inner and outer surfaces of tissue sample with micro-calcifications (small yellow dots), b) distance from calcifications to inner (green arrows) and outer (red arrows) surfaces, c) projection of calcifications to wall layers, and d) detail of projected calcifications (white surfaces) in a small region of the wall.
Characterizing Extra-Cellular Matrix
The collagen fiber architecture of the tissue sample is imaged ex-vivo with MPM as previously described [16]. These images cover square regions of 500μm x 500μm with an in-plane resolution of 0.497μm and a 2μm separation between layers through the wall thickness.
Images in the MPM stacks corresponding to different depths through the wall have in general different intensities. Thus, a tool (called CheStackView) was developed that allows adjustment of the brightness of images at different depths following a user defined function. Furthermore, series of N (user specified) consecutive images can be blended together using either a maximum intensity projection (MIP) or a volume rendering blending function. The user can then interactively browse through the stack of blended images to visualize the trajectory of collagen fibers in 3D and can save such stacks for further processing and fiber characterization. The CheStackView tool is shown along with MIP and volume rendered images of two collagen fiber image stacks in Figure 7.
Figure 7:
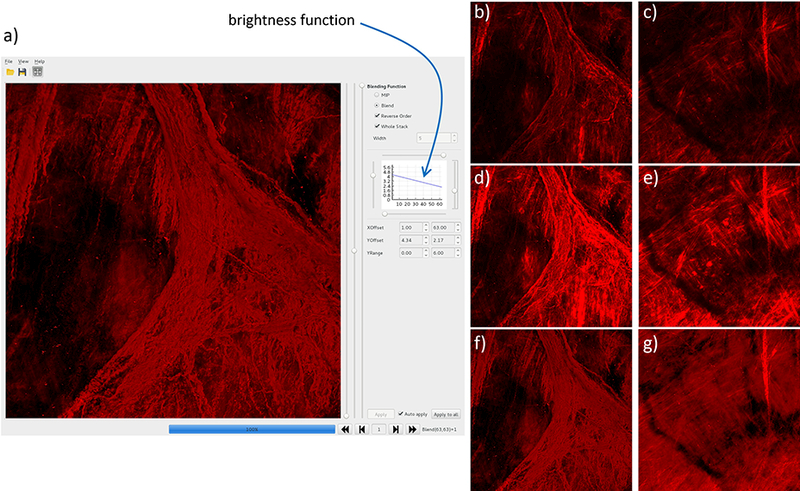
Visualization of collagen fibers with user defined brightness function: a) cheStackView tool, b,c) MIP of two stacks with uniform brightness, d,e) MIP with depth-dependent brightness, and e,f) volume rendered stacks with depth-dependent brightness.
The mapping of MPM image stacks onto the tissue model reconstructed from the micro-CT images proceeds as follows. To define the location of the MPM images, as noted above, small ink markings are made on the tissue sample prior to MPM imaging. The MPM images then are acquired at specific distances from these ink markings, which are visible under the microscope. Furthermore, series of MPM stacks at adjacent locations are combined into mosaics or montages covering larger regions of the tissue sample, thus allowing visualization of collagen fibers extending across different stacks. As mentioned above, the beads glued on the tissue samples are used as reference points to identify the regions corresponding to the MPM images, which are then marked on the tissue model using ChePen3D. A rectangular model representing the montage of MPM images is then created, oriented according to the MPM view, and aligned on the tissue model markings using CheAlignSurf. The MPM images are then projected along the microscope line of sight to the tissue model and texture mapped to the tissue surface for visualization of local collagen fiber architecture.
As in our previous work [16], collagen fiber distributions in each MPM image region can be characterized by computing histograms of fiber direction as well as fiber diameters [27]. Briefly, dominant fiber orientations in small sub-windows of the MPM stacks are determined from the image intensity gradient computed after applying an edge detection filter. Histograms across the scan depth are combined to create colormaps (i.e. fields) of fiber orientations as a function to the distance from the imaging surface [16].
Results
The framework described before is illustrated with data from three cases from our collaborating neurosurgical centers.
Aneurysm 1
The first aneurysm was located on the right M1 segment of the middle cerebral artery (MCA) of a 66 year old female patient. The aneurysm was ruptured and during surgery bleeding was noted at the aneurysm neck. After clipping the aneurysm, the dome was resected, and the tissue sample was subsequently photographed and imaged ex-vivo with micro-CT. The pre-operative 3DRA image and the reconstructed vascular model are shown in Figure 8 (a and b, respectively) along with the tissue model reconstructed from the ex-vivo micro-CT (c). The tissue model aligned to the vascular model are shown in Figure 8d. In this case, the sample contained a small bump that was used to align the tissue to the vascular model.
Figure 8:

Image-based modeling of aneurysm 1: a) pre-operative 3DRA image, b) vascular model constructed from 3DRA, c) tissue model constructed from ex-vivo micro-CT image of resected sample, d) tissue model (yellow) aligned to vascular model (red).
Visual inspection of the resected sample revealed a yellow region of the aneurysm wall, believed to be an “atherosclerotic” region, that also looks like a small secondary bleb. This region was delineated on the tissue model using the ex-vivo photos for guidance, as shown in Figure 9(a,b,c).
Figure 9:
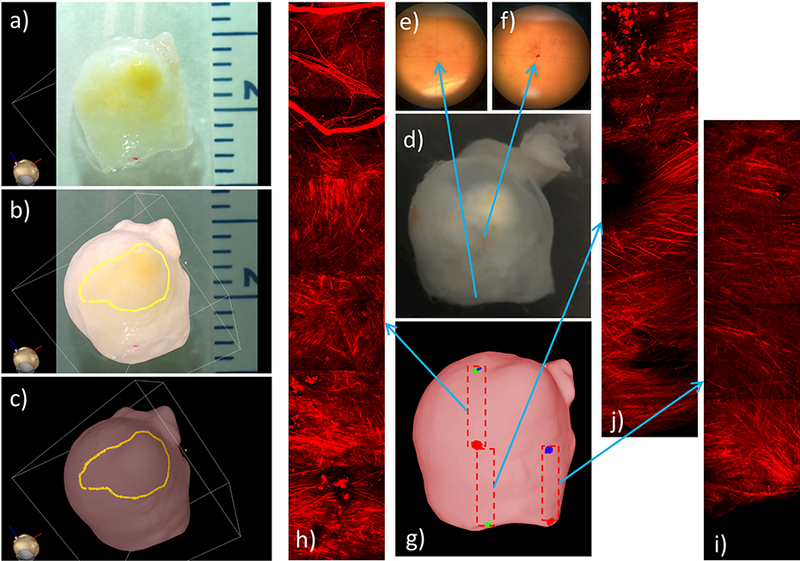
Identifying and marking aneurysm 1 wall regions from ex-vivo photograph of resected sample, and MPM imaging of tissue sample: a) photograph of resected sample, b) superposed photograph and 3D tissue model for image-based marking, c) “atherosclerotic” region marked on tissue model, d) image of resected tissue sample with ink markings visible under microscopy (e,f) used as reference points to document the location of MPM images, g) marking regions of MPM images on tissue model, h-j) mosaics of MPM image stacks corresponding to the regions marked on tissue model.
The small ink marks that were made on the aneurysm surface for mapping purposes (Figure 9d) are visible under the microscope as shown in Figure 9(e,f), and were used as references to specify the locations of the subsequent MPM image acquisitions. The montages of MPM images were then assembled from sets of slightly overlapped 500×500 μm MPM stacks (Figure 9h-j), and their locations were marked on the tissue model, as shown in Figure 9g.
Results illustrating the integration of data from the 3DRA image-based CFD model, the micro-CT-based tissue model, and the MPM imaging are presented in Figure 10. Panel a) shows that the “atherosclerotic” region visually observed in the ex-vivo photos of the resected sample coincides with a thick region of the wall. Panel b) shows that the “atherosclerotic” region is located in a region of flow recirculation away from the flow impingement point. Panel c) corroborates this observation by visualizing the location of flow impingement as a region of increased dynamic pressure. Panel d) shows that the region of elevated WSS associated to the inflow jet is associated with a thin region of the wall (also see the thin blue region in panel a). Panel e) shows collagen fibers in three regions with different levels of WSS. In the bottom sub-panel (high WSS), the collagen fibers are highly organized with orientation roughly perpendicularly to the WSS vectors. In the upper sub-panel (moderate WSS), collagen fibers with distributed orientations and dimensions are observed in a region near the flow impingement point. Finally, in the middle sub-panel (low WSS), gaps and disorganization of collagen fibers are observed in a region where the WSS vectors diverge (change directions in two orthogonal directions).
Figure 10:
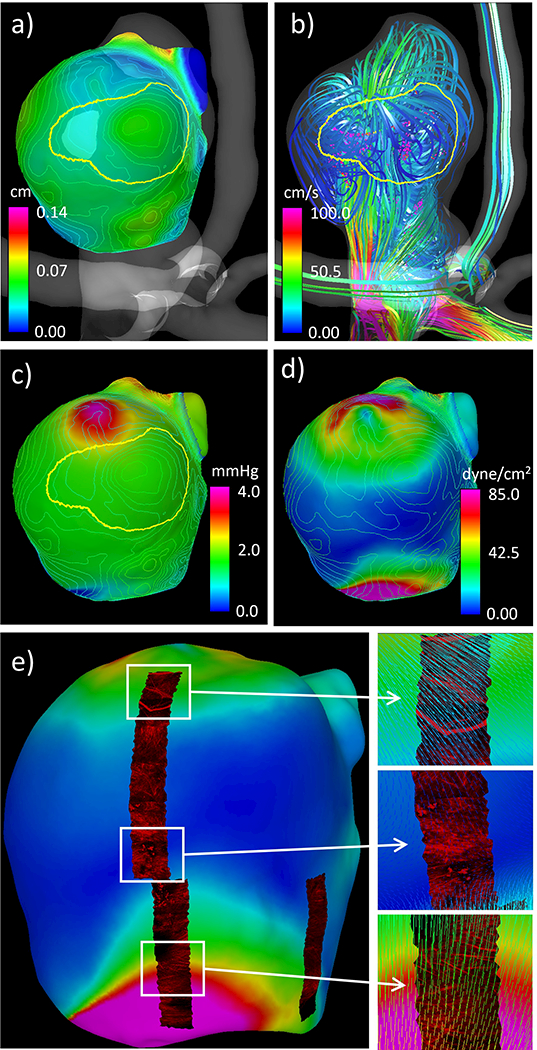
Simultaneous visualization of hemodynamic and wall characteristics of aneurysm 1: a) wall thickness contour lines and “atherosclerotic” region, b) flow pattern and “atherosclerotic” region, c) dynamic pressure (colored surface), “atherosclerotic” region, and wall thickness contour lines, d) wall shear stress (colored surface) and wall thickness contour lines, e) wall shear stress (colored surface) and texture mapped MPM images showing collagen fibers, and corresponding details with superposed WSS vectors.
Aneurysm 2
The second case was an incidental left posterior communicating artery (PCOM) aneurysm in a 66 year old female. The pre-operative 3DRA image, the corresponding vascular model, and the micro-CT-based tissue model aligned to the vascular model are shown in Figure 11. The tissue sample contained a bleb (local bulge in the aneurysm wall) that was used to align the tissue to the vascular model.
Figure 11:
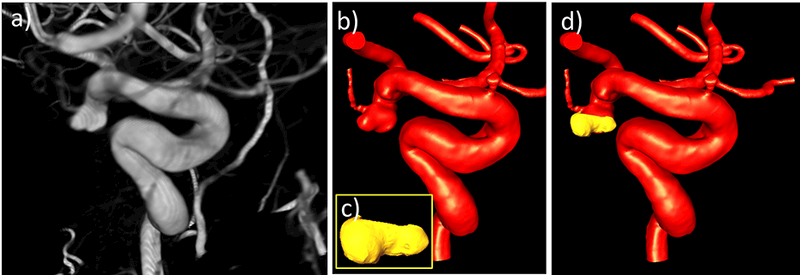
Image-based modeling of aneurysm 2: a) pre-operative 3DRA image, b) vascular model constructed from 3DRA, c) tissue model constructed from ex-vivo micro-CT image of resected sample, d) tissue model (yellow) aligned to vascular model (red).
In this case, thin red regions and “hyperplastic” white regions were observed on the aneurysm surface in the intra-operative video. Selected frames of this video when the aneurysm is exposed prior to clipping were used to guide the labeling of these regions on the vascular model, as illustrated in Figure 12(a,b,c).
Figure 12:
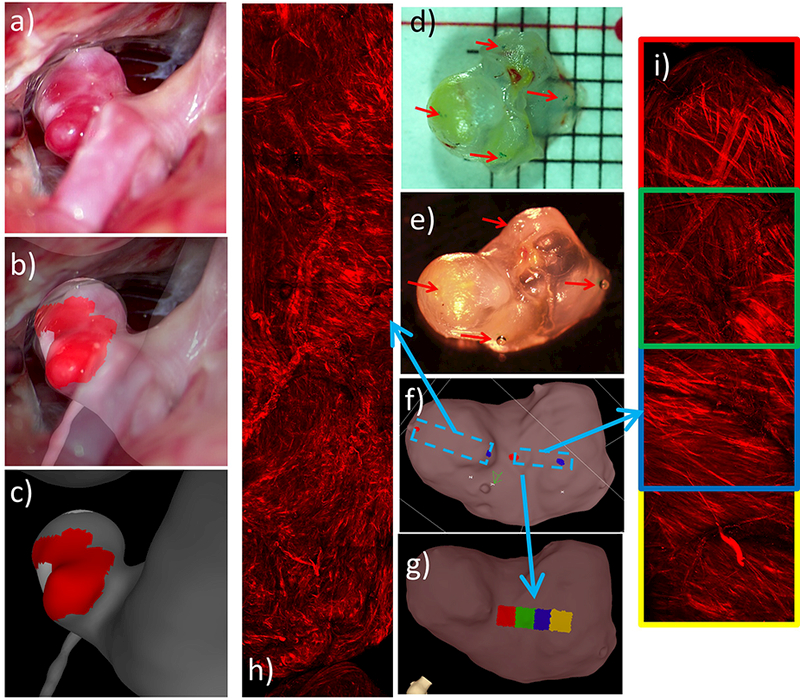
Identifying and marking aneurysm 2 wall regions from operative video, and MPM imaging of tissue sample: a) operative video frame showing exposed aneurysm, b) superposed video frame and 3D vascular model for image-based marking, c) “hyperplastic” (white) and thin (red) regions marked on vascular model using ChePen3D using mapping in (b), d) dissection scope image of resected sample with ink markings applied, e) tissue sample with beads glued on ink markings for micro-CT imaging, f) tissue model marked with MPM imaging regions, g) MPM image labels projected onto tissue model, h-i) mosaics of MPM image stacks.
As in the previous example, ink marks were made on the resected sample (Figure 12d) and used as references to localize the MPM image acquisitions. Beads were glued on top of these marks (Figure 12e), which were subsequently visible in the micro-CT reconstruction of the tissue sample (Figure 12f), and used to position montages formed from overlapping MPM stacks (Figure 12f,h,i). In each montage, labels were generated corresponding to each of the 500×500 μm MPM image stack. These labels were then projected onto the tissue model surface as shown in (Figure 12g).
Results showing flow and wall characteristics are presented in Figure 13. Panel a) shows that the bleb coincided with a “hyperplastic” region (large white contour labeled 1) with thick walls. A second “hyperplastic” region (smaller white contour labeled 2) coincided with a region of thick walls but also extended towards a region with very thin and translucent walls. The red region in this sample (red arrow) had thinner walls than the “hyperplastic” regions. Panel b) shows that the “hyperplastic” regions co-localized with low WSS, while the red region occurred in a zone with moderate WSS. Panel c) shows that the “hyperplastic” regions were located in regions of slow recirculating flow, while the red region was aligned with the main flow stream from the aneurysm inflow. Panel d) shows the mapping of MPM images onto the tissue model colored with the WSS magnitude. Panel e) shows collagen fibers oriented in multiple directions at the dome of the aneurysm with low WSS vectors. In panel f) collagen fibers tend to be bi-directionally oriented with the bisection line roughly orthogonal to the WSS vectors in a region of moderate WSS.
Figure 13:
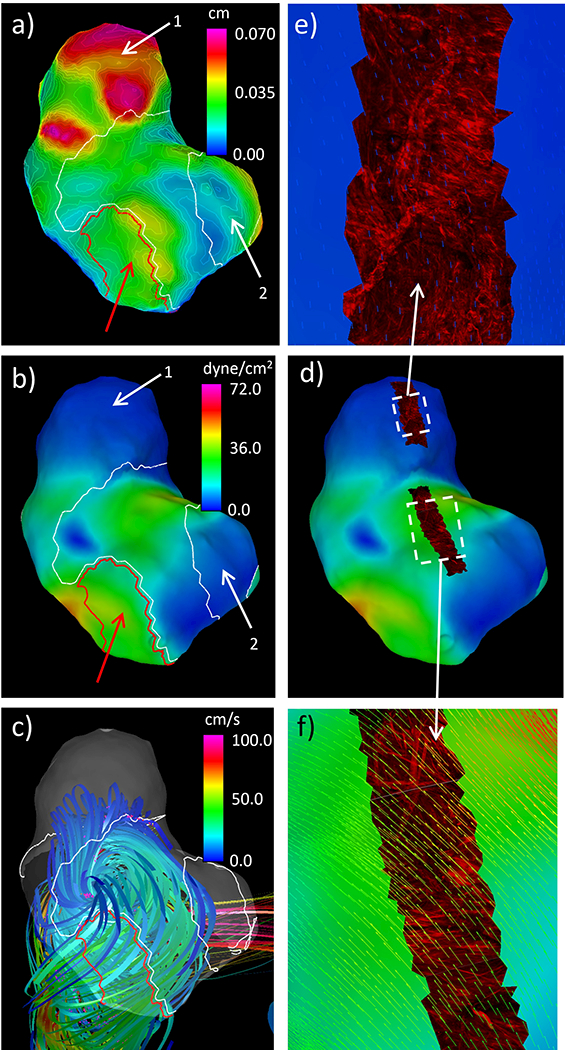
Simultaneous visualization of hemodynamic and wall characteristics of aneurysm 2: a) wall thickness contours and “hyperplastic” (white) and thin (red) regions (white and red arrows), b) WSS and “hyperplastic” and thin regions (white and red arrows), c) flow pattern and “hyperplastic” and thin regions, d) WSS and textured mapped MPM image stacks, e-f) details of MPM images showing collagen fibers superposed with WSS vectors.
Aneurysm 3
The third case was a fusiform aneurysm in the right posterior inferior cerebellar artery (PICA) of a 57 year old male patient. The aneurysm ruptured two weeks prior to the surgery. This aneurysm was treated with bypass surgery and the entire aneurysm was resected. A volume rendering of a pre-operative CTA image is shown in Figure 14a. The reconstructed vascular model superposed with the CTA image is shown in Figure 14b. The micro-CT-based tissue model is shown in Figure 14c. Frames from the intra-operative video were used to help orient and align the tissue model on the vascular model, as shown in Figure 14(d,e).
Figure 14:
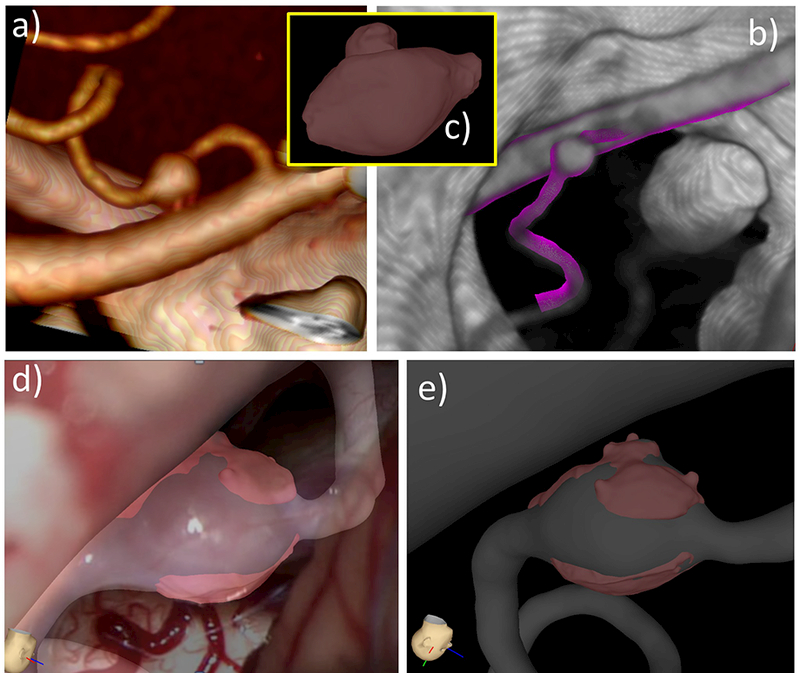
Image-based modeling of aneurysm 3: a) volume rendering of pre-operative CTA image, b) reconstructed vascular model superposed with CTA image, c) tissue model constructed from ex-vivo micro-CT image of resected sample, d) tissue model aligned with vascular model using operative video frame for guidance, e) tissue model aligned to vascular model.
In this case, a red (thin) region of the aneurysm wall was observed in the operative video, and marked on the vascular model, as shown in Figure 15(a,b,c). In order to be able to image the luminal side of the aneurysm, the sample (Figure 15d) was cut in two halves (Figure 15e). MPM images were then acquired from the luminal and abluminal sides of the two half samples. Figure 15f shows MPM imaging of the bottom half from the luminal side, displaying elastic fibers in green (two photon emission signal from MPM). Interestingly, a tear in the elastic fibers (white arrow) can be observed on the right side of these MPM images. Figure 15(g and h) show MPM imaging of collagen fibers from the abluminal side of the bottom and top halves, respectively.
Figure 15:
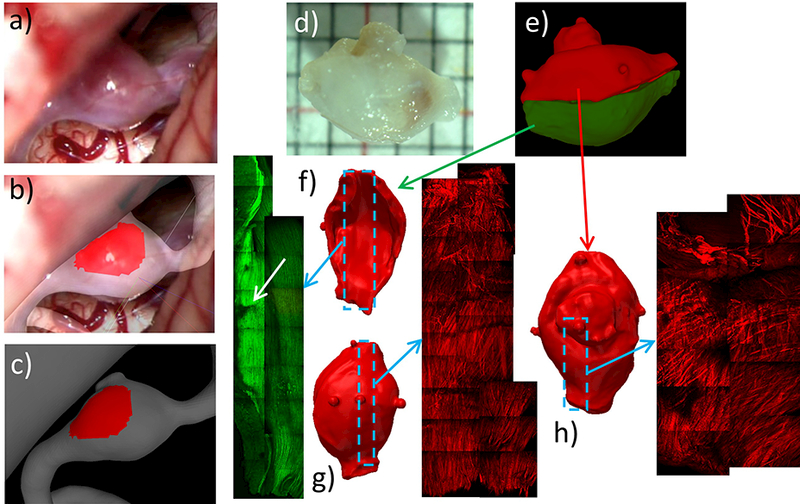
Identifying and marking aneurysm 3 wall regions from operative video, and MPM imaging of tissue sample: a) operative video frame showing exposed aneurysm, b) superposed video frame and 3D vascular model for image-based marking, c) thin (red) region marked on vascular model, d) photograph of resected sample, e) cutting of tissue sample and alignment of corresponding half tissue models, f-h) MPM imaging of luminal (f) and abluminal (g) side of bottom half of sample, and abluminal side of upper half (h).
Results comparing hemodynamic and wall characteristics are presented in Figure 16. Panels a) to d) show the bottom half of the tissue sample from the luminal side, panel e) from the abluminal side, and panels f) to i) the upper half from the abluminal side. Panels a) to d) show that the tear (white arrows) in the elastic fibers occurs in a region of low recirculating flow, with low WSS and elevated relative residence time (RRT), and co-localizes with a valley in the wall thickness distribution (i.e. a thin region adjacent to thicker regions). Panel e) shows that the collagen fibers are oriented axially in this fusiform wall (in contrast with medial collagen fibers in healthy arteries which are oriented circumferentially) and perpendicularly to the flow direction, which in this recirculation zone is in the circumferential direction. Panel f) also shows that collagen fibers are oriented perpendicularly to the recirculating flow in the body of the aneurysm but are disorganized and disrupted in the neck region of the bleb considered here. Panels g) and h) show that the bleb (white contour) has thicker walls and is under low WSS. Finally, panel i) shows that the thin red region coincides with the flow impingement region and is subject to high WSS.
Figure 16:
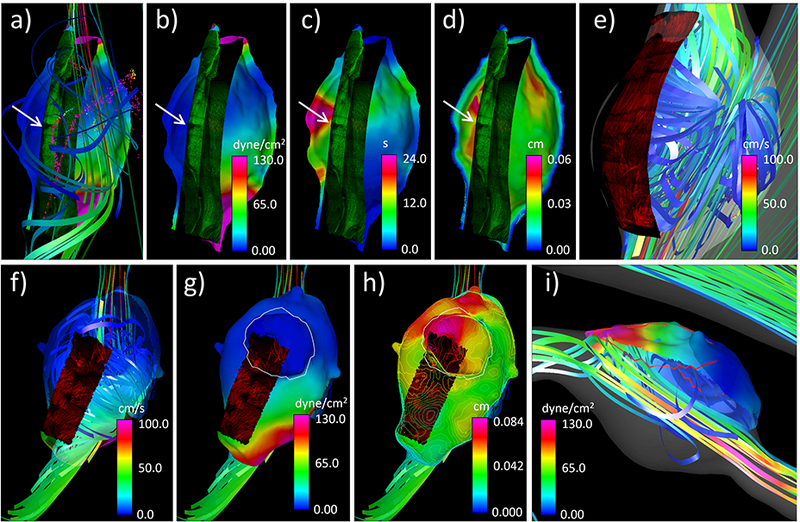
Simultaneous visualization of hemodynamic and wall characteristics of aneurysm 3: a) WSS, flow pattern and luminal MPM showing elastin fibers, b) WSS and luminal MPM, c) RRT and luminal MPM, d) wall thickness and luminal MPM, e) abluminal MPM of bottom half tissue and flow pattern, f) abluminal MPM of upper half tissue and flow pattern, g) WSS, bleb region (white contour), and abluminal MPM on upper half tissue, h) wall thickness contours, abluminal MPM and bleb region, i) thin region (red contour line), flow pattern and WSS on upper half tissue.
Discussion
Detailed understanding of the mechanisms responsible for aneurysm wall degradation and weakening requires integrating biological, biomechanical, hemodynamic, and structural data locally to connect different processes (e.g. inflammation, thrombosis, wall remodeling, flow conditions, etc.) and understand their interactions. However, this is a challenging problem, not only because of the difficulties of obtaining several measurements/imaging/tissue samples on the same patient, but also because local data is defined on different surfaces and reference frames (e.g. 3D vascular model constructed from pre-operative 3D images, vs. surface of tissue sample resected during surgery). In this article we described a number of tools and techniques developed to help combine data from multiple sources, including image-based in silico models, intra-operative videos, and ex-vivo imaging of tissue samples. The methods and tools presented here build upon and extend previous work [16]. Central to the process is the construction of a tissue model from ex-vivo micro-CT images that is aligned to the vascular model constructed from pre-operative 3D images. This tissue model serves as a reference for mapping information from different sources. This mapping to a common reference then allows quantitative comparison of data from diverse sources enabling exploration of the interplay of multiple factors thought to be important drivers of aneurysm evolution. Furthermore, it is difficult to obtain data on a single aneurysm (or a specific aneurysm region) from many different sources. For instance in some cases operative videos may be available but tissue may not have been harvested, or in some other cases the tissue harvested may not be large enough to include features visible in operative videos, or perhaps the harvested tissue portion is not entirely visible in the operative video. Therefore, it is essential to have ways of combining data in order to characterize and understand the different features of the aneurysm wall visible under different modalities.
Some of the procedures, specifically model alignment and virtual marking, are interactive and thus subjective. Although automatic surface-to-surface alignment algorithms are available [28], they tend to fail in our case because the shape of the vascular models and the resected tissue samples do not exactly match, and the tissue samples are usually a small portion of the aneurysm sac, thus requiring subjective judgement to identify features or marks on both surfaces that could be used for alignment. Because these procedures are subjective, we developed intuitive interactive tools that incorporate several aids to guide these processes, including image-guidance (e.g. intra-operative video frames, ex-vivo photos of the tissue samples), protocols for adding surface identifiers (e.g. ink markings for MPM imaging, beads for micro-CT imaging), and simultaneous visualization of superposed models to align visible landmarks or surface features. The level of difficulty of the alignment process depends on the case. In some cases, when the aneurysm surface is irregular with easily identifiable features and the resected sample is large containing some of these features, the process is fairly straightforward by simply aligning these features. In other cases, with smaller samples or aneurysms with fewer identifiable features the process is more problematic. In larger series, some cases may be difficult to align and may have to be discarded. Additionally, new techniques were developed to quantify several characteristics of the aneurysm wall in an automatic and objective manner, such as calcifications, wall thickness, collagen fiber distributions, etc.
Despite several limitations, the proposed approach enables for the first time integration of a multiplicity of data to study the interactions between the different factors that drive the progressive degradation of the aneurysm wall. In the current study, this approach was applied to three aneurysms, allowing us to make some interesting observations. For instance, in these cases “atherosclerotic” and “hyperplastic” looking regions of the aneurysm corresponded to thicker wall regions and tend to occur in regions of low recirculating flow and low WSS; red thin regions were associated with the inflow jet and its impingement point and corresponding region of high WSS; in recirculation zones, the collagen fibers, as imaged from the abluminal side, can be bi-directional and aligned roughly perpendicularly to the flow direction, while in regions of low WSS they tend to display a wide range of orientations; blebs can have walls of varying structure, including calcified, thin or “hyperplastic” walls. It is important to note that collagen fiber orientation may be influenced by hemodynamics but, in regions where effective remodeling is possible, also by wall strain with fibers tending to align in directions that reinforce the wall. Future studies will apply these methods to a larger data set of cerebral aneurysms, enabling an in depth investigation of the interactions between the hemodynamics, wall biomechanics, and wall structure.
Conclusions
An approach was developed for effectively integrating heterogeneous data for cerebral aneurysms that centered on mapping data from multiple sources to a 3D geometric model constructed from micro-CT images of the resected aneurysm tissue that was also aligned to a corresponding vascular model constructed from pre-operative 3D images. While the approach, tools and techniques were illustrated with data from human aneurysms they can be used for other cases with a similar array of data sources. The approach described here enables the study of the interaction of multiple factors thought to be responsible for the progressive degradation and weakening of the aneurysm wall during its evolution.
Acknowledgements
This work was supported by NIH grant #R01NS097457, and Kuopio University Hospital and Helsinki University Hospital research funds, and by a research grant from the Finnish Medical Foundation.
References
- 1.Greving JP, Wermer MJ, Brown RD, et al. Development of the PHASES score for prediction of risk of rupture of intracranial aneurysms: a pooled analysis of six prospective cohort studies. Lancet Neurol 2014; 13:59–66. doi: 10.1016/s1474-4422(13)70263-1. [DOI] [PubMed] [Google Scholar]
- 2.Xiang J, Natarajan SK, Tremmel M, et al. Hemodynamic-morphologic discriminants for intracranial aneurysm rupture. Stroke 2011; 42:144–152. [DOI] [PMC free article] [PubMed] [Google Scholar]
- 3.Cebral JR, Mut F, Weir J, Putman CM. Association of hemodynamic characteristics and cerebral aneurysm rupture. AJNR American Journal of Neuroradiology 2011; 32:264–270. doi:DOI 10.3174/ajnr.A2274. [DOI] [PMC free article] [PubMed] [Google Scholar]
- 4.Robertson AM, Duan X, Hill MR, Aziz K, Cebral JR. Diversity in the strength and structure of unruptured cerebral aneurysms. Ann Biomed Eng 2014; 43:1502–1515. [DOI] [PMC free article] [PubMed] [Google Scholar]
- 5.Kadasi LM, Dent WC, Malek AM. Colocalization of thin-walled dome regions with low hemodynamic wall shear stress in unruptured cerebral aneurysms. Journal of Neurosurgery 2013; 119(1):172–179. doi: 10.3171/2013.2.JNS12968. [DOI] [PubMed] [Google Scholar]
- 6.Suzuki T, Takao H, Suzuki T, et al. Determining the Presence of Thin-Walled Regions at High-Pressure Areas in Unruptured Cerebral Aneurysms by Using Computational Fluid Dynamics. Neurosurgery 2016; 79(4):589–595. doi: 10.1227/NEU.0000000000001232. [DOI] [PubMed] [Google Scholar]
- 7.Tobe Y, Yagi T, Iwabuchi Y, et al. Relationship between Pathology and Hemodynamics of Human Unruptured Cerebral Aneurysms. In: Goh J, ed. The 15th International Conference on Biomedical Engineering Springer International Publishing; 2014:44–47. [Google Scholar]
- 8.Cebral J, Ollikainen E, Chung BJ, et al. Flow conditions in the intracranial aneurysm lumen are associated with inflammation and degenerative changes of the aneurysm wall. AJNR Am J Neuroradiol 2017; 38:119–126. doi: 10.3174/ajnr.A4951. [DOI] [PMC free article] [PubMed] [Google Scholar]
- 9.Cebral JR, Sheridan MJ, Putman CM. Hemodynamics and Bleb Formation in Intracranial Aneurysms. AJNR American Journal of Neuroradiology 2010; 31:304–310. [DOI] [PMC free article] [PubMed] [Google Scholar]
- 10.Sugiyama S-I, Endo H, Omodaka S, et al. Daughter Sac Formation Related to Blood Inflow Jet in an Intracranial Aneurysm. World Neurosurgery 2016; 96:396–402. doi: 10.1016/j.wneu.2016.09.040. [DOI] [PubMed] [Google Scholar]
- 11.Cebral JR, Duan X, Chung BJ, Putman C, Aziz K, Robertson AM. Wall mechanical properties and hemodynamics of unruptured intracranial aneurysms. AJNR Am J Neuroradiol 2015; 36:1695–703. doi: 10.3174/ajnr.A4358. [DOI] [PMC free article] [PubMed] [Google Scholar]
- 12.Sugiyama S, Niizuma K, Nakayama T, et al. Relative residence time prolongation in intracranial aneurysms: a possible association with atherosclerosis. Neurosurgery 2013; 73(5):767–776. doi: 10.1227/NEU.0000000000000096. [DOI] [PubMed] [Google Scholar]
- 13.Omodaka S, Sugiyama S, Inoue T, et al. Local hemodynamics at the rupture point of cerebral aneurysms determined by computational fluid dynamics analysis. Cerebrovasc Dis 2012; 34:121–9. doi: 10.1159/000339678. [DOI] [PubMed] [Google Scholar]
- 14.Cebral JR, Vazquez M, Sforza DM, et al. Analysis of hemodynamics and wall mechanics at sites of cerebral aneurysm rupture. J Neurointerv Surg 2015; 7(7):530–536. doi: 10.1136/neurintsurg-2014-011247. [DOI] [PubMed] [Google Scholar]
- 15.Frosen J Smooth muscle cells and the formation, degeneration, and rupture of saccular intracranial aneurysm wall--a review of current pathophysiological knowledge. Transl Stroke Res 2014; 5:347–56. doi: 10.1007/s12975-014-0340-3. [DOI] [PubMed] [Google Scholar]
- 16.Cebral JR, Duan X, Gade PS, et al. Regional Mapping of Flow and Wall Characteristics of Intracranial Aneurysms. Annals of Biomedical Engineering 2016; doi: 10.1007/s10439-016-1682-7. [DOI] [PMC free article] [PubMed] [Google Scholar]
- 17.Cebral JR, Castro MA, Appanaboyina S, Putman CM, Millan D, Frangi AF. Efficient pipeline for image-based patient-specific analysis of cerebral aneurysm hemodynamics: Technique and sensitivity. IEEE Trans Med Imag 2005; 24:457–467. [DOI] [PubMed] [Google Scholar]
- 18.Mut F, Aubry R, Löhner R, Cebral JR. Fast numerical solutions of patient-specific blood flows in 3D arterial systems. Int J Num Meth Biomed Eng 2010; 26:73–85. doi:DOI 10.1002/cnm.1235. [DOI] [PMC free article] [PubMed] [Google Scholar]
- 19.Taylor CA, Hughes TJR, Zarins CK. Finite element modeling of blood flow in arteries. Comp Meth App Mech Eng 1998; 158:155–196. [Google Scholar]
- 20.Cebral JR, Castro MA, Putman CM, Alperin N. Flow-area relationship in internal carotid and vertebral arteries. Physiol Meas 2008; 29:585–594. [DOI] [PMC free article] [PubMed] [Google Scholar]
- 21.Painter PR, Eden P, Bengtsson HU. Pulsatile blood flow, shear force, energy dissipation and Murray’s Law. Theor Biol Med Model 2006; 3:31. doi: 10.1186/1742-4682-3-31. [DOI] [PMC free article] [PubMed] [Google Scholar]
- 22.Mut F, Löhner R, Chien A, et al. Computational hemodynamics framework for the analysis of cerebral aneurysms. Int J Num Meth Biomed Eng 2011; 27:822–839. [DOI] [PMC free article] [PubMed] [Google Scholar]
- 23.Byrne G, Mut F, Cebral JR. Quantifying the large-scale hemodynamics of intracanial aneurysms. AJNR Am J Neuroradiol 2014; 35:333–338. doi: 10.3174/ajnr.A3678. [DOI] [PMC free article] [PubMed] [Google Scholar]
- 24.Isaksen JG, Bazilevs Y, Kvamsdal T, et al. Determination of Wall Tension in Cerebral Artery Aneurysms by Numerical Simulation. Stroke 2008; 39:3172–3178. [DOI] [PubMed] [Google Scholar]
- 25.Tobe Y Pathological engineering for predicting transition of human cerebral aneurysms In: Doctoral Dissertation. Waseda University, Japan; 2016:1–165. [Google Scholar]
- 26.Furukawa K, Ishida F, Tsuji M, et al. Hemodynamic characteristics of hyperplastic remodeling lesions in cerebral aneurysms. PloS One 2018; 13(1):e0191287. doi: 10.1371/journal.pone.0191287. [DOI] [PMC free article] [PubMed] [Google Scholar]
- 27.Hill MR, Duan X, Gibson GA, Watkins S, Robertson AM. A theoretical and non-destructive experimental approach for direct inclusion of measured collagen orientation and recruitment into mechanical models of the artery wall. Journal of Biomechanics 2012; 45:762–71. doi: 10.1016/j.jbiomech.2011.11.016. [DOI] [PMC free article] [PubMed] [Google Scholar]
- 28.Wang Y, Chiang M-C, Thompson PM. Automated surface matching using mutual information applied to Riemann surface structures. Medical image computing and computer-assisted intervention: International Conference on Medical Image Computing and Computer-Assisted Intervention 2005; 8(Pt 2):666–674. [DOI] [PubMed] [Google Scholar]


