

Abstract
Background:
Detecting recent and rapid spread of HIV can help prioritize prevention and early treatment for those at highest risk of transmission. HIV genetic sequence data can identify transmission clusters, but previous approaches have not distinguished clusters of recent, rapid transmission. We assessed an analytic approach to identify such clusters in the United States.
Methods:
We analyzed 156,553 partial HIV-1 polymerase sequences reported to the National HIV Surveillance System and inferred transmission clusters using two genetic distance thresholds (0.5% and 1.5%) and two time periods for diagnoses (all years and 2013–2015, i.e., recent diagnoses). For rapidly growing clusters (with ≥5 diagnoses during 2015), molecular clock phylogenetic analysis estimated the time to most recent common ancestor for all divergence events within the cluster. Cluster transmission rates were estimated using these phylogenies.
Results:
A distance threshold of 1.5% identified 103 rapidly growing clusters using all diagnoses and 73 using recent diagnoses; at 0.5%, 15 clusters were identified using all diagnoses and 13 using recent diagnoses. Molecular clock analysis estimated that the 13 clusters identified at 0.5% using recent diagnoses had been diversifying for a median of 4.7 years, compared with 6.5–13.2 years using other approaches. The 13 clusters at 0.5% had a transmission rate of 33/100 person-years, compared with previous national estimates of 4/100 person-years.
Conclusions:
Our approach identified clusters with transmission rates 8 times those of previous national estimates. This method can identify groups involved in rapid transmission and help programs effectively direct and prioritize limited public health resources.
Keywords: HIV, transmission, phylogenetic, molecular, epidemiology, cluster
Background
Interventions that prevent transmission of HIV, including pre-exposure prophylaxis, HIV testing, and antiretroviral treatment, have resulted in reduced HIV incidence in recent years.1 However, in the United States, nearly 40,000 people received diagnoses of HIV infection in 2016,2 and more than 1 million persons are at substantial risk for acquiring HIV.3 Although 1.1 million people in the United States are living with HIV infection, 14.5% of whom have undiagnosed infection,4 most HIV-infected persons do not transmit HIV to others. Previous estimates of national transmission rates are approximately four transmissions per 100 HIV-infected person-years.5 With a small number of infected persons involved in transmission, detecting clusters with rapid HIV transmission is critical for focusing efforts on populations in need of the most intensive prevention interventions, where the opportunity for impact in averting onward transmission is greatest.
HIV case surveillance data can identify patterns in diagnosis rates, but, particularly in high burden areas, growing clusters of recent, rapid transmission may not be identifiable amidst large numbers of cases. Partner services staff interview persons with HIV to collect information about their partners, providing information about the extent of sexual and injection networks. However, not all index cases are interviewed, many partners are not named or located,6 and named partners may not represent transmission partners.7,8 However, analysis of HIV-1 genetic sequence data can identify transmission clusters, enabling high-impact prevention efforts for social networks at high risk of HIV infection.9
HIV genetic sequence data are increasingly available in the United States. Drug resistance testing is recommended for all HIV-infected persons immediately after diagnosis and generates HIV-1 polymerase (pol) nucleotide sequence data.10 Analysis of these data can identify persons infected with genetically similar HIV variants, provide information about transmission relationships,11–14 and identify growing clusters that represent active transmission,15–17 allowing public health officials to focus prevention interventions based on these findings.9,18,19
The Centers for Disease Control and Prevention (CDC) has recently expanded efforts to use HIV sequence data to identify growing transmission clusters for the purpose of investigation and response.19 Transmission network analysis can generate thousands of clusters,11 not all of which are of equal public health importance. Some clusters reflect transmission that occurred many years in the past, presenting limited opportunities to prevent future cases. In contrast, identifying clusters of recent, rapid transmission offers the opportunity to interrupt ongoing spread. Prioritizing clusters of highest public health concern is important, particularly given finite resources for HIV prevention.
Many studies using transmission network analysis of HIV-1 pol sequences have included sequences from persons with diagnoses many years in the past. However, as the availability of sequence data in the United States becomes more complete for longer periods of time, it is likely that clusters will continue to grow larger, which may complicate the ability to distinguish clusters with recent and rapid transmission. Moreover, many studies have used a genetic distance threshold of 1.5% (i.e., 0.015 nucleotide substitutions/site) to identify potential HIV-1 transmission links.9,11,13,14 A natural breakpoint has been observed at this genetic distance for named sexual and injection partners.8 However, this threshold may be too permissive, detecting transmission events that occurred many years ago, for which options for public health action are limited. Sequence analysis from an Indiana HIV outbreak demonstrated benefit of a lower genetic distance threshold in an outbreak setting to distinguish recent transmission.20
We assessed whether limiting analysis to recent diagnoses and applying a more conservative distance threshold increased specificity for clusters of recent and rapid transmission. We used phylogenetic methods to infer the time to most recent common ancestor (tMRCA) for clusters and transmission rates, then described the characteristics of persons in clusters determined to represent recent and rapid transmission.
Methods
Data source and data protections
Molecular HIV surveillance is an integrated component of the National HIV Surveillance System. During 2013–2017, 27 surveillance jurisdictions (Figure 1) collected sequences from routinely performed genotypic resistance tests conducted at commercial, private, and public health laboratories (without regard to year of diagnosis) and reported those sequences to CDC along with demographic, geographic, risk, and clinical data collected by HIV surveillance. Deduplication of records for persons reported by more than one jurisdiction are a standard part of surveillance procedures. Twenty-four jurisdictions were funded for sequence collection through a variety of projects during part or all of 2001–2013. HIV surveillance data reported to CDC do not contain name or other personal identifiers and are protected by an assurance of confidentiality; products of analyses are secured with limited access. All data were collected as part of routine HIV surveillance, and ethical review or approval for this study was waived as this work was conducted for public health purposes.
Figure 1.
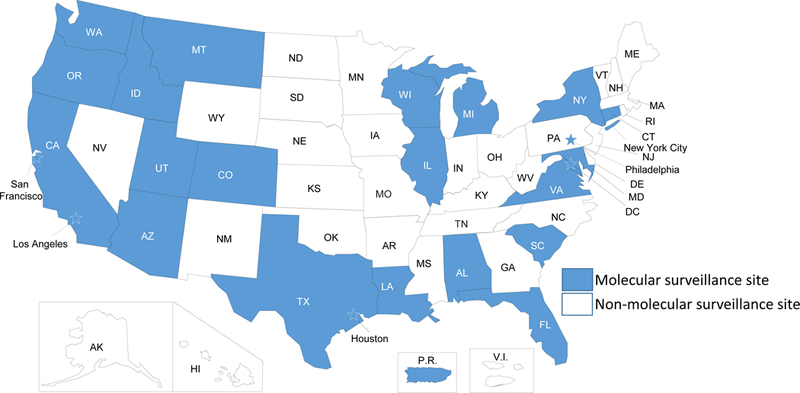
Map of jurisdictions participating in molecular HIV surveillance, 2013–2017. These jurisdictions reported 70% of HIV diagnoses occurring in 2015. Stars indicate cities/counties that are separately funded for HIV surveillance activities.
Data analysis
We analyzed data reported through December 2015. We included partial pol (protease and reverse transcriptase) sequences that were ≥500 nucleotides in length and removed sequences identified as potential contaminants.11,12 If a person had multiple sequences, we selected the earliest; if two sequences had the same specimen collection date, we selected the longest.
Sequences were analyzed using a local installation of HIV-TRACE (HIV TRAnsmission Cluster Engine, www.hivtrace.org) following the protocol previously described.11,12,21 Briefly, we aligned all sequences to a reference HIV-1 pol sequence (HXB2 positions 2253–3659) and calculated the TN93 pairwise distance for each pair of sequences that had a minimum overlap of 500 nucleotides using an ambiguity fraction of 1.5%.21 We did not remove codons associated with antiretroviral drug resistance, given previous analyses showing that doing so did not affect results.11,13 After identifying all clusters (defined as connected network components) at a distance threshold of 1.5%, we selected clusters that included at least 5 persons with HIV infection diagnosed in 2015 (the most recent year), suggesting rapid transmission (Figure 2a). We then used the same sequence dataset to identify clusters at a threshold of 0.5% that included at least 5 persons with HIV infection diagnosed in 2015. Analyses at each threshold were conducted using (i) all sequences regardless of diagnosis date and (ii) sequences for persons with HIV diagnosed during the last three years of the analysis period (2013–2015, i.e., recent diagnoses), resulting in a total of four analytic approaches.
Figure 2.
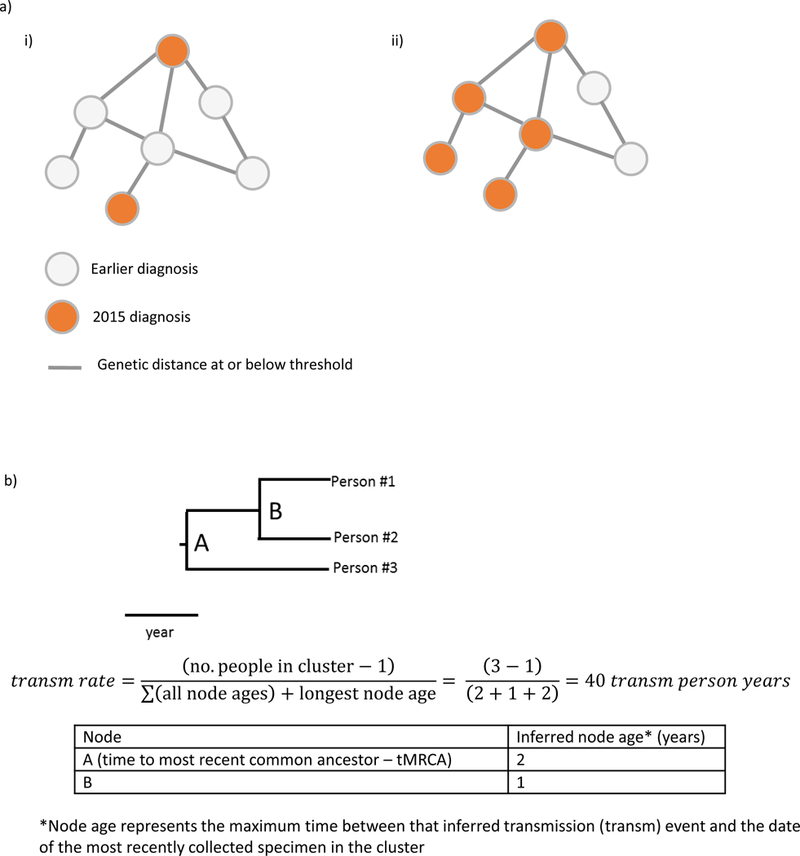
a) Examples of clusters that would not (i) and would (ii) meet criteria for this analysis. Clusters of recent and rapid transmission are defined as those with at least five diagnoses during the last 12 months of the analysis period. b) Example phylogenetic tree and example calculation of transmission rate.
For each of the four approaches, we described the number and size of clusters and the number of persons determined to have recent infection at diagnosis through the use of a cross-sectional incidence assay, either Bio-Rad Avidity (for 2014 and 2015 diagnoses; mean duration of recent infection: 239.6 days) or BED (for earlier diagnoses; mean duration of recent infection: 198.4 days).22
To estimate the tMRCA and ages of internal nodes (used as proxies for ages of the clusters and of transmission events within each cluster, respectively), we conducted Bayesian molecular clock phylogenetic inference using BEAST v.1.8.2,23,24 excluding sequences without known sampling dates. Due to the small size and limited temporal variability in the clusters identified using the 0.5% threshold, we were unable to independently infer a substitution rate for each cluster. Therefore, we estimated an HIV-1 pol sequence median substitution rate of 1.2201 × 10⁻³ substitutions/site/year from 33 clusters characterized in a previous analysis.25 This median substitution rate was used as a fixed narrow prior (normal distribution with a standard deviation = 10−6) on the substitution rate for all subsequent BEAST analyses. For each cluster, two independent BEAST runs were performed under a TN93 substitution model, a strict molecular clock, and Bayesian skyline prior for 10 million generations. Log files from both BEAST runs were combined in LogCombiner (discarding the first million generations as burn-in) and assessed for convergence using TRACER (estimated sample size >200 for all parameters). Longer BEAST runs were needed for convergence for certain clusters due to their size. Using the maximum clade credibility tree, we extracted the median age of each node (Figure 2b), which represents a maximum estimate of the time between the inferred transmission event and December 2015 (the dataset date), and calculated the median and range of node ages across clusters for each of the four approaches. Sequence evolution occurring after a branching point may represent diversification not only in the potential transmitter and the potential recipient after the time of transmission, but also diversification occurring in the potential transmitter prior to the transmission event. Additionally, 95% highest posterior densities (HPDs) were calculated for the tMRCAs of the clusters identified at the 0.5% genetic threshold using recent diagnoses.
To understand the rapidity of transmission in clusters identified using these approaches in comparison with previously published national transmission rates,5 we developed a novel method to calculate HIV transmission rates, or the number of transmissions per 100 HIV-infected persons per year. Transmission rate was estimated as the number of transmission events in the cluster (calculated as the number of persons in the cluster minus 1) divided by the total HIV-infected person-time in the cluster (i.e., the time between the inferred date of infection for each person in the cluster and the end of the period of observation [the dataset date of December 2015], during which these persons could have contributed toward transmission events). For each cluster, the total HIV-infected person-time was calculated as the sum of all node ages inferred from the molecular clock analysis (estimating the time between infection and December 2015 for all but the original person in the cluster) plus the longest node age (to account for the HIV-infected person-time of the original person in the cluster) (Figure 2b).
After identifying which of the four approaches was most specific for distinguishing recent and rapid transmission, we conducted a bivariate analysis to understand the demographic, risk, geographic, and clinical characteristics of persons in these clusters, compared with all other persons with sequences included in this analysis. We accounted for correlations between persons in the same transmission cluster by using the Rao-Scott correction to the Pearson Chi-Square test in SAS; significance was determined at p < 0.05. We defined mutations associated with drug resistance according to the CDC transmitted drug resistance-associated mutation list.26
Finally, we explored the effects of changing the threshold for the number of diagnoses in the past 12 months, comparing characteristics of clusters identified using thresholds of 5, 4, or 3 diagnoses in the past 12 months.
Results
Partial pol sequences were available for 30,323 persons with HIV infection diagnosed during 2013–2015 and 126,230 persons with HIV diagnosed before 2013.
Clusters identified in four approaches
When limited to recent diagnoses (those occurring during 2013–2015), at a distance threshold of 1.5%, 12,661 (41.8%) of 30,323 sequences linked to at least one other sequence. These 12,661 sequences formed 3,413 clusters (size 2–49 persons), of which 73 contained at least 5 diagnoses occurring during 2015. When including diagnoses before 2013, at a distance threshold of 1.5%, 103 clusters contained at least 5 diagnoses occurring during 2015.
A subset of the clusters identified at a distance threshold of 1.5% were also identified at a reduced threshold of 0.5%. When limited to recent diagnoses, 5,509 (18.2%) of 30,323 sequences linked to at least one other sequence at a distance threshold of 0.5%. These 5,509 sequences formed 1,923 clusters (size 2–22 persons), of which 13 clusters contained at least 5 diagnoses occurring during 2015. When including diagnoses before 2013, at a distance threshold of 0.5%, 15 clusters contained at least 5 diagnoses occurring during 2015.
Comparison of results from four approaches
Clusters identified at the 0.5% threshold included fewer people (196 using recent diagnoses and 289 using all diagnoses vs. 1,351 at 1.5% threshold using recent diagnoses and 4,680 at 1.5% threshold using all diagnoses), of whom a higher percentage had recent infection at diagnosis per a cross-sectional incidence assay (63% using recent diagnoses and 66% using all diagnoses vs. 42% at 1.5% threshold using recent diagnoses and 37% at 1.5% threshold using all diagnoses), suggesting infection on average in approximately the past 6–8 months (Table 1).
Table 1.
Comparison of indicators of recent and rapid HIV transmission between growing clusters identified at two genetic distance thresholds and using recent diagnoses (from 2013–2015) vs. all diagnoses.
| Clusters identified at 0.5% threshold with 3 years of diagnoses | Clusters identified at 0.5% threshold with all years of diagnoses | Clusters identified at 1.5% threshold with 3 years of diagnoses | Clusters identified at 1.5% threshold with all years of diagnoses | |
|---|---|---|---|---|
| General characteristics | ||||
| Number of clusters | 13 | 15 | 73 | 103 |
| Cluster size (median, range) | 16 (6–22) | 18 (6–34) | 17 (5–49) | 35 (6–193) |
| Total number of people | 196 | 289 | 1,351 | 4,688 |
| No. (%) people with HIV diagnosed in 2015 | 80 (41%) | 90 (31%) | 465 (34%) | 694 (15%) |
| No. (%) people with recent infection* | 52 (63%) | 95 (66%) | 284 (42%) | 989 (37%) |
| Molecular clock phylogenetic analysis | ||||
| Total no. of sequences** | 195 | 288 | 1,350 | 4,680 |
| Time to most recent common ancestor for cluster (median, range) | 4.7 years (1.8–7.7) | 6.5 years (2.0–9.2) | 9.4 years (2.0–23.0) | 13.3 years (2.4─23.3) |
| Total no. of nodes (transmission events) | 182 | 273 | 1,277 | 4,577 |
| Node age (median, range) | 2.5 years (0.3–7.7) | 3.0 years (0.3–9.2) | 4.6 years (0.3–23.0) | 6.7 years (0.3─23.3) |
| No. (%) of nodes with age < 2 years | 65 (36%) | 73 (27%) | 129 (10%) | 203 (4%) |
| Transmission rate per 100 person-years | 33 | 28 | 18 | 14 |
Clusters had at least 5 diagnoses in the past 12 months.
Excludes persons for whom recency of infection could not be determined (denominator=83 for 0.5% threshold with 3 years of diagnoses; 145 for 0.5% threshold with all years of diagnoses; 674 for 1.5% threshold with 3 years of diagnoses; 2,672 for 1.5% threshold with all years of diagnoses). Recent infection determined through the use of cross-sectional incidence assay, either BED (for 2013 diagnoses; mean duration of recent infection = 198.4 days) or Bio-Rad Avidity (for 2014 and 2015 diagnoses; mean duration of recent infection = 239.6 days).
Excludes persons with a missing sample collection date, which is needed for molecular clock phylogenetic analysis.
Molecular clock analysis determined that the 13 clusters identified at the 0.5% threshold using recent diagnoses had been diversifying for a median of 4.7 years, compared with 6.5 years for clusters identified at 0.5% using all diagnoses, 9.4 years for clusters identified at 1.5% using recent diagnoses, and 13.2 years for clusters identified at 1.5% using all diagnoses (Table 1). Cluster-specific estimates of the median and 95% HPD tMRCA for each of the 13 clusters identified at the 0.5% threshold using recent diagnoses are reported in Supplemental Table 1. The percentage of nodes with a median age less than 2 years was 36% for the 13 clusters identified at the 0.5% threshold using recent diagnoses, compared with 27% for clusters identified at 0.5% using all diagnoses and 10% and 5% for clusters identified at 1.5% using recent diagnoses and all diagnoses, respectively.
Using inferred times of transmission events, the overall transmission rate for the 13 clusters identified at the 0.5% threshold using recent diagnoses was 33 transmissions per 100 person-years. For clusters identified at 0.5% using all diagnoses, the transmission rate was 28 transmissions per 100 person-years. For clusters identified at 1.5% using recent diagnoses and all diagnoses, the transmission rate was 18 and 14 transmission per 100 person-years, respectively.
Epidemiologic characteristics of recent, rapid transmission clusters
The 13 clusters identified at a 0.5% distance threshold (depicted in Supplemental Figure 1) using recent diagnoses had significantly higher percentages of men who have sex with men (MSM) than other persons with recent diagnoses with sequences available (94% vs. 62%, p<0.0001, Table 2) and higher percentages of persons aged <30 years (68% vs. 41%, p<0.0001) and Hispanics/Latinos (49% vs. 28%, p<0.0001). MSM aged <30 years were more prevalent in these 13 clusters, with 124 (63%) of cluster members compared to 9,390 (31%) of others with recent diagnoses in the dataset (p<0.0001); young Hispanic/Latino MSM were particularly prevalent at 63 (32%) persons in the 13 clusters, compared to 2,856 (9%) others in the dataset (p<0.0001). These 13 clusters had a smaller proportion of persons residing in metropolitan areas with populations of 50,000–499,999 (4% vs. 11%, p=0.0002) and a larger proportion with antiretroviral drug resistance (43% vs. 20%, p=0.006). When clusters were grouped by primary state (defined by residence at diagnosis for >50% of persons in the cluster), the 13 clusters were located in 7 different states in three U.S. census regions (Northeast, South, and West); in one cluster, no single state had >50% of persons. Of the 13 clusters, 10 included persons from more than one state. Six clusters had at least one sequence with identified drug resistance mutations. For 5 clusters, >90% of the sequences in the cluster contained the same major drug resistance-associated mutations (K103N for 2 clusters, K103S for 1 cluster, M46L for 1 cluster, and both Y181C and V75I for one cluster).
Table 2.
Characteristics of persons with HIV in 13 clusters identified at 0.5% genetic distance threshold with 3 years of diagnoses and at least 5 diagnoses in the past 12 months and all other persons with sequences using 3 years of diagnoses.
| Persons in 13 clusters identified at 0.5% threshold with 3 years of diagnoses and at least 5 diagnoses in the past 12 months (N=196) No. (%) |
All other persons in analysis with 3 years of diagnoses (N=30,127) No. (%) |
p-value | |
|---|---|---|---|
| Male | 194 (99) | 24,708 (82) | <0.0001 |
| Men who have sex with men (MSM), including MSM who inject drugs | 184 (94) | 18,716 (62) | <0.0001 |
| Race/Ethnicity | |||
| Asian | 9 (5) | 739 (2) | 0.08 |
| Black/African American | 27 (14) | 12,112 (40) | 0.001 |
| Hispanic/Latino | 96 (49) | 8,564 (28) | <0.0001 |
| White | 56 (29) | 7,609 (25) | 0.6 |
| Other | 8 (4) | 1,103 (4) | 0.9 |
| Age at diagnosis <30 years | 133 (68) | 12,457 (41) | <0.0001 |
| Population of area of residence | |||
| Nonmetropolitan areas (<50,000) | 0 (0) | 811 (3) | n/a |
| Metropolitan Areas (50,000–499,999) | 7 (4) | 3,295 (11) | 0.0002 |
| Metropolitan Areas (500,000–2.49M) | 84 (43) | 9,030 (30) | 0.2 |
| Metropolitan Statistical Areas (≥2.5M) | 104 (53) | 16,766 (56) | 0.8 |
| Unknown | 1 (1) | 225 (1) | 0.7 |
| Region | |||
| Northeast | 47 (24) | 6,711 (22) | 0.9 |
| Midwest | 7 (4) | 2,148 (7) | 0.4 |
| South | 81 (41) | 14,257 (47) | 0.6 |
| West | 61 (31) | 6,885 (23) | 0.5 |
| Other/Missing/Unknown | 0 (0) | 126 (0) | n/a |
| Drug resistance-associated mutations | 0.006 | ||
| Yes | 84 (43) | 5,918 (20) | |
| No | 97 (49) | 23,062 (77) | |
| Not determined | 15 (8) | 1,147 (4) |
Effect of changing the threshold for number of diagnoses in the past 12 months
Analysis using a 0.5% genetic distance threshold and recent diagnoses showed that indicators of recent and rapid transmission were similar whether a threshold of 5, 4, or 3 diagnoses in the past 12 months was applied (Table 3). Reducing the threshold to 4 or 3 diagnoses increased the number of clusters identified (from 13 to 27 or 80, respectively) and reduced the median size (from 16 to 12 or 5, respectively), but preserved the percentage with recent infection (56–63%), the percentage of nodes with age < 2 years (32–36%), and the transmission rate (31–33 per 100 person-years).
Table 3.
Comparison of indicators of recent and rapid HIV transmission between growing clusters identified at 0.5% threshold using recent diagnoses (2013–15), by minimum number of diagnoses in the past 12 months.
| Clusters with ≥ 5 diagnoses in past 12 months | Clusters with ≥ 4 diagnoses in past 12 months | Clusters with ≥ 3 diagnoses in past 12 months | |
|---|---|---|---|
| Number of clusters | 13 | 27 | 80 |
| Cluster size (median, range) | 16 (6–22) | 12 (4─22) | 5 (3─22) |
| Total number of people | 196 | 330 | 616 |
| No. (%) with HIV diagnosed in 2015 | 80 (41%) | 136 (41%) | 295 (48%) |
| No. (%) with recent infection** | 52 (63%) | 84 (60%) | 144 (56%) |
| Molecular clock phylogenetic analysis | |||
| Total no. of sequences*** | 195 | 329 | 615 |
| Time to most recent common ancestor for cluster (median, range) | 4.7 years (1.8–7.7) | 4.7 years (0.8─10.1) | 3.6 years (0.4─10.1) |
| Total no. of nodes (transmission events) | 182 | 302 | 535 |
| Node age (median, range) | 2.5 years (0.3–7.7) | 2.6 years (0.3─10.1) | 2.6 years (0.3─10.1) |
| No. (%) of nodes with age < 2 years | 65 (36%) | 96 (32%) | 187 (35%) |
| Transmission rate per 100 person-years | 33 | 31 | 31 |
Nine clusters did not achieve convergence in molecular clock analysis due to small sample size and a substantial number of diagnoses occurring in the most recent year. Sensitivity analyses excluding these clusters did not result in substantial changes to the cluster characteristics presented in the table.
Excludes persons for whom recency of infection could not be determined (denominator=83 for clusters with ≥5 diagnoses in past 12 months; denominator = 141 for clusters with ≥4 diagnoses in past 12 months; denominator = 259 for clusters with ≥3 diagnoses in past 12 months). Recent infection determined through the use of cross-sectional incidence assay, either BED (for 2013 diagnoses; mean duration of recent infection = 198.4 days) or Bio-Rad Avidity (for 2014 and 2015 diagnoses; mean duration of recent infection = 239.6 days).
Excludes persons with a missing sample collection date, which is needed for molecular clock phylogenetic analysis.`
Discussion
Given limited public health resources, it may not be possible to rigorously investigate and intervene in all HIV transmission clusters. We found that transmission network analysis using a genetic distance threshold of 0.5% identified a small number of clusters indicative of recent and rapid transmission, as evidenced by high transmission rates and recent node ages. Additionally, limiting analysis to recent diagnoses narrows in on portions of these clusters experiencing rapid transmission. This method can be applied to large datasets in routine analysis and can be easily communicated to a variety of public health, professional, and community stakeholders.
Detection of a cluster serves as a flag that can prompt investigation to identify other HIV-infected and uninfected persons connected to the cluster who could benefit from HIV prevention interventions. This is important, because molecular analyses can identify clusters only among persons with diagnosed HIV infection for whom sequence data have been reported. Persons with undiagnosed HIV infection, or those with diagnosed infection but without a sequence available for analysis (because drug resistance testing was not performed or sequence data were not reported to the health department), will not be identified through molecular analyses but can contribute to ongoing transmission. Additionally, although our use of a tight genetic distance threshold increases the specificity of cluster detection for recent transmission events, persons with long delays between infection and diagnosis might not be recognized as part of a cluster through these analyses, as delays could allow for viral evolution beyond 0.5% from others in the cluster. Consequently, public health action must not be limited to persons identified through sequence analysis.
Clusters identified at the 0.5% threshold likely reflect the leading edge of HIV transmission and result in a disproportionate number of new infections, as evidenced by a transmission rate more than 8 times that of national estimates.5 Persons in these clusters were disproportionately young MSM, consistent with other assessments of the forefront of HIV infection in the United States.27 Young Hispanic/Latino MSM were particularly represented in these clusters, highlighting the extent of rapid transmission in this group and the importance of ensuring that this population receives needed prevention and care services.
These rapidly growing, recent clusters were identified in regions across the United States, and most included persons from more than one state, highlighting the importance of conducting these analyses at a national level. Analysis at the local level is also essential, however, because data are available in closer to real time and analyses can be tailored to reflect local priorities. Moreover, this analysis demonstrated that reducing the number of diagnoses required to define a priority cluster to 4 or 3 can identify additional clusters with similarly high transmission rates, which may be desirable in areas that do not have priority clusters using the higher threshold or that have capacity to respond to additional clusters.
Importantly, these rapidly growing clusters were identified in a snapshot in time. Routine analysis conducted prospectively will identify additional clusters that meet these priority criteria. For example, clusters among persons who inject drugs and persons with heterosexual risk were not identified in this analysis, but outbreaks can occur within these groups.28 Expansion of collection of sequence data to the entire United States, which began in January 2018,29 will ensure our ability to detect such clusters in areas with high vulnerability to injection-associated outbreaks.30 Additionally, groups involved in rapidly growing clusters may differ geographically and over time, and a strength of this approach is that it can help identify the leading edge of transmission at a very local level, to guide the interventions that will be most important to slow or prevent transmission in a given area.
Interventions need to be based on the result of public health investigation, which is critical to identify other HIV-infected persons and those at risk of acquiring HIV infection, reveal characteristics of the cluster facilitating transmission, and select appropriate interventions. To facilitate investigation of the 13 growing clusters identified at the 0.5% genetic distance threshold, CDC offered assistance with cluster assessment and response to these jurisdictions, which have access to a variety of existing data sources to better understand clusters and characterize the entire transmission clusters (including persons without sequence data available). All jurisdictions reviewed partner services interview data and updated surveillance data, and some jurisdictions conducted more extensive investigations.31
Investigation results can guide tailored prevention efforts to interrupt transmission. People living with HIV who are not in medical care are candidates for re-engagement efforts.18 Persons with undiagnosed infection who are linked to members of the cluster can be reached through partner services, network-based recruitment and testing strategies, or venue- or community-based testing.32 Prevention efforts can also evaluate HIV-negative contacts who may be at risk of acquiring HIV for pre-exposure prophylaxis. In addition, community- and cluster-level prevention efforts (e.g., expansion of syringe exchange and substance abuse treatment for clusters associated with injection drug use) can be considered based on the circumstances of individual clusters.
This analysis is subject to limitations. Although jurisdictions conducting molecular HIV surveillance reported 70% of U.S. HIV diagnoses in 2015, data are not yet available for the entire United States. Cluster identification depends on completeness and timeliness of sequence data reporting, which can be affected by provider practices of ordering testing and laboratory processing and reporting.33 Consequently, the 13 clusters identified may not be representative of all recent and rapid transmission in the United States. For example, a 2015 HIV outbreak among persons who inject drugs in Indiana was not detected by this analysis because Indiana did not participate in molecular HIV surveillance.28 Our findings may also be biased by timeliness of HIV reporting (as some 2015 diagnoses may not have been reported to local jurisdictions by December 2015) and diagnosis (as populations with higher levels of late diagnosis34 are less likely to be included). It is important to continue to address late diagnoses. Still, our approach focuses on larger clusters and uses more stringent criteria for clustering than those evaluated in some reports,35 which may improve the specificity for increased transmission. Finally, linkages identified using this approach may represent direct or indirect epidemiologic connections, and our analysis does not identify directionality of transmission.
Our approach identified a small number of recent, rapidly growing transmission clusters. HIV nucleotide sequence data, generated by routine drug resistance testing and integrated into the robust infrastructure of CDC’s National HIV Surveillance System, provide a unique opportunity to identify HIV transmission clusters and guide public health action. Routine and timely detection of clusters, with subsequent investigation and intervention to interrupt further transmission, can focus limited public health resources on effective interventions among those at highest risk of new infections.
Supplementary Material
Acknowledgments:
H. Irene Hall, Neeraja Saduvala, Tianchi Zhang, Margaret Watson.
sources of funding: JOW was funded in part by an NIH-NIAID K01 Career Development Award (K01AI110181) and a contract from the Centers for Disease Control and Prevention (CDC).
Footnotes
Conflicts of interest:The authors report no conflicts of interest.
Author disclaimer: The findings and conclusions in this manuscript are those of the authors and do not necessarily represent the views of the Centers for Disease Control and Prevention
References
- 1.Hall HI, Song R, Tang T, et al. HIV Trends in the United States: Diagnoses and Estimated Incidence. JMIR Public Health Surveill. 2017;3(1):e8. [DOI] [PMC free article] [PubMed] [Google Scholar]
- 2.Centers for Disease Control and Prevention. HIV Surveillance Report, 2016. 2017.
- 3.Smith DK, Van Handel M, Wolitski RJ, et al. Vital Signs: Estimated Percentages and Numbers of Adults with Indications for Preexposure Prophylaxis to Prevent HIV Acquisition--United States, 2015. MMWR Morb Mortal Wkly Rep. 2015;64(46):1291–1295. [DOI] [PubMed] [Google Scholar]
- 4.Centers for Disease Control and Prevention. Estimated HIV Incidence and Prevalence in the United States, 2010–2015. HIV Surveillance Supplemental Report. 2018;23(1). [Google Scholar]
- 5.Holtgrave DR, Hall HI, Prejean J. HIV Transmission Rates in the United States, 2006–2008. The open AIDS journal. 2012;6:26–28. [DOI] [PMC free article] [PubMed] [Google Scholar]
- 6.Hogben M, McNally T, McPheeters M, Hutchinson AB. The effectiveness of HIV partner counseling and referral services in increasing identification of HIV-positive individuals a systematic review. Am J Prev Med 2007;33(2 Suppl):S89–100. [DOI] [PubMed] [Google Scholar]
- 7.Smith DM, May SJ, Tweeten S, et al. A public health model for the molecular surveillance of HIV transmission in San Diego, California. Aids. 2009;23(2):225–232. [DOI] [PMC free article] [PubMed] [Google Scholar]
- 8.Wertheim JO, Kosakovsky Pond SL, Forgione LA, et al. Social and Genetic Networks of HIV-1 Transmission in New York City. PLoS Pathog. 2017;13(1):e1006000. [DOI] [PMC free article] [PubMed] [Google Scholar]
- 9.Little SJ, Kosakovsky Pond SL, Anderson CM, et al. Using HIV Networks to Inform Real Time Prevention Interventions. PLoS One. 2014;9(6):e98443. [DOI] [PMC free article] [PubMed] [Google Scholar]
- 10.Panel on Antiretroviral Guidelines for Adults and Adolescents. Guidelines for the Use of Antiretroviral Agents in HIV-1-Infected Adults and Adolescents. In: Services DoHaH, ed2016. [Google Scholar]
- 11.Oster AM, Wertheim JO, Hernandez AL, Ocfemia MC, Saduvala N, Hall HI. Using Molecular HIV Surveillance Data to Understand Transmission Between Subpopulations in the United States. J Acquir Immune Defic Syndr. 2015;70(4):444–451. [DOI] [PMC free article] [PubMed] [Google Scholar]
- 12.Wertheim JO, Leigh Brown AJ, Hepler NL, et al. The global transmission network of HIV-1. J Infect Dis. 2014;209(2):304–313. [DOI] [PMC free article] [PubMed] [Google Scholar]
- 13.Wertheim JO, Oster AM, Hernandez AL, Saduvala N, Banez Ocfemia MC, Hall HI. The International Dimension of the U.S. HIV Transmission Network and Onward Transmission of HIV Recently Imported into the United States. AIDS Res Hum Retroviruses. 2016. [DOI] [PMC free article] [PubMed] [Google Scholar]
- 14.Whiteside YO, Song R, Wertheim JO, Oster AM. Molecular analysis allows inference into HIV transmission among young men who have sex with men in the United States. Aids. 2015;29(18):2517–2522. [DOI] [PMC free article] [PubMed] [Google Scholar]
- 15.Ragonnet-Cronin M, Jackson C, Bradley-Stewart A, et al. Recent and Rapid Transmission of HIV among People who Inject Drugs in Scotland Revealed through Phylogenetic Analysis. J Infect Dis. 2018. [DOI] [PMC free article] [PubMed] [Google Scholar]
- 16.Chan PA, Hogan JW, Huang A, et al. Phylogenetic Investigation of a Statewide HIV-1 Epidemic Reveals Ongoing and Active Transmission Networks Among Men Who Have Sex With Men. J Acquir Immune Defic Syndr. 2015;70(4):428–435. [DOI] [PMC free article] [PubMed] [Google Scholar]
- 17.Dennis AM, Pasquale DK, Billock R, et al. Integration of Contact Tracing and Phylogenetics in an Investigation of Acute HIV Infection. Sex Transm Dis. 2018;45(4):222–228. [DOI] [PMC free article] [PubMed] [Google Scholar]
- 18.Poon AF, Gustafson R, Daly P, et al. Near real-time monitoring of HIV transmission hotspots from routine HIV genotyping: an implementation case study. Lancet HIV. 2016;3(5):e231–238. [DOI] [PMC free article] [PubMed] [Google Scholar]
- 19.Oster AM, France AM, Mermin J. Molecular Epidemiology and the Transformation of HIV Prevention. JAMA. 2018. [DOI] [PMC free article] [PubMed] [Google Scholar]
- 20.Campbell EM, Jia H, Shankar A, et al. Detailed Transmission Network Analysis of a Large Opiate-Driven Outbreak of HIV Infection in the United States Journal of Infectious Diseases (in press). 2017. [DOI] [PMC free article] [PubMed] [Google Scholar]
- 21.Kosakovsky Pond SL, Weaver S, Leigh Brown AJ, Wertheim JO. HIV-TRACE (Transmission Cluster Engine): a tool for large scale molecular epidemiology of HIV-1 and other rapidly evolving pathogens. Molecular biology and evolution. 2018. [DOI] [PMC free article] [PubMed] [Google Scholar]
- 22.Hanson DL, Song R, Masciotra S, et al. Mean Recency Period for Estimation of HIV-1 Incidence with the BED-Capture EIA and Bio-Rad Avidity in Persons Diagnosed in the United States with Subtype B. PLoS One. 2016;11(4):e0152327. [DOI] [PMC free article] [PubMed] [Google Scholar]
- 23.Drummond AJ, Ho SY, Phillips MJ, Rambaut A. Relaxed phylogenetics and dating with confidence. PLoS Biol. 2006;4(5):e88. [DOI] [PMC free article] [PubMed] [Google Scholar]
- 24.Drummond AJ, Suchard MA, Xie D, Rambaut A. Bayesian phylogenetics with BEAUti and the BEAST 1.7. Molecular biology and evolution. 2012;29(8):1969–1973. [DOI] [PMC free article] [PubMed] [Google Scholar]
- 25.Wertheim JO, Oster AM, Johnson JA, et al. Transmission fitness of drug-resistant HIV revealed in a surveillance system transmission network. Virus Evol. 2017;3(1):vex008. [DOI] [PMC free article] [PubMed] [Google Scholar]
- 26.Wheeler WH, Ziebell RA, Zabina H, et al. Prevalence of transmitted drug resistance associated mutations and HIV-1 subtypes in new HIV-1 diagnoses, U.S.−2006. Aids. 2010;24(8):1203–1212. [DOI] [PubMed] [Google Scholar]
- 27.Centers for Disease Control and Prevention. HIV-Surveillance – Men Who Have Sex with Men (slide set). 2016; https://www.cdc.gov/hiv/ppt/library/slidesets/cdc-hiv-surveillance-slides-msm.pptx. April 17, 2017.
- 28.Peters PJ, Pontones P, Hoover KW, et al. HIV Infection Linked to Injection Use of Oxymorphone in Indiana, 2014–2015. N Engl J Med. 2016;375(3):229–239. [DOI] [PubMed] [Google Scholar]
- 29.Funding Opportunity Announcement (FOA) PS18–1802: Integrated Human Immunodeficiency Virus (HIV) Surveillance and Prevention Programs for Health Departments. https://www.cdc.gov/hiv/funding/announcements/ps18-1802/index.html.
- 30.Van Handel MM, Rose CE, Hallisey EJ, et al. County-Level Vulnerability Assessment for Rapid Dissemination of HIV or HCV Infections Among Persons Who Inject Drugs, United States. J Acquir Immune Defic Syndr. 2016;73(3):323–331. [DOI] [PMC free article] [PubMed] [Google Scholar]
- 31.Monterosso A, Minnerly S, Goings S, et al. Identifying and investigating a rapidly growing HIV transmission cluster in Texas.. Conference on Retroviruses and Opportunistic Infections; 2017; Seattle, WA. [Google Scholar]
- 32.Kimbrough LW, Fisher HE, Jones KT, Johnson W, Thadiparthi S, Dooley S. Accessing social networks with high rates of undiagnosed HIV infection: The social networks demonstration project. Am J Public Health. 2009;99(6):1093–1099. [DOI] [PMC free article] [PubMed] [Google Scholar]
- 33.Dasgupta S, Hall HI, Hernandez AL, Ocfemia MCB, Saduvala N, Oster AM. Receipt and timing of HIV drug resistance testing in six U.S. jurisdictions. AIDS Care. 2017:1–8. [DOI] [PMC free article] [PubMed] [Google Scholar]
- 34.Hall HI, Song R, Szwarcwald CL, Green T. Brief report: Time from infection with the human immunodeficiency virus to diagnosis, United States. J Acquir Immune Defic Syndr. 2015;69(2):248–251. [DOI] [PMC free article] [PubMed] [Google Scholar]
- 35.Poon AF. Impacts and shortcomings of genetic clustering methods for infectious disease outbreaks. Virus Evol. 2016;2(2):vew031. [DOI] [PMC free article] [PubMed] [Google Scholar]
Associated Data
This section collects any data citations, data availability statements, or supplementary materials included in this article.