

Abstract
Inflammatory markers including C-Reactive Protein (CRP) are increasingly used within research and clinical settings. Yet, varying methodologies for cleaning immunoassay data with out of range (OOR) samples may alter characteristic levels of CRP, thereby obscuring interpretation and reliability. This study investigated the influence of eight immunoassay OOR data treatment techniques on salivary CRP (sCRP) samples from at-risk adolescents. Participants from the ‘Sleep and Education: learning New Skills Early’ (SENSE) Study were 86 adolescents at-risk for depression (50 female), aged 14.29 years (SD=1.04). ANOVA results showed no statistically significant differences in average morning (F(7, 590)=1.24, p=.28) and evening (F(7, 599)=1.29, p=.25) values produced by each OOR data cleaning technique. However, varying techniques produced differences in the magnitude of Pearson’s correlations between consecutive saliva samples (r’s between .27 – .78), and influenced the significance of a sCRP diurnal pattern; two techniques produced statistically higher morning than evening sCRP levels (t(85)=2.70, p=.01 and t(85)=2.67, p=.01), whereas six techniques failed to find statistical differences between morning and evening sCRP levels (p’s >.05). Varying techniques also produced statistically divergent associations between sCRP and age and depressive symptoms. Results from this study provide evidence for the temporal stability of sCRP among adolescents, show winsorization as an effective OOR data management technique, and highlight the influence of methodological decisions in cleaning salivary biomarker data and the need for consistency within the field.
Keywords: adolescence, C-reactive protein, immunoassay, inflammation, non-detects, saliva, winsorization
1. Introduction
C-reactive protein (CRP) is a rapid systemic inflammatory responder to infection and tissue damage, supporting the immune system by killing and clearing pathogens from the body (Black et al., 2004). Inflammatory markers such as CRP are increasingly used in human clinical research as tools to measure exposure to various forms of psychological stress, biological responses to treatment interventions, and risk for medical issues such as cardiovascular disease (CVD; Ridker et al., 1998; Ridker et al., 2003). Although most studies have measured peripheral inflammatory markers in blood, newer research suggests that oral fluids (e.g., saliva, oral mucosal transudate, gingival crevicular fluid) may provide accurate detection of acute phase proteins such as CRP (Byrne et al., 2013), as well as associations between localized inflammatory markers and social stress (Slavich et al., 2010), depression (Delany et al., 2016), systemic inflammation (Megson et al., 2010), cognitive functioning (Cullen et al., 2017), and physical and psychological health (Naidoo et al., 2012; Goodson et al., 2014; Cicchetti et al., 2015). Investigating inflammatory markers via saliva has pragmatic benefits including relative ease of collection and non-invasiveness of sampling, making saliva particularly acceptable for use with clinical populations like anxious or depressed adolescents. Yet despite their utility, levels of salivary inflammatory markers such as salivary CRP (sCRP) may be highly sensitive to methodological decisions arising from the immunoassay process.
Immunoassays are tests used to quantify specific biomarker levels within a sample, using known concentrations of the biomarker (i.e., standards) to generate a standard curve. Sample values are then interpolated onto the standard curve to determine biomarker levels. Out of range (OOR) samples are values that are flagged by the assay procedure as ‘non-detects,’ samples too high above or too low below the standard curve range. These samples represent unique forms of missing data and require informed cleaning before their use in analyses. In the case of sCRP specifically, extreme sample values resultant from endogenous participant factors such as medication use, acute infection, or recent trauma (Posthouwer et al., 2004; Tsai et al., 2005; O’Brien et al., 2006; Prasad, 2006; Haran et al., 2012) are often excluded from analyses (Miller & Cole, 2012; Byrne et al., 2013; Park et al., 2016). However, the question of how to manage OOR data that persist after external factors have been controlled for remains.
Ideally, adjusted dilution and re-assay of OOR samples to fit within the standard curve range would occur, requiring additional resources that may no longer be available such as extra sample and assay kits. Incidentally, researchers investigating biomarkers have utilized numerous methods for OOR data management but often without justification for specific techniques. Some have removed all participants with OOR data (e.g., list-wise deletion, as in Lucas et al., 2016), calculated summary statistics for only detected observations (e.g., pair-wise deletion, as recommended by the Unite States [US] Environmental Protection Agency [EPA], 2000), imputed OOR data using covariate information (Lubin et al., 2004; Baccarelli et al., 2005), or winsorized OOR data (Patel et al., 2015). Still, others have substituted arbitrary values for low OOR samples (such as one half of the assay sensitivity value, e.g., Meier-Ewert et al., 2001; Tajimi et al., 2005), dichotomized data into ‘high’ versus ‘low’ level groups (Visser et al., 1999; Epel et al., 2001; Danner et al., 2003), extrapolated values outside the assay standard curve to incorporate OOR data (Kifude et al., 2008; Breen et al., 2011; Schlaudecker et al., 2013), or, more commonly, not reported OOR treatment procedures at all (e.g., Park et al., 2016).
To date, no consensus exists to address the many methods for treating immunoassay OOR data within psychobiological research despite the growing use of biomarkers such as sCRP. Arriving at such an accord is necessary for diligent research design and cross-study comparisons, as well as for clinical decision making. For example, cutoff points of <1 mg/L (low), 1–3 mg/L (moderate), and >3 mg/L (high) of serum CRP levels have been used to assess American Heart Association (AHA) CVD risk (Ridker, 2003), with Out and colleagues (2013) finding similar results when predicting AHA CVD risk from sCRP levels as well. These findings highlight the utility of salivary measures of inflammation, and the strong needs for consistent processing of immunoassay data to ensure measurement reliability.
Therefore, from a sample of convenience, this paper aimed to evaluate the sensitivity of levels of sCRP to OOR data cleaning techniques in three distinctive ways. First, previous research has shown in sample sizes ranging from 27 to 107 participants that sCRP is highly stable over consecutive days and across time (Out et al., 2012; Izawa et al., 2013). As such, we aimed to first test the influence of eight distinct OOR data treatment methodologies on their capacity to alter the strength of correlation between consecutive, biological duplicate (i.e., “test-retest”) samples across two days. Second, because some research has shown that sCRP exhibits a high morning, low evening diurnal pattern (Koc et al., 2010; Out et al., 2012; Izawa et al., 2013; Cullen et al., 2017), we aimed to examine how different OOR data cleaning techniques may influence the relationship between morning and evening levels of sCRP. Third, as CRP has been previously associated with both age (Park et al., 2016) and depression (Howren et al., 2009), we aimed to investigate how varying OOR data treatment techniques could influence the strength of associations between CRP and age, and CRP and depressive symptoms. Hopefully this will lead to more consistent methodological treatment for research with inflammatory biomarkers, greater reproducibility and replication, ultimately resulting in greater vertical movement in this field.
2. Materials and methods
2.1. Participants
A baseline subsample of participants within the ‘Sleep and Education: learning New Skills Early’ (SENSE) Study who provided both morning and evening saliva samples across two consecutive days and who reported no medication use nor recent physical illness were chosen for inclusion in the present study. Eighty-six adolescents (50 female) aged 14.29 years (SD=1.04) provided 344 saliva samples. Briefly, the SENSE Study (n=144) was a randomized control trial (RCT) investigating the efficacy of a 7-week mindfulness-based cognitive behavior sleep treatment program to prevent depression in at-risk adolescents. ‘At-risk’ was defined as adolescents with high anxiety and poor sleep, and no current or prior diagnosis of a Major Depressive Disorder. Supplementary Table 1 presents brief participant descriptive data including ‘at-risk’ characterization as defined by the SENSE Study. A full description of the screening process and protocol for the SENSE Study can be found in Waloszek et al and (2015) immediate post-intervention treatment effects can be found in Blake et al. (2016) and Blake et al. (2017a, 2017b).
2.2. Salivary-reactive protein measurement
Participants collected approximately 2 mL per each saliva sample via ‘passive drool’ and were instructed not to eat, drink, or brush their teeth for at least 30 minutes prior to sample collection. Consecutive weekday morning 1 (M1) and morning 2 (M2) average collection times were 07:25 (SD=79.0 minutes), and 07:16 (SD=59.1 minutes), respectively. Consecutive weekday evening 1 (E1) and evening 2 (E2) average collection times were 20:42 (SD=66.0 minutes), and 20:09 (SD=78.9 minutes), respectively. Samples were first stored in a −30°C freezer for an average of 16.0 months (SD=11.3 months), and in preparation for assay, all samples were removed from −30°C freezers to centrifuge at 10,000g for 10 minutes at room temperature (24°C). Clarified saliva was aliquoted into 1.5 mL eppendorf tubes and stored in −80°C freezers until the day of assay, an average of 36.5 months after sample collection (SD=10.6 months). Samples underwent two freeze/thaw cycles. Enzyme linked immunosorbent assays (ELISA) were conducted with sCRP Salimetrics (State College, PA) research assay kits following protocols. All samples were assayed in duplicate using identical lot number assay kits. Saliva test volume was 15 µL, samples were diluted 1:10 prior to assay, and kits had a standard curve range from 93.75 to 3000 pg/mL with a lower limit of sensitivity of 10 pg/mL. Inter- and intra-assay coefficients of variability were 4.68% and 16.0%, respectively.
2.3. Medication use/physical health
Diaries were used during sample collection to exclude possible influences of recent medication use or physical illness on sample values. Although serum levels of CRP > 10 mg/L indicate acute infection (Ridker, 2003; Pearson et al., 2003), no corresponding acute infection cut-off values for CRP as measured by saliva exist to date. Therefore, participants were chosen for the current methodological study if they reported no current or recent medication use, physical illness or injury, or oral health issue.
2.4. Standard curve constraints
Standard microplate readers used for ELISA include software that supports absorbance detection for bioassays and calculations of corresponding concentrations based on interpolation of the optical density (OD) onto the standard curve. Using an extrapolation method within KC Junior Software® (Bio-Tek Instruments, Inc.), a widely used data analysis software for absorbance detection with immunoassays, extrapolated OD values were interpolated on the linear standard curve recommended by Salimetrics for sCRP.
Data outside the immunoassay standard curve range were removed in strict standard curve datasets. Data that were software-extrapolated outside the standard curve range were retained within relaxed standard curve datasets. Table 1 depicts percent and number of low and high OOR data per strict and relaxed curve datasets.
Table 1.
Dataset models
| Standard Curve |
OOR Samplesa n (%) |
Out of Range Treatment Method |
Dataset Abbreviation (n) |
|---|---|---|---|
| Strict (S) | bLow: 36 (10.5%) | List-wise deletion (LWD) | SLWD (46) |
| Pair-wise deletion (PWD) | SPWD (86) | ||
| bHigh: 46 (13.4%) | Multiple imputation (MI) | SMI (86) | |
| Winsorization (W) | SW (86) | ||
| Relaxed (R) | cLow: 0 (0.0%) | List-wise deletion (LWD) | RLWD (77) |
| Pair-wise deletion (PWD) | RPWD (86) | ||
| cHigh: 20 (5.8%) | Multiple imputation (MI) | RMI (86) | |
| Winsorization (W) | RW (86) |
n=344 total saliva samples used in the current study
n=44 morning OOR samples, n=38 evening OOR samples
n=12 morning OOR samples, n=8 evening OOR samples
2.5. Assay out of range treatment techniques
In addition to standard curve extrapolation, four common techniques used in the literature for OOR data were tested in the present study. Each of the four OOR treatment techniques were performed on both datasets with strict curves and with relaxed curves, thereby generating a total of eight datasets.
2.5.1. List-wise deletion.
In the strict list-wise deletion (LWD) dataset, participants with OOR values outside the standard curve were deleted list-wise from analyses (n=40 deleted participants, 46 remained). For the relaxed LWD dataset, participants were deleted list-wise from analyses only if OOR sample values remained after extrapolation of the curve (n=9 deleted participants, 77 remained).
2.5.2. Pair-wise deletion.
Whereas LWD involves deleting all values for a given participant with an OOR sample, PWD only deletes the sample value which is OOR but the sample n remains unchanged. Therefore, for the strict pair-wise deletion (PWD) dataset, sample values outside the standard curve were deleted (n=82 samples), however, all participants (n=86) remained for analyses. For the relaxed PWD dataset, OOR sample values that remained OOR after extrapolation (n=20 samples) were never assigned a value (i.e., left blank) and total number of participants (n=86) remained unchanged.
2.5.3. Multiple imputation.
For the strict multiple imputation (MI) dataset, sample values outside the standard curve were multiply imputed (n=82 samples), and all participants (n=86) remained for analyses. For the relaxed MI dataset, OOR sample values that remained OOR after extrapolation (n=20) were multiply imputed and total number of participants (n=86) remained unchanged. Section 2.6 details specific multiple imputation methods.
2.5.4. Winsorization.
For the strict winsorization dataset, any sample above or below the standard curve (n=82 samples) was winsorized (i.e., the data point was replaced with the next highest or lowest value from values within the standard curve range, rounded to the next .01 pg/mL), constituting an unchanged total number of participants (n=86). For the relaxed winsorization dataset, sample values that remained OOR after extrapolation (n=20) were winsorized as above using values within the relaxed sample distribution range, with an unchanged total number of participants (n=86).
Table 1 presents the identical sCRP datasets treated in eight different ways to compare eight methods of managing OOR data.
2.6. Statistical analyses
Data cleaning, analyses, and graphics were conducted in RStudio Version 3.4.0 ( Development Core Team, 2017), using the following packages: ‘stats’ (R Development Core Team, 2017), ‘BaylorEdPsych’ (Beaujean, 2012), ‘mice’ (van Buuren & Groothuis-Oudshoorn, 2011), ‘miceadds’ (Robitzsch et al., 2017), ‘psych’ (Revelle, 2017), and ‘ggplot2’ (Wickham, 2009). All datasets were tested for random missingness of OOR data using Little’s Missing Completely at Random (MCAR) test (Little, 1988), and were found to meet either MCAR or ‘missing at random’(MAR) standards.
Corresponding OOR treatment techniques were applied to each dataset, and morning-average (Mavg) and evening-average (Eavg) sCRP values were calculated within each dataset by taking the average of M1 and M2 samples, and E1 and E2 samples, respectively. Outliers > ±3 standard deviations (SD) above/below the mean were investigated by log-transforming the values in each dataset (to correct for positive skew), which revealed that only the SLWD, RLWD, and RW datasets contained sample value outliers. As in Byrne and colleagues (2013) and Out and colleagues (2012), statistical outliers in the SLWD (n=1 above), RLWD (n=2 above, 2 below), and RW (n=1 below) datasets were winsorized to the .01 pg/mL. Steps were taken to ensure these outliers were not extreme and therefore possibly due to presence of acute infection: 1) participants were not included in this study if they self-reported recent acute infection or medication use; 2) additional investigations confirmed these outliers (n=6 total outliers) were between 3–4 SD from the mean, and; 3) post-hoc analyses (not shown) were conducted which confirmed that all results did not change when outliers were not winsorized. MI, generating five imputed datasets, was performed on MI datasets on natural log-transformed data with the predictive mean matching method and appropriate for MCAR or MAR data.
Statistical analyses were performed on natural log transformed data which corrected for positive skew in all datasets. Power analysis revealedMANUSCRIPTthat80%powerwouldgenerateamoderate effect size with a two-tailed α=.05 with 84 participants. One-way analyses of variance (ANOVA) were performed to examine if datasets produced Mavg and Eavg sCRP values which statistically differed from each other. Pearson’s correlation analyses were conducted to assess the strength of stability between M1 and M2 samples and E1 and E2 samples for each of the eight datasets. Paired sample t-tests were performed on each dataset to examine within-participant diurnal differences between Mavg and Eavg samples. Simple regressions were conducted with each dataset to separately examine the main effect of age and depression on sCRP levels. Analyses were conducted on natural-log transformed data, but figures were represented using log10 scales to better visualize dataset distributions.
3. Results
3.1. Sample characteristics
Demographic statistics for the sample and statistical differences between participants with and without OOR values are presented in Supplementary Table 1. Independent samples t-tests and chi square analyses revealed no differences in demographic variables between participants with and without OOR values.
3.2. Methodological influences on salivary CRP stability and diurnal pattern
Mean (SD) for Mavg and Eavg sCRP levels per each dataset are represented in Table 2, descriptive statistics for consecutive morning and evening sCRP samples for each of the eight datasets are displayed in Supplementary Table 2. Table 2 also presents dataset dependent Pearson’s correlation results for the test-retest stability between M1 and M2 and E1 and E2 samples, and paired sample t-test results for within-participant diurnal differences between Mavg and Eavg sCRP levels.
Table 2.
Dataset dependent stability, average descriptive statistics, and within-participant diurnal differences of consecutive sCRP samples
| Two-day stability |
Diurnal difference |
||||
|---|---|---|---|---|---|
| M1~M2 | E1~E2 | Non-transformed mean (SD) pg/mL | Mavg ~ Eavg | ||
| Datest | r | r | Mavg | Eavg | t |
| SLWD | .61*** | .42** | 4790.61(4483.70) | 3515.53(2783.45) | 2.70** |
| SPWD | .60*** | .52*** | 4533.65(4318.90) | 4203.72(4504.46) | 2.67* |
| SMI | .38*** | .27* | 4413.49(3811.08) | 3894.53(3847.18) | 0.97 |
| SW | .63*** | .76*** | 7705.30(3811.08) | 7085.81(8839.31) | 1.60 |
| RLWD | .36*** | .62*** | 6607.33(9655.34) | 6076.64(10658.83) | 1.31 |
| RPWD | .35*** | .70*** | 6607.33(9655.34) | 8314.64(14741.74) | 1.31 |
| RMI | .38*** | .70*** | 9247.93(12392.69) | 9179.78(12392.69) | 1.11 |
| RW | .58*** | .78*** | 13578.53(22835.00) | 12350.90(21888.21) | 1.49 |
p < .05
p < .01
p < .001
Abbreviations: E1, evening 1; E2, evening 2; M1, morning 1; M2, morning 2; Mavg, average morning; Eavg, average evening; RLWD, relaxed list-wise deletion; I, relaxed multiple imputation; RPWD, relaxed pair-wise deletion; RW, relaxed winsorization; sCRP, salivary C-reactive protein; SD, standard deviation; SLWD, strict list-wise deletion; SMI, strict multiple imputation; SPWD, strict pair-wise deletion; SW, strict winsorization.
One-way ANOVA results indicated no statistical differences between the mean sample values produced by each OOR data cleaning technique for either the average morning (F(7, 590)=1.24, p=.28) or average evening (F(7, 599)=1.29, p=.25) datasets. However, seven of the eight datasets evidenced higher morning than evening average sCRP levels; paired samples t-tests indicated this relationship was statistically significant only for values within the SLWD and SPWD datasets (p’s <.05). To account for possible within-subject correlations, mixed model analyses were also conducted with sample ‘time’ and ‘day’ as fixed effects and ‘participant ID’ as a random effect, which yielded similar results (data not shown). That is, for the SLWD and SPWD datasets only, sample time (but not day) predicted the same value, identical to paired sample t-test results.
Pearson’s correlation results represent differences in the magnitude of significant positive correlations between M1 and M2 samples (all p’s <.001) with correlation coefficients between .35 and.63 depending on the dataset, and between E1 and E2 samples (all p’s <.05) with correlation coefficients between .27 and .78, depending on the dataset. Fisher’s transformation results indicated that several day-to-day stability correlation coefficients were statistically significantly different from each other (Supplementary Table 3).
Table 4 represents the main effects of age and depressive symptoms on morning and evening average levels of sCRP resultant from the eight different datasets. Age was significantly associated with evening sCRP levels only within the SW, RLWD, RMI, and RW datasets, and depressive symptoms were significantly associated with evening sCRP levels only within the SPWD dataset.
Table 4.
Dataset dependent effects of age and depressive symptoms on morning and evening salivary CRP
| Datest (β, S.E.) |
|||||||||
|---|---|---|---|---|---|---|---|---|---|
| Predictor | Outcome | SLWD | SPWD | SMI | SW | RLWD | RPWD | RMI | RW |
| Age | CRPMavg | .001 (.15) | .07 (.13) | −.09 (.17) | .16 (.11) | .13 (.11) | .13 (.11) | .11 (.13) | .15 (.11) |
| CRPEavg | .10 (.15) | .15 (.24) | .13 (.17) | .26 (.11)* | .27 (.11)* | .20 (.11) | .29 (.12)* | .25 (.11)* | |
| CES-D | CRPMavg | .12 (.15) | .10 (.14) | .12 (.17) | .04 (.11) | −.01 (.12) | −.01 (.12) | −.0001 (.13) | .01 (.11) |
| CRPEavg | .16 (.15) | .27 (.13)* | .26 (.16) | .04 (.11) | −.01 (.12) | .08 (.11) | .04 (.13) | .01 (.11) | |
p < .05
Abbreviations: CES-D, Center for Epidemiologic Studies – Depression subscale; CRP, C-reactive protein; Mavg, average morning; Eavg, average evening; RLWD, relaxed list-wise deletion; RMI, relaxed multiple imputation; RPWD, relaxed pair-wise deletion; RW, relaxed winsorization; S.E., standard error; SLWD, strict list-wise deletion; SMI, strict multiple imputation; SPWD, strict pair-wise deletion; SW, strict winsorization
Figure 1 depicts Pearson’s correlations between consecutive morning and consecutive evening sCRP (log10-transformed) samples for datasets with the strongest correlation (blue) and weakest correlation (red) according to Pearson’s r as reported in Table 2. Figure 2 shows kernel density distribution plots for Mavg and Eavg sCRP levels, with wider kernel bandwidths corresponding to denser clustering of samples, which represents the varying degrees of difference in the range, concentration, median, and interquartile range of observations captured by each dataset.
Figure 1.
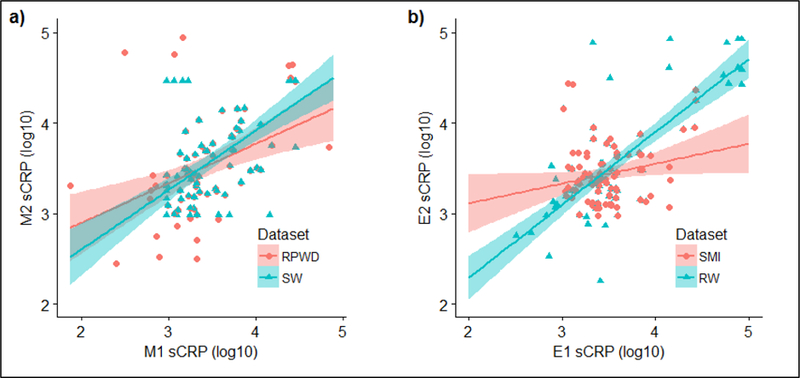
Pearson’s correlations between consecutive morning (a) and consecutive evening (b) log10-transformed sCRP samples with 95% confidence intervals (shaded) for OOR data cleaning techniques with the strongest correlation (blue) and weakest correlation (red) according to Pearson’s r as reported in Table 2.
Abbreviations: E1, evening 1; E2, evening 2; M1, morning 1; M2, morning 2; OOR, out of range; RPWD, relaxed pairwise deletion; RW, relaxed winsorzation; sCRP, salivary C-reactive protein; SMI, strict multiple imputation; SW, strict winsorization.
Figure 2.

Kernel probability density distribution and median (± interquartile range) of log10 2-day average morning (a) and 2-day average evening (b) sCRP by dataset.
Abbreviations: RLWD, relaxed list-wise deletion; RPWD, relaxed pair-wise deletion; RMI, relaxed multiple imputation; RW, relaxed winsorization; sCRP, salivary C-reactive protein; SLWD, strict list-wise deletion; SPWD, strict pair-wise deletion; SMI, strict multiple imputation; SW, strict winsorization
4. Discussion
The goal of this study was to address the need for methodological consistency in managing immunoassay OOR data within psychobiological research fields. To do so, we tested the ability of eight OOR data management techniques to alter the test-retest stability of two consecutive sCRP samples, as well as influences on the diurnal relationship between morning and evening sCRP levels and links between sCRP and age and depression among an at-risk adolescent sample. Our findings suggest differences in the methods of immunoassay OOR data cleaning may influence sample mean, range, temporal stability, statistical significance of a diurnal pattern of sCRP, and alter statistical associations between sCRP and age and depression.
Consistent with adult samples in studies by Out and colleagues (2010) and Izawa and colleagues (2013), our results indicated that regardless of OOR immunoassay data cleaning methodologies, adolescent morning and evening sCRP levels were statistically stable over two consecutive days. However, the strength of this stability varied widely dependent upon which OOR data treatment technique was applied. In addition, in line with previous research among adults (Out et al., 2010; Izawa et al., 2013) and adolescents (Cullen et al., 2017), our results indicated some support for a diurnal variation in levels of adolescent sCRP; however, again results were strongly tempered by OOR data management techniques. Because only two of eight OOR data techniques produced a statistically significant diurnal pattern, concluding whether a diurnal sCRP pattern exists among adolescents is yet to be determined until more research utilizing consistent OOR data cleaning techniques is conducted. However, what is clear is the capacity for OOR data methods to alter characteristic levels of inflammatory markers and therefore the crucial need for methodological consistency in cleaning immunoassay OOR data.
Managing OOR data with extra polation beyond the immunoassay standard curve resulted in inconsistent correlations between consecutive sCRP samples. Extrapolation produced high correlations when paired with certain OOR techniques (e.g., winsorization) and low correlations when paired with others (e.g., LWD). This may be related to the fact that while extrapolation could assign values to all low OOR data, extrapolation could only interpolate roughly half of high OOR data. This may have led to an underrepresentation of the temporal stability between samples with high sCRP levels, 5.8% of which were deleted list-wise from analyses in LWD datasets. These results, however, should be interpreted with caution. Extrapolation is not strongly recommended by immunoassay manufacturers because outside the assay standard curve range the curve may be non-linear and therefore extrapolated values may be less reliable. The manufacturer-recommended standard curve for sCRP in this study was linear, but a four-parameter logistic (4-PL) regression curve is also commonly used for ELISA immunoassays as it is compatible for biological systems which describe an antibody-antigen interaction and not necessarily a linear dose-response relationship (Nix & Wild, 2005; Findley & Dillart, 2007; Cox et al., 2012), in which case a reduction in accuracy would be expected when using extrapolation. Additionally, when we investigated OOR management techniques with an additional biomarker (cortisol, which employs a 4-PL curve), extrapolation of the standard curve to incorporate OOR values still generated values within the standard curve range (see Supplementary Table 4). Therefore, extrapolation may only apply to widely ranging data (such as sCRP or other inflammatory markers), as opposed to more narrowly distributed biomarkers such as cortisol with a normal range of 0.012 – 3.0 µg/dL.
OOR data treated with LWD may have failed to accurately represent our sample’s distribution and variance because participants with OOR data in LWD datasets were categorically eliminated. LWD reduced dataset sample sizes by up to more than 50%, making it likely that statistical bias was introduced. As our power calculations indicated a moderate effect size would be achieved with 84 participants, the relatively poor performance of LWD datasets may have been resultant from low power (with only 42 participants remaining after LWD was applied), further demonstrating that exclusion of participants is not advised. The PWD technique may have helped datasets preserve statistical power by retaining participant sample size. However, while the US EPA has recommended PWD for OOR data in environmental research, they have also cautioned its use because it can lead to decreases in mean and increases in variance (US EPA, 2000), as was the case for PWD datasets in the current study.
Previous studies utilizing MI for low OOR data found good protection against bias (Lubin et al., 2004; Baccarelli et al., 2005). Yet, our results showed mixed results for MI, and when paired with a strict immunoassay standard curve, MI produced the overall lowest two-day sCRP stability among consecutive evening samples (r=.27). In addition, in analyses investigating the varying OOR techniques with cortisol, our results showed that using MI for OOR values failed to produce statistically significant correlations between consecutive evening samples altogether (see Supplementary Table 4). Whereas low OOR imputed values have an absolute lower limit (e.g., 0 pg/mL), over half (56%) of imputed values in the strict curve dataset and 100% of imputed values in the relaxed curve dataset were for high OOR data which theoretically have no upper limit. This may explain the relative poor performance of MI for OOR data in the present study. Nevertheless, a strength of MI is that it draws upon covariate information to impute missing data, particularly advantageous if no other information about the missing values existed. However, given the inherent hierarchical nature of OOR data, imputed values that do not retain ordinal information fail to accurately represent these missing values. Although statistically Little’s MCAR test (Little, 1988) indicated that the data was MAR, because we know that the data is missing due to its OOR value (i.e., it is missing because it is either too high or too low), the missing values are therefore realistically missing not at random (MNAR). Further, although we showed that missingness was not associated with any observed demographic variables in our dataset (see Supplementary Table 1), this does not preclude it being related to other variables not measured here, and the fact remains that because we have some information about the reason the values are missing, we assume the data are MNAR. As such, deleting cases list-wise in this scenario is the least desirable. Imputing the data would be more robust if we assumed the data were MAR at the very least. Therefore, we posit that winsorization, which allowed us to use the ordinal information from the assay to estimate the data, is the most appropriate data treatment in this scenario.
While dichotomization of data retains ordinal information, this technique can reduce statistical power by the same amount as deliberately discarding roughly a third of the data (Cohen, 1983; MacCallum et al., 2002). Further, with dichotomization data close to the median on either side become categorically opposite when such observations are realistically similar. In contrast, winsorization retains ordinal information of OOR data while preserving variance and range inherent to the distribution and is considered a conservative ‘smoothing procedure’ in accordance with multivariate statistical advice (Tabachnick & Fidell, 2013). This may explain why winsorization of OOR immunoassay values in the current study consistently produced the highest correlations between consecutive sCRP samples. Although there was no consistent pattern of agreement regarding OOR data cleaning approaching in the context of third variables (age and depression), associations between CRP and age and CRP and depression remain mixed, in particular, during adolescence (Woloshin & Schwartz, 2005; Howren et al., 2009; Chaiton et al., 2010; Cullen et al., 2017). Further, a recent systematic review and meta-analysis revealed that effect sizes between CRP and depression diminished when only methodologically rigorous studies which controlled for appropriate confounds were included; the review also highlighted that inconsistencies in data cleaning may be causing such problems in this area of research (Horn et al., 2018). Thus, no clear recommendations regarding OOR data cleaning should be made on the basis of these associations until further research is conducted to solidify these links in adolescence. Instead, a better test would be to observe technique-dependent differences in associations known to be relatively strong. Because previous research has demonstrated that consecutive sCRP samples should be highly correlated (Out et al, 2012; Izawa et al., 2013), winsorization’s ability to preserve this test-retest stability may suggest its use as an effective method for the treatment of OOR data in salivary inflammatory research.
Our data show that methods for cleaning inflammatory OOR data not only influence the stability of sCRP across days but can also impact significance of a diurnal pattern. LWD and PWD techniques performed on OOR data within strict immunoassay standard curve frameworks produced statistically significantly higher morning than evening sCRP levels among at-risk adolescents. Although it is likely that statistical bias was introduced by using LWD as mentioned above, these results are consistent with previous findings involving both adults and adolescents (Koc et al., 2010; Out et al., 2012; Izawa et al., 2013; Cullen et al., 2017). While an in-depth interpretation of the sCRP diurnal pattern among at-risk adolescents was outside the scope of this methods investigation, no clear explanation emerged as to why only the use of LWD and PWD in strict curve conditions would produce a statistically significant high morning, low evening diurnal sCRP pattern in line with previous work. It is possible that these prior studies have similarly used LWD or PWD for immunoassay out of range values which would be consistent with our results; yet, because these studies did not specify whether any immunoassay sample values were out of range and if so, how these sample values were managed, until more research is conducted in this area it remains unclear if the diurnal pattern demonstrated in this study is an artefact of data management techniques or a true representation of the CRP diurnal pattern.
Conversely, the remaining 75% of OOR data treatment techniques employed in the current study resulted in non-significant differences between morning and evening sCRP levels, consistent with serum samples from 10 healthy adults (Meier-Ewert et al., 2001) and adding to the debate about whether a diurnal CRP pattern exists. Our divergent results could be due to an issue of this study’s power, as previous studies have detected diurnal CRP patterns with larger sample sizes or multiple sampling throughout the day (Koc et al., 2010; Out et al., 2012; Izawa et al., 2013; Cullen et al. 2017). However, LWD used in this study reduced the sample size by over half and yet still found a diurnal pattern in sCRP, suggesting that sCRP data were perhaps more sensitive to immunoassay data management techniques than sample size. Moreover, research suggests that biomarker diurnal accuracy is as strong with morning and evening collection time points compared to five collection time points across the day (Kraemer et al., 2006). Thus, with only one other study investigating temporal characteristics of CRP data among youth (Cullen et al., 2017), more research is needed which utilizes consistent immunoassay OOR data management techniques to clarify the inconsistencies regarding the CRP diurnal pattern highlighted in our study. As with the management of OOR values, establishing whether there is such a diurnal pattern, although outside the scope of this study, will similarly allow for more accuracy in sample values if collection time should influence CRP levels.
Finally, our data demonstrate that data reduction methods could have significant clinical implications. While a discussion of the effects of age and depressive symptoms on sCRP levels were outside the scope of this investigation, differing OOR treatment techniques produced statistically significant divergent associations between age and sCRP and depression and sCRP. OOR samples treated with PWD and without extrapolation of a standard assay curve produced significant associations with depression, whereas all other datasets did not; a finding which could lead researchers, clinicians, and participants or patients down very different paths for follow-up or treatment. Additionally, our supplementary investigations into OOR data management with cortisol data paralleled that of sCRP data, suggesting that OOR management techniques are not only an inflammatory biomarker issue but should be adopted for biomarker data management more broadly. Such discrepancies highlight the strong need for homogeneity of biomarker OOR data cleaning in the field, and at the very least, transparency in reporting of their management.
5. Conclusion
While future research could also test a more exhaustive list of OOR immunoassay data cleaning methods, this investigation examined the capacity of eight commonly used techniques toinfluence characteristic levels of sCRP. These results underscore the important effect methodological decisions have on sCRP data, potentially salivary biomarker data more broadly, and the need for uniformity in the treatment of OOR data in immunoassay research. Consistent use of techniques to manage OOR data which retain correlative stability of biomarker levels is one such way in which biomarker reliability of measurement may be achieved .Certainly, methodological consistency will aid in cross-study comparisons, but more importantly, should biomarkers continue to be used in clinical settings for diagnostic purposes, reliability of measurement is imperative. Therefore, to justify OOR data decisions, the authors encourage at the very least visualization of biomarker data and presentation of results of varying tactics used to treat OOR immunoassay data. Results of this study also highlight the utility of winsorization as a reliable OOR data management method, and as such we recommend researchers in psychobiological fields adopt its use for OOR immunoassay biomarker data cleaning.
Supplementary Material
Table 3.
Dataset dependent effects of age and depressive symptoms on morning and evening salivary CRP
| Dataset (β, S.E.) |
|||||||||
|---|---|---|---|---|---|---|---|---|---|
| Predictor | Outcome | SLWD | SPWD | SMI | SW | RLWD | RPWD | RMI | RW |
| Age | CRPMavg | .001 (.15) |
.07 (.13) |
−.09 (.17) |
.16 (.11) |
.13 (.11) |
.13 (.11) |
.11 (.13) |
.15 (.11) |
| CRPEavg | .10 (.15) |
.15 (.24) |
.13 (.17) |
.26 (.11)* |
.27 (.11)* |
.20 (.11) |
.29 (.12)* |
.25 (.11)* |
|
| CES-D | CRPMavg | .12 (.15) |
.10 (.14) |
.12 (.17) |
.04 (.11) |
−.01 (.12) |
−.01 (.12) |
−.001 (.13) |
.01 (.11) |
| CRPEavg | .16 (.15) |
.27 (.13)* |
.26 (.16) |
.04 (.11) |
−.01 (.12) |
.08 (.11) |
.04 (.13) |
.01 (.11) |
|
p < .05
Abbreviations: CES-D, Center for Epidemiologic Studies – Depression subscale; CRP, C-reactive protein; Mavg, average morning; Eavg, average evening; RLWD, relaxed list-wise deletion; RMI, relaxed multiple imputation; RPWD, relaxed pair-wise deletion; RW, relaxed winsorization; S.E., standard error; SLWD, strict list-wise deletion; SMI, strict multiple imputation; SPWD, strict pair-wise deletion; SW, strict winsorization
Highlights.
Investigation of biomarker immunoassay out of range data cleaning methods
Consistency in immunoassay data cleaning aids reliability and reproducibility
Techniques to manage immunoassay nondetects strongly impact inflammatory data
Winsorization is a robust technique for treating immunoassay nondetects
Adolescent salivary C-reactive protein is temporally stable
7. Acknowledgments
The authors received funding from the Australian National Health and Medical Research Council Grant (APP1027076) for this study. Dr. Byrne is supported by an NIMH K01 Award (K01MH111951). The authors would also like to thank the participants of the SENSE Study and the following individuals for their contribution to the project: Camille Dean, Stefanie Rosema, Viviana Lee, Jess Slonim, Michael Gate, Vanessa Rowell, Tamsen Franklin, Stefan Friedel, Lauren Ban, Lian Snoep, Natasa Stoilov, Anja Plagemann, Giovanni Andreoli, Alex Klein, Carra Simpson, Michael Wilson, and Adam Pettitt.
Footnotes
Publisher's Disclaimer: This is a PDF file of an unedited manuscript that has been accepted for publication. As a service to our customers we are providing this early version of the manuscript. The manuscript will undergo copyediting, typesetting, and review of the resulting proof before it is published in its final citable form. Please note that during the production process errors may be discovered which could affect the content, and all legal disclaimers that apply to the journal pertain.
References
- Baccarelli A, Pfeiffer R, Consonni D, Pesatori AC, Bonzini M, Patterson DG, … Landi MT (2005). Handling of dioxin measurement data in the presence of non-detectable values: Overview of available methods and their application in the Seveso chloracne study. Chemosphere, 60(7), 898–906 [DOI] [PubMed] [Google Scholar]
- Beaujean AA (2012). BaylorEdPsych: R package for Baylor University Educational Psychology quantitative courses (Version 0.5) [Computer software] Waco, TX: Baylor University. [Google Scholar]
- Black S, Kushner I, & Samols D (2004). C-reactive protein. Journal of Biological Chemistry, 279(47), 48487–48490 [DOI] [PubMed] [Google Scholar]
- Blake M, Waloszek JM, Schwartz O, Raniti M, Simmons JG, Blake L, … Allen NB (2016). The SENSE study: Post intervention effects of a randomized controlled trial of a cognitive? behavioral and mindfulness-based group sleep improvement intervention among at-risk adolescents. Journal of Consulting and Clinical Psychology, 84(12), 1039–1051 [DOI] [PubMed] [Google Scholar]
- Blake MJ, Snoep L, Raniti M, Schwartz O, Waloszek JM, Simmons JG, … Allen NB (2017a). A cognitive-behavioral and mindfulness-based group sleep intervention improves behavior problems in at-risk adolescents by improving perceived sleep quality. Behaviour Research and Therapy, 99(September), 147–156 [DOI] [PubMed] [Google Scholar]
- Blake M, Schwartz O, Waloszek JM, Raniti, … Simmons JG, Murray G, … Allen NB (2017b). The SENSE Study: Treatment mechanisms of a cognitive behavioral and mindfulness-based group sleep improvement intervention for at-risk adolescents. Sleep, 1–11 [DOI] [PubMed]
- Breen, … Reynolds SM, Cox C, Jacobson LP, Magpantay L, Mulder CB, … Norris PJ (2011). Multisite comparison of high-sensitivity multiplex cytokine assays. Clinical and Vaccine Immunology, 18(8), 1229–1242 [DOI] [PMC free article] [PubMed] [Google Scholar]
- Byrne ML, O’Brien-Simpson NM, Reynolds EC, Walsh KA, Laughton K, Waloszek JM, … Allen NB (2013). Acute phase protein and cytokine levels in serum and saliva: A comparison of detectable levels and correlations in a depressed and healthy adolescent sample. Brain, Behavior, and Immunity, 34, 164–175 [DOI] [PubMed] [Google Scholar]
- Chaiton M, O’Loughlin J, Karp I, Lambert M (2010). Depressive symptoms and C- reactive protein are not associated in a population-based sample of adolescents. Int. J. Behav. Med, 17, 216–222 [DOI] [PubMed] [Google Scholar]
- Cohen J (1983). The cost of dichotomization. Applied psychological measurement, 7(3), 249–253 [Google Scholar]
- Cox KL, Devanarayan V, Kriauciunas A, Manetta J, Montrose C, Sittampalam S, (2012). Immunoassay Methods, in: Sittampalam GS, Coussens NP, Nelson H, et al. , (Eds.), Assay guidance manual Bethesda (MD: ): Eli Lilly & company and the National Center for Advancing Translational Sciences, pp. 26–28 [Google Scholar]
- Cullen AE, Tappin BM, Zunszain PA, Dickson H, Roberts RE, Nikkheslat N…Laurens KR> (2017). The relationship between salivary C-reactive protein and cognitive function in children aged 11–14 years: Does psychopathology have a moderating effect? Brain, Behavior, and Immunity, 66, 221–229. 10.1016/j.bbi.2017.07.002 [DOI] [PMC free article] [PubMed] [Google Scholar]
- Danner M, Kasl SV, Abramson JL, & Vaccarino V (2003). Association Between Depression and Elevated C-Reactive Protein. Psychosomatic Medicine, 65(3), 347–356 [DOI] [PubMed] [Google Scholar]
- Delany FM, Byrne ML, Whittle S, Simmons JG, Olsson, … Mundy LK, … Allen NB (2016). Depression, immune function, and early adrenarche in children. Psychoneuroendocrinology, 63, 228–234 [DOI] [PubMed] [Google Scholar]
- Epel E, Lapidus R, McEwen B, & Brownell K (2001). Stress may add bite to appetite in women: A laboratory study of stress-induced cortisol and eating behavior. Psychoneuroendocrinology, 26(1), 37–49 [DOI] [PubMed] [Google Scholar]
- Findley JWA & Dillart RF (2007). Appropriate Calibration Curve Fitting in Ligand Binding The AAPS Journal,9(2)Article 29 [DOI] [PMC free article] [PubMed] [Google Scholar]
- Goodson JM, Kantarci A, Hartman ML, Denis GV, Stephens D, Hasturk H, … Welty F (2014). Metabolic disease risk in children by salivary biomarker analysis. PLoS ONE, 9(6) [DOI] [PMC free article] [PubMed] [Google Scholar]
- Haran J, Gardiner F, & Suner S (2012). Correlation of C-reactive protein to severity of symptoms in acute influenza infection. Journal of Emergencies, Trauma, and Shock, 5(2), 149. [DOI] [PMC free article] [PubMed] [Google Scholar]
- Horn SR, Long MM, Nelson BW, Allen N, Fisher PA, & Byrne ML (2018). Replication and reproducibility issues in the relationship between C-reactive protein and depression: A systematic review and focused meta-analysis. Brain, Behavior, and Immunity (ahead of print). 10.1016/j.bbi.2018.06.016. [DOI] [PMC free article] [PubMed] [Google Scholar]
- Howren MB, Lamkin DM, Suls J (2009). Associations of depression with C-reactive protein, IL-1, and IL-6: A meta-analysis. Psychosomatic Medicine, 71, 171–186. [DOI] [PubMed] [Google Scholar]
- Izawa S, Miki K, Liu X, & Ogawa N (2013). Brain, Behavior, and Immunity The diurnal patterns of salivary interleukin-6 and C-reactive protein in healthy young adults. Brain Behavior and Immunity, 27, 38–41. 10.1016/j.bbi.2012.07.001 [DOI] [PubMed] [Google Scholar]
- Kifude CM, Rajasekariah HG, Sullivan DJ, Stewart VA, Angov E, Martin SK, … Waitumbi JN (2008). Enzyme-linked immunosorbent assay for detection of Plasmodium falciparum histidine-rich protein 2 in blood, plasma, and serum. Clinical and Vaccine Immunology, 15(6), 1012–1018 protein levels over 24 hours in patients with stable coronary artery disease. Texas Heart nstitute Journal, 37(1), 42–8 [DOI] [PMC free article] [PubMed] [Google Scholar]
- Koc M, Karaarslan O, Abali G, & Batur K.(2010).Variation in high-sensitivity Creactive 10.2307/2290157 [DOI] [PMC free article] [PubMed] [Google Scholar]
- Kraemer HC, Giese-Davis J, Yutsis M, O’Hara, … Neri E, Gallagher-Thompson D, … Spiegel D (2006). Design Decisions to Optimize Reliability of Daytime Cortisol Slopes in an Older Population. The American Journal of Geriatric Psychiatry, 14(4), 325–333 [DOI] [PubMed] [Google Scholar]
- Little RJA (1988). A Test of Missing Completely at Random for Multivariate Data with Missing Values A Test of Missing Completely at Random for Multivariate Data With Missing Values. Journal of the American Statistical Association, 83(404), 1198–1202. [Google Scholar]
- Lubin JH, Colt JS, Camann D, Davis S, Cerhan JR, Severson RK, … Hartge P (2004). Epidemiologic evaluation of measurement data in the presence of detection limits. Environmental Health erspectives, 112(17), 1691–1696. 10.1289/ehp.7199 [DOI] [PMC free article] [PubMed] [Google Scholar]
- Lucas T, Lumley MA, Flack JM, Wegner R, Pierce J, & Goetz S (2016). A preliminary experimental examination of worldview verification, perceived racism, and stress reactivity in African Americans. Health Psychology, 35(4), 366–375 [DOI] [PMC free article] [PubMed] [Google Scholar]
- MacCallum R., Zhang S, Preacher KJ, & Rucker DD (2002). On the practice of dichotomization of quantitative variables. Psychol Methods, 7(1), 19–40 [DOI] [PubMed] [Google Scholar]
- Megson E, Fitzsimmons T, Dharmapatni K, & Mark Bartold P (2010). C-reactive protein in gingival crevicular fluid may be indicative of systemic inflammation. Journal of Clinical Periodontology, 37(9), 797–804 [DOI] [PubMed] [Google Scholar]
- Meier-Ewert HK, Ridker PM, Rifai N, Price N, Dinges DF, & Mullington JM (2001). Absence of diurnal variation of C-reactive protein concentrations in healthy human subjects. Clinical Chemistry, 47(3), 426–430 [PubMed] [Google Scholar]
- Miller GE & Cole SW (2012). Clustering of depression and inflammation in adolescents previously exposed to childhood adversity. Biological Psychiatry, 72(1), 34–40 [DOI] [PMC free article] [PubMed] [Google Scholar]
- Naidoo T, Konkol K, Biccard B, Dubose K, & McKune A. (2012). Elevated salivary C-reactive protein predicted by low cardio-respiratory fitness and being overweight in African children : cardiovascular topic. Cardiovascular Journal Of Africa, 23(9), 501–506 [DOI] [PMC free article] [PubMed] [Google Scholar]
- Nix B & Wild D (2005). Calibration Curve-fitting. In: Wild D. ed. The Immunoassay Handbook Oxford, UK. Elsevier Ltd, pp. 233–245 [Google Scholar]
- O’Brien SM, Scott LV, & Dinan TG (2006). Antidepressant therapy and C-reactive protein levels. The British Journal of Psychiatry, 188(5), 449–452 [DOI] [PubMed] [Google Scholar]
- Out D, Hall RJ, Granger DA, Page GG, & Woods SJ (2012). Assessing salivary C-reactive protein: Longitudinal associations with systemic inflammation and cardiovascular disease risk in women exposed to intimate partner violence. Brain, Behavior, and Immunity, 26(4), 543–551 [DOI] [PMC free article] [PubMed] [Google Scholar]
- Park H, Tsai KM, Dahl RE, Irwin MR, Creath H, Seeman E, & Fuligni AJ (2016). Sleep and Inflammation During Adolescence. Psychosomatic Medicine, 78(6), 677–685 [DOI] [PMC free article] [PubMed] [Google Scholar]
- Patel N, Belcher J, Thorpe G, Forsyth NR, & Spiteri MA (2015). Measurement of C-reactive protein, procalcitonin and neutrophil elastase in saliva of COPD patients and healthy controls: correlation to self-reported wellbeing parameters. Respiratory Research, 16(1), 62. [DOI] [PMC free article] [PubMed] [Google Scholar]
- Pearson TA, Mensah GA, Alexander RW, Anderson JL, Cannon I, Richard O, Criqui M, Fadl YY, Fortmann SP, Hong Y, Myers GL, Rifai N, Smith SCJ, Taubert K, Tracy R ., & Vinicor F (2003). Markers of inflammation and cardiovascular disease. Circulation, 107, 499–511 [DOI] [PubMed] [Google Scholar]
- Posthouwer D, Voorbij HM, Grobbee DE, Numans ME, & Van Der Bom JG (2004). Influenza and pneumococcal vaccination as a model to assess C-reactive protein response to mild inflammation. Vaccine, 23(3), 362–365 [DOI] [PubMed] [Google Scholar]
- Prasad K (2006). C-reactive protein (CRP)-lowering agents. Cardiovascular Drug Reviews, 24(1),33–50 [DOI] [PubMed] [Google Scholar]
- R Development Core Team (2017). R: A language and environment for statistical computing R Foundation for Statistical Computing, Vienna, Austria: ISBN 3–900051-07–0, URL http://www.R-project.org. [Google Scholar]
- Revelle W (2017). psych: Procedures for Personality and Psychological Research, Northwestern University, Evanston, Illinois, USA, https://CRAN.R-project.org/package=psychVersion=1.7.5 [Google Scholar]
- Ridker PM (2003). Clinical application of C-reactive protein for cardiovascular disease detection and prevention. Circulation, 107(3), 363–369 [DOI] [PubMed] [Google Scholar]
- Robitzsch A, Grund S, & Henke T (2017). TAM: Some additional multiple imputation functions, especially for mice. R package version 2.5–9 https://CRAN.R-project.org/package=miceadds
- Rosenfield RL, Cooke DW, & Radovick,. (2008). Puberty and its Disorders in the female. In Pediatric Endocrinology (pp. 530–609). Elsevier Inc. [Google Scholar]
- Schlaudecker EP, Steinhoff MC, Omer SB, McNeal, … Roy E, Arifeen SE, … Zaman K (2013). IgA and Neutralizing Antibodies to Influenza A Virus in Human Milk: A Randomized Trial of Antenatal Influenza Immunization. PLoS ONE, 8(8), 6–13 [DOI] [PMC free article] [PubMed] [Google Scholar]
- Slavich GM, Way BM, Eisenberger NI, & Taylor SE (2010). Neural sensitivity to social rejection is associated with inflammatory responses to social stress. Proceedings of the National Academy of Sciences, 107(33), 14817–14822 [DOI] [PMC free article] [PubMed] [Google Scholar]
- Tabachnick BG, & Fidell L (2013). Using Multivariate Statistics, 6th ed. Boston: Pearson. [Google Scholar]
- Tajimi M, Uehara R, Watanabe M, Oki I, Ojima T, & Nakamura Y (2005). Correlation coefficients between the dioxin levels in mother’s milk and the distances to the nearest waste incinerator which was the largest source of dioxins from each mother’s place of residence in Tokyo, Japan. Chemosphere, 61(9), 1256–1262 [DOI] [PubMed] [Google Scholar]
- Tsai MY, Hanson NQ, Straka RJ, Hoke TR, Ordovas JM, Peacock JM, … Arnett DK (2005). Effect of influenza vaccine on markers of inflammation and lipid profile. Journal of Laboratory and Clinical Medicine, 145(6), 323–327 [DOI] [PubMed] [Google Scholar]
- van Buuren S & Groothius-Oudshoorn K (2011). mice: Multivariate imputation by chained equations in R. Journal of Statistical Software, 45(3), 1–67 [Google Scholar]
- Visser M, Mcquillan GM, Wener MH, & Harris TB (1999). Elevated C-Reactive Protein Levels [DOI] [PubMed]
- Waloszek JM, Schwartz O, Simmons JG, Blake M, Blake L, Murray G, … Allen NB (2015). The SENSE Study (Sleep and Education: learning New Skills Early): a community cognitive behavioural therapy and mindfulness-based sleep intervention to prevent depression and improve cardiac health in adolescence. BMC Psychology, 3(1),39. [DOI] [PMC free article] [PubMed] [Google Scholar]
- Wickham H (2009). ggplot2: Elegant Graphics for Data Analysis Springer-Verlag; New York [Google Scholar]
- Woloshin S & Schwartz LM (2005). Distribution of C-reactive protein values in the United States. New Eng. J. Med, 352, 1611–1613. [DOI] [PubMed] [Google Scholar]
Associated Data
This section collects any data citations, data availability statements, or supplementary materials included in this article.