

Abstract
Background
The Resource‐Based Relative Value Scale Update Committee (RUC) submits recommended reimbursement values for physician work (wRVUs) under Medicare Part B. The RUC includes rotating representatives from medical specialties.
Objective
To identify changes in physician reimbursements associated with RUC rotating seat representation.
Data Sources
Relative Value Scale Update Committee members 1994–2013; Medicare Part B Relative Value Scale 1994–2013; Physician/Supplier Procedure Summary Master File 2007; Part B National Summary Data File 2000–2011.
Study Design
I match service and procedure codes to specialties using 2007 Medicare billing data. Subsequently, I model wRVUs as a function of RUC rotating committee representation and level of code specialization.
Principal Findings
An annual RUC rotating seat membership is associated with a statistically significant 3–5 percent increase in Medicare expenditures for codes billed to that specialty. For codes that are performed by a small number of physicians, the association between reimbursement and rotating subspecialty representation is positive, 0.177 (SE = 0.024). For codes that are performed by a large number of physicians, the association is negative, −0.183 (SE = 0.026).
Conclusions
Rotating representation on the RUC is correlated with overall reimbursement rates. The resulting differential changes may exacerbate existing reimbursement discrepancies between generalist and specialist practitioners.
Keywords: Health policy, payment systems, RBRVS, Medicare
Since 1992, the Resource‐Based Relative Value Scale (RBRVS) has been the basis fee schedule to determine reimbursement amounts paid for physician and clinical services under Medicare Part B. The RBRVS was intended to generate more unbiased assessments of physician work compared to the fee‐for‐service system it replaced (Robinson 2001). However, the RBRVS process has faced criticism for the implicit favor it gives to specialists over primary care physicians (Schroeder and Sandy 1993; Bodenheimer, Berenson, and Rudolf 2007; Berenson and Goodson 2016).
Reimbursement levels of medical codes are defined by the RBRVS. Throughout, I will use the term “code” to refer to a service or procedure designated by an individual current procedure terminology (CPT) code. More specifically, the RBRVS divides compensation for service or procedure codes into three components: physician work, practice expenses, and malpractice liability insurance. The base unit of the scale is called a relative value unit (RVU), and Medicare payments are calculated by multiplying the sum of the RVUs for each component of a code, given in accordance with the scale, against a multiplier determined by the Centers for Medicare and Medicaid Services (CMS). Reimbursements are then further adjusted for geography by use of a geographic multiplier (Social Security Act: Payment for Physician Services. 2016). RVU values corresponding to individual components of this scale are termed work RVUs (wRVU), practice expense RVUs, and malpractice expense RVUs, and their sum is denominated as total RVUs.
Physician wRVUs are subject to a process of physician survey and subsequent committee review. wRVUs are meant to incorporate measures of the time required to perform a service, the mental effort required, the physical effort required, and the psychological stress of the service as measured using a national survey. The process by which CMS annually updates work wRVUs for the RBRVS is as follows (Figure S1).
First, a code is nominated for review by either the CPT editorial panel or CMS. Nominated codes will receive input from to the RVS Update Committee (RUC), a committee composed of members of the American Medical Association (AMA). The RUC contracts the specialty society to which the code best pertains. The specialty society then performs a physician survey to determine the amount of work required by a given service or procedure and provides recommendations. The RUC can then decide whether to adopt the recommendations, refer the study back to the specialty society, or modify the recommendations before submission to CMS. In order to be submitted to CMS, a recommendation must be approved by a minimum of two‐thirds of sitting RUC members (American Medical Association 2013).
Although the majority of RUC seats have been allocated to representatives of national medical specialty societies, a minority of RUC seats have corresponded to primary care specialties. Following February 2012, the RUC consisted of 31 members, of which 24 were members were appointed by major national medical specialty societies. Of the seats allocated to 24 medical specialties, 20 seats were allocated to specialties on a permanent basis and four were rotating seats. That is, one permanent seat apiece was allocated to internal medicine, radiology, cardiology, anesthesia, orthopedic surgery, psychiatry, otolaryngology, and so on, and four seats are allocated to representatives of four distinct specialties not otherwise represented. Of these four rotating seats, two are reserved for internal medicine specialties such as allergy/immunology, endocrinology, gastroenterology, hematology, infectious disease, nephrology, oncology, pulmonary medicine, and rheumatology, and one is reserved for primary care. Prior to February 2012, the RUC was comprised of 29 total seats, 23 of which were appointed by major national medical societies. Of the 23 seats open to medical specialty society members, three of the seats rotated on a 2‐year basis.
Historically, the RUC recommendations have had a high rate of adoption by CMS. In a report from the AMA, the RUC has submitted recommendations annually since 1993 in addition to the 4–5‐year reviews. Of these, between 80 and 100 percent of the recommendations were accepted annually, with an average of 87.4 percent of recommendations accepted in any given year (Laugesen, Wada, and Chen 2012).
Some primary care physicians and physicians' groups have suggested that such disproportionate representation has contributed to a widening specialist and nonspecialist income gap (Bodenheimer and Pham 2010). The Department of Health and Human Services acknowledged this possibility in 2008, when it requested that the RUC renew its efforts to identify overvalued codes rather than undervalued codes as they had in the past (Centers for Medicare Medicaid Services 2013). However, the AMA has maintained that service on the RUC is an individual choice and that committee members “exercise their independent judgment” and “are not advocates for their specialty” (American Medical Association 2012).
The literature has offered different sources of evidence for establishing a link between RUC membership and reimbursement from individual accounts to aggregated reports with the majority focusing on time series analysis or differential growth rates across code types (e.g., evaluation and management codes vs. imaging or procedures) (McCall, Cromwell, and Braun 2006; Maxwell, Zuckerman, and Berenson 2007; Bodenheimer and Pham 2010; Laugesen, Wada, and Chen 2012; Laugesen 2016). Given the attention the issue has been given throughout the years and a setting in which variation exists in committee membership, the effects of rotating membership would seem a natural setting in which to study potential impacts of the RUC. A precedent for this type of study has been set in the political economy literature: For instance, Kuziemko and Werker use rotating seats on the U.N. security council to identify correlations between security council membership and receipt of U.N. aid (Kuziemko and Werker 2006). Indeed, the AMA states that in 2007, an internal investigation was conducted into whether rotating seat allocation impacted final RBRVS values and determined that no such effect existed. The study results have not been publicly available.
In this study, I investigate the relationship between rotating seat representation on RUC and Medicare reimbursement with respect to the number of physician specialties observed to bill a code. I refer to the number of physician specialties observed to be bill a code as an “inverse level of specialization,” where I term codes performed by a small number of physician specialties as “highly specialized” and codes performed by a large number of physician specialties as “less specialized.” This represents a deviation from the literature, which has hitherto focused on code type (e.g., evaluation and management, surgical or imaging) rather than degree of specialization. I do so because I wish focus on the statutory cap placed on the total amount that RVU changes may affect projected billing. The goal was to demonstrate how a relatively simple regulation may generate perverse incentives, which then may contribute to the differential increases observed in reimbursements across levels of specialization.
The Social Security Act requires that increases or decreases in RVUs may not cause the projected amount in expenditures under Part B for the subsequent year to differ more than $20 million from what it would have been in the absence of the changes (Social Security Act: Payment for Physician Services 2016). The implication of such a cap may be made clear by example. Imagine that each member of the 25 member committee represents a specialty that performs 1 million office visits annually. Imagine that in addition, the specialty also performs 1 million specialty procedures annually, which are unique to that specialty. Suppose that the cap on Medicare expenditure changes due to the fee schedule is $ 1 million annually. If both office visits and specialty procedure codes are nominated for review, it is in the specialist's interest to advocate that the $1 million is dedicated solely to the specialty procedure code: If the increase is applied to office visits, the reimbursement for the office visit increases only by 4 cents, but applied to the specialty procedure, it amounts to a $1 increase per procedure, which is completely internalized by the specialty. In total, the increase applied to office visits would be worth only $40,000 to the specialty, whereas the same increase applied to the specialty procedure would yield $1 million to the specialty. We may then anticipate that RUC membership should correlate with disproportionate increases in reimbursement to codes that are performed by a small number of physician specialties.
Methods
Data
Annual RBRVS values were compiled from the CMS website for the years 2003–2013. Additional RBRVS data were retrieved as revisions from the Federal Register for the years 1994–2003. Each code in the dataset is uniquely identified by its common procedure terminology (CPT) code and modifier. Because multiple revisions of the RBRVS were available from CMS for any given year of data, I use only the latest revision of RBRVS values for each year 1994–2013.
RUC members are listed on the acknowledgment page of Medicare RBRVS: The Physician's Guide, an annual publication of the AMA. Due to the 2007 AMA study, rotating seats for the RUC are available upon request from the AMA. I use the 2007 AMA study rotating specialties from years 1991 to 1998 and the RUC members listed in Medicare RBRVS: The Physician's Guide for years 1999 and onward (Medicare RBRVS : The Physicians' Guide. 1992). There are very few discrepancies between the two sources in the overlapping years.
The Physician/Supplier Procedure Summary Master File (PSPS) is a 100 percent summary of all Medicare Part B Carrier and Durable Medical Equipment Regional Carrier Claims. It includes carrier, pricing locality, health care common procedure coding (HCPC), or common procedural terminology (CPT) designations, totally submitted and allowed services and charges by specialty. I have access only to the PSPS file for the year 2007.
Part B National Summary Data File (BESS) is a publicly available file from the CMS website. It summarizes allowed services, charges, and payments by HCPC/CPT group. During the time of study, years 2000–2011 were available.
Independent Variables
Medicare designates 93 distinct specialist codes in the PSPS 2007 data, all of which were matched to at least one CPT code. I mark a specialty and a code as matched if the specialty is observed to bill for the code at least one time in the PSPS 2007. Due to constraints in training between specialties, it is reasonable to assume that the relative level of specialization for a given code should not vary substantially across time. If a specialty represented on the RUC did not have a corresponding Medicare billing code, no codes were designated as pertaining to that specialty. The inverse level of specialization for a given code is proxyed by the number of specialties observed to bill for that code in 2007. For example, the CPT code 27703 for reconstruction of the ankle joint is billed only by orthopedic surgeons and has an inverse level of specialization of 1 and is “highly specialized.” By contrast, the CPT code 99211 Office/outpatient visit established patient has an inverse level of specialization of 90 and is “less highly specialized.”
Subsequently, I use committee seat data to designate a dummy variable by code by year. Here, the dummy is marked as 1 if the code is matched to a specialty that was observed to have a RUC rotating seat for that year and 0 otherwise. Codes that could not be matched to any specialty were dropped from the data. This resulted in the loss of 814,297 observations.
Dependent Variables
The outcomes variable of interest in the main analysis is the number of wRVUs associated with each given code, denominated in relative value units. To approximate the aggregate effects of RUC rotating committee memberships on total Medicare payments, I use three dependent variables. The first, projected 2012 payment, is the product of total RVUs, conversion factor, service volume, and the inflation rate given by the Bureau of Labor Statistics. The second, the actual 2012 payments, is the product of observed payments by code and the inflation rate. The third, aggregated wRVUs billed, is the product of wRVUs and service volume for a given code. Because level values for each of these variables differ substantially, I present outcome variables as logs to facilitate cross‐comparison.
Within robustness checks, I use facility practice expense, nonfacility practice expense, malpractice RVUs as placebo specifications. Although the RUC has had input into valuation for each of these components, historically its influence has been relatively limited in comparison with its role in the establishment of wRVUs: Practice expense values were historically pegged to a geographically varying index of relative costs, and malpractice expenses were pegged to malpractice insurance premiums. The number of observations for practice expense RVUs differs from wRVU values because the initial RBRVS did not distinguish between facility and nonfacility practice expense RVUs.
In order to determine whether any effect is due to the code nomination process or to the RUC, I use an indicator for whether the work RVU value for any given year differs from that of the previous year. Of note, this is not necessarily equivalent to the codes reviewed in any given year, which is unobserved. Rather, changes in RVU value from year to year may be due in part to payment schedule changes or changes in date of data acquisition as is the case for the years 1996, 2002, 2006, and 2009. As a result, I run a robustness check to validate study findings are not the pure result of such data abnormalities.
Analyses
I construct independent variables for the number of specialties billing by code and RUC rotating seat representation by code by year as specified in the section above describing independent variables.
In Figure 1, I plot the results of a regression work RVUs onto the dummy variable indicating specialty occupation of a RUC rotating seat, a series of dummy variables indicative for each number of specialties billing from 1 to 59, and the interaction at each level of specialization with the RUC rotating seat variable, again with both year and code‐level fixed effects. Regression equations can be found in the Appendix S1. Due to collinearity, it was not possible to evaluate rotating seat‐associated effects for codes with a number of specialties billing >59 as the majority of such codes do not exhibit substantial variation by rotating seat. Figure 1 plots regression coefficients from these interaction terms of RUC rotating seat occupation and number of specialties billing on the y‐axis against number of specialties billing on the x‐axis. Bars indicate estimated standard errors.
Figure 1.

- Notes. Plotted circles represent the average effect size on wRVUs of RUC rotating seat membership among codes with a given level of specialization. They are plotted against the corresponding levels of specialization on the x‐axis. Because little rotating seat variation exists for codes billed by large numbers of specialties, estimates of rotating seat effects by code specialization could not be obtained for these codes. Thus, only effects for codes shared by a maximum of 59 specialties are reported. Bars indicate 95 percent confidence interval.
The series observed in Figure 1 is downward sloping; thus, there is a positive interaction effect between rotating seat membership and higher specialization. For the main analysis shown in Table 2, I choose to group codes by the number of specialties billing as roughly guided by the results from the initial regression shown in Figure 1. I choose the cutpoint of number of specialties billing equal to six as this was the median for my sample. Thus, the highly specialized code groups were defined as those having six or fewer specialties billing, and less highly specialized code group was defined as the remainder. I regressed work RVUs onto the dummy variable indicating specialty occupation of a RUC rotating seat, level of specialization group (i.e., highly specialized or less specialized), the interaction of the RUC rotating seat dummy and level of specialization, an indicator for each year of data in a fixed effects framework. In this model, work RVUs are demeaned by code to generate within‐code‐level estimates of effects. Degrees of freedom and statistical testing are adjusted accordingly. I present aggregated results by regressing log of projected 2012 payment and log of actual 2012 payments, and log aggregated work RVUs onto RUC rotating seat representation, year fixed effects, and code‐level fixed effects.
Table 2.
Average Effect of Rotating RUC Seat by Level of Specialization
| Variable | Work RVUs | Work RVUs | log (Projected Payments) | log (Actual Medicare Payments) | log (Aggregated work RVUs) |
|---|---|---|---|---|---|
| Code represented by RUC rotating seat | 0.028 (0.010)† | 0.177 (0.024)† | 0.050 (.006)† | 0.030 (.007)† | 0.049 (.005)† |
| Interaction with less specialized code | −0.183 (0.026)† | ||||
| Year | |||||
| 1995 | −0.023 (0.020) | −0.024 (0.020) | |||
| 1996 | 0.086 (0.019)† | 0.084 (0.019)† | |||
| 1997 | 0.398 (0.019)† | 0.398 (0.019)† | |||
| 1998 | 0.336 (0.021)† | 0.337 (0.021)† | |||
| 1999 | 0.379 (0.019)† | 0.382 (0.019)† | |||
| 2000 | 0.421 (0.019)† | 0.423 (0.019)† | |||
| 2001 | 0.592 (0.019)† | 0.594 (0.019)† | 0.009 (0.009) | 0.051 (0.011)† | 0.053 (0.009)† |
| 2002 | 0.595 (0.020)† | 0.597 (0.020)† | −0.032 (0.009)† | 0.087 (0.012)† | 0.094 (0.009)† |
| 2003 | 0.633 (0.019)† | 0.634 (0.019)† | 0.037 (0.009)† | 0.092 (0.011)† | 0.144 (0.008)† |
| 2004 | 0.635 (0.019)† | 0.636 (0.019)† | 0.014 (0.008) | 0.092 (0.011)† | 0.156 (0.008)† |
| 2005 | 0.643 (0.019)† | 0.644 (0.019)† | 0.010 (0.008) | 0.093 (0.011)† | 0.165 (0.008)† |
| 2006 | 0.659 (0.018)† | 0.660 (0.018)† | −0.044 (0.008)† | 0.050 (0.011)† | 0.142 (0.008)† |
| 2007 | 1.062 (0.018)† | 1.062 (0.018)† | −0.080 (0.009)† | −0.020 (0.011) | 0.176 (0.008)† |
| 2008 | 1.071 (0.018)† | 1.070 (0.018)† | −0.081 (0.008)† | −0.060 (0.011)† | 0.205 (0.008)† |
| 2009 | 1.069 (0.018)† | 1.069 (0.018)† | −0.092 (0.009)† | −0.008 (0.011) | 0.236 (0.008)† |
| 2010 | 1.122 (0.018)† | 1.122 (0.018)† | −0.062 (0.009)† | 0.001 (0.011) | 0.240 (0.008)† |
| 2011 | 1.127 (0.018)† | 1.127 (0.018)† | −0.079 (0.009)† | 0.002 (0.011) | 0.240 (0.008)† |
| 2012 | 1.159 (0.018)† | 1.161 (0.018)† | |||
Columns headers give the dependent variable of each regression. Projected payments are the product of total RVUs, conversion factor, service volume, and the inflation rate given by the Bureau of Labor Statistics. Actual payment is the product of observed code payments and the inflation rate. Aggregated work RVUs are the product of wRVUs and Service Volume for a given code. Interaction with less specialized code indicates the interaction effect of RUC rotating seat membership and a dummy variable indicating the code is billed by >6 specialties in 2007 Medicare. All regressions are linear and include year indicators (shown) and code‐level fixed effects. Standard errors displayed in parentheses.
† Wald test was significant at the at the 5% level.
I conduct robustness checks accounting for data inconsistencies, as well as exercises in mechanistic confirmation using the same specification as for the main analysis. These robustness checks are displayed in Table 3. Robustness checks are as follows: main specification excluding data from abnormal years (classified as above), demonstration of robustness to grouping specification using cutoffs at levels of specialization at the 25th and 75th percentiles rather than the median, clustered standard errors at the code‐level and code‐type level, removal of code‐level fixed effects using first‐differencing rather than fixed effects, placebo regressions using practice expense and malpractice RVUs as outcomes of regression, and falsification test of predicting any change in wRVU value. Code type is the seven‐level CPT classification of anesthesia, evaluation and management, medicine, pathology/laboratory, radiology, or surgery assigned to the code by CMS.
Table 3.
Robustness Checks
| Outcome Variable | Code Represented by a RUC Rotating Seat | Interaction with Less Specialized Code | Model | N |
|---|---|---|---|---|
| (1) wRVUs, excluding abnormal years | 0.209 (.027)† | −0.180 (0.030)† | FE | 186,108 |
| (2) wRVUs, less specialized code defined as # specialties billing >2 (25th percentile) | 0.139 (0.060)† | −0.115 (0.061)‡ | FE | 234,027 |
| (3) wRVUs, less specialized code defined as # specialties billing >18 (75th percentile) | 0.083 (0.012)† | −0.173 (0.021)† | FE | 234,027 |
| (4) wRVUs, clustered standard errors by CPT | 0.177 (0.039)† | −0.183 (0.011)† | FE | 234,027 |
| (5) wRVUs, clustered standard errors by type | 0.184 (0.024)† | −0.181 (0.005)† | FE | 185,070 |
| (6) wRVUs, first differences | 0.106 (0.023)† | −0.135 (0.023)† | FD | 209,449 |
| (7) facility practice RVUs | −0.170 (0.036)† | 0.250 (0.040)† | FE | 223,085 |
| (8) nonfacility practice RVUs | −0.060 (0.048) | 0.194 (0.053)† | FE | 223,372 |
| (9) malpractice RVUs | 0.137 (0.023)† | −0.142 (0.025)† | FE | 234,025 |
| (10) observed wRVU value differs from previous year value, linear | −0.039 (0.004)† | 0.0183 (0.004)† | FE | 234,027 |
All regressions include year dummies. Interaction with less specialized codes denotes the interaction of rotating seat representation and an indicator for codes with the number of specialties billing >6 unless otherwise specified. Observed wRVU value differs from previous year value is a binary outcome variable for this outcome. Abnormal years defined as 1996, 2002, 2006, and 2009. Clustered standard errors by CPT are the same as HCPC and modifier. Clustered standard errors by type are the Medicare category classifications of CPT code. The classification categories are anesthesia, evaluation and management, medicine, pathology/laboratory, radiology, and surgery.
† Wald test was significant at the at the 5% level.
‡ Wald test was significant at the 10% level.
In addition to the aforementioned approach, I use an event study to confirm that some of the timing for increases corresponds to years of committee membership rather than general increases to specialty‐associated codes over time. Here, I regress wRVUs on a series of lagged dependent variables ranging from 4 years prior to the first year of rotating seat occupation to 4 years after the first year of rotating seat occupation separately for both specialized and less specialized codes where levels of specialization groups are defined as for the main analysis. Regressions contain code‐level and year‐level fixed effects. Specialties often repeat membership (shown in Table S1); thus, a given year may be double marked. For example, if geriatrics occupies a RUC seat in years t and t + 1, and then again in years t + 4 and t + 5, then both years t and t + 4 will be marked as the first year of membership, and t + 2 will be marked both as 2 years following membership and 2 years before membership.
Specific empiric model specifications for all models discussed herein can be accessed in the Appendix S1.
Results
Descriptive statistics at the code‐year level are summarized in Table 1 for the variables wRVUs, number of specialties billing, and rotating seat representation including means, and standard deviation. Codes that could not be matched to specialty were dropped; thus, this table displays only the average values within remaining codes in the dataset. As anticipated, there is significant variation in wRVUs between different codes, with less variation within any given code over time. The average code in the sample has 12.7 specialties billing. Billing by a rotating seat specialty is observed for 28 percent of the sample. For comparison, I also report the percent of the sample identified as being billed for a permanent seat specialty.
Table 1.
Distributional Summary of Codes by RVU Component, Payments, RUC Representation, and Code Type
| Mean | Overall SD | SD Due to Differences between Codes | SD Due to Differences Within‐Code across Years | Number of Obs | |
|---|---|---|---|---|---|
| Distribution of RVU components | |||||
| Number of work RVUs | 4.75 | 8.36 | 7.53 | 1.37 | 234,027 |
| Facility practice RVUs | 3.68 | 5.8 | 5.28 | 1.97 | 223,085 |
| Nonfacility practice RVUs | 3.97 | 6.94 | 8.73 | 2.62 | 223,372 |
| Malpractice RVUs | 0.84 | 2.13 | 1.4 | 1.51 | 234,025 |
| Distribution of payments projections | |||||
| Projected payments by code from total RVUs | 8,844,740 | 1.01 × 10⁸ | – | – | 89,468 |
| Total Medicare payments by code | 7,434,888 | 8.40 × 10⁷ | – | – | 93,555 |
| Number of total work RVUs billed | 114,694 | 1.64 × 10⁶ | – | – | 90,942 |
| Distribution of RUC representation | |||||
| Number of specialties billing a code in 2007 | 12.66 | 16.21 | – | – | 234,027 |
| Percent of codes represented by a RUC rotating seat | 28% | 45% | – | – | 234,027 |
| Percent of codes represented by a RUC permanent seat | 79% | 41% | – | – | 234,027 |
| Percent of codes with a work RVU change from the year previous | 15% | 36% | – | – | 234,027 |
| Distribution of code types | |||||
| Percent of codes classed as anesthesia | 1% | 9% | – | – | 185,070 |
| Percent of codes classed as evaluation and management | 1% | 12% | – | – | 185,070 |
| Percent of codes classed as medicine | 13% | 33% | – | – | 185,070 |
| Percent of codes classed as pathology or laboratory | 12% | 32% | – | – | 185,070 |
| Percent of codes classed as radiology | 20% | 40% | – | – | 185,070 |
| Percent of codes classed as surgery | 53% | 50% | – | – | 185,070 |
Because we cannot expect that the effect of rotating seat occupancy will be the same for highly specialized and less specialized codes, I display the effect size by number of specialties billing in Figure 1. I find that the effect of rotating seat representation on average reimbursements seems to decline with increasing numbers of specialties billing. That is, the more specialized a code, the higher associated change corresponding to RUC representation. Moreover, I find that for highly specialized codes, the association between RUC rotating seat representation and wRVU is positive. Conversely, for less specialized codes, the association between RUC rotating seat representation and wRVU is negative.
Table 2 displays the average effects of rotating seat occupancy on corresponding code wRVUs as well as back‐of‐the‐envelope projected payments. In a code‐level fixed effects specification where wRVUs are regressed onto RUC rotating seat representation and year fixed effects, we can see a small overall increase associated with RUC rotating seat membership 0.028 (SE = 0.010). When I decompose this measure into that derived from highly specialized versus less specialized codes, one may see that the result in the former column is driven disproportionately by increases to highly specialized codes 0.177 (SE = 0.024) and controlling for average year on year increases, less specialized codes actually decline in value with associated RUC rotating seat representation −0.183 (SE = 0.026).
The following three columns in Table 2 should be interpreted as back‐of‐the‐envelope calculations giving aggregated RUC rotating seat effects on spending. Because outcomes are given in log values, regression coefficients may be interpreted as percentages. RUC rotating seat membership corresponds to an average 5.0 percent (SE = 0.6 percent) increase in naïvely computed projected payments, 3.0 percent (SE = 0.7 percent) increase in observed Medicare payments, and a 4.9 percent (SE = 0.5 percent) increase in the aggregate number of wRVUs billed.
In Figure 2, I display the results of the event study. For highly specialized codes, the pre‐RUC membership trend is downwards; however, a discontinuous increase can be observed with a timing corresponding to the beginning in the first year of RUC membership. This pattern is not observed in the sample restricted to less specialized codes.
Figure 2.
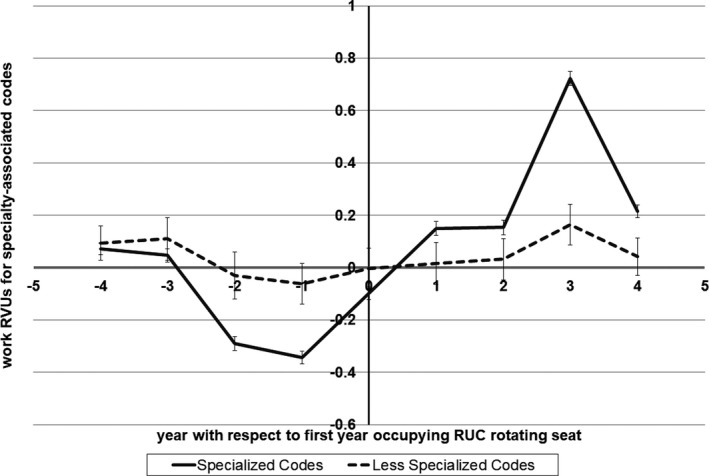
- Notes. The solid line displays the effect on work RVUs for codes for which six or fewer specialties bill. The dashed line displays the effect on work RVUs for codes for which greater than six specialties bill. The zero line on the x‐axis represents the first year of that specialty's term in a RUC rotating seat. Points −4, −3, −2, and −1 on the x‐axis denote the years 4, 3, 2, and 1 year before RUC membership begins, respectively. 1, 2, 3, and 4 are equal to one in the first, second, third, and fourth years following the first‐year term in a RUC rotating seat. 95 percent confidence intervals are given by the error bars.
Robustness checks are displayed in Table 3. Results were robust to numerous specifications. Placebo regressions using facility practice RVUs, nonfacility practice RVUs, and malpractice RVUs are available. Facility practice and nonfacility practice RVUs do not exhibit the same pattern of increases reflected in wRVUs. For facility practice RVUs, RUC representation for highly specialized codes was associated with −0.170 (SE = 0.036) RVUs, and for nonfacility practice RVUs, RUC representation for highly specialized codes was associated with −0.060 (SE = 0.048) RVUs. Malpractice RVUs exhibit a similar pattern of increases in RVUs with estimated correlation 0.137 (SE = 0.023) and −0.142 (SE = 0.025) for highly and less specialized codes, respectively. Regression with an outcome of any observed change in wRVU value was conducted and found that there is a negative association between RUC rotating seat membership and observing a change in the wRVU value for highly specialized codes −0.039 (SE = 0.004) and positive association between RUC rotating seat membership and observing a change in the wRVU value for less specialized codes 0.0183 (SE = 0.004).
Discussion
Since the adoption of the RBRVS, CMS have faced the problem of how to value physician work. As such, they have relied on an advisory committee of which the majority of members are medical specialists. This analysis provides both quantification of these effects and their distributional impact using a plausibly exogenous source of variation. This study is able to suggest that some proportion of changes are specifically correlated to committee membership rather than due solely to global payment schedule changes related, for instance, to technological changes alone.
I find a positive association between code‐level reimbursement values and specialty committee representation for highly specialized codes, which occur at the expense of reimbursement for less specialized codes. Increases correlate with years of committee membership and are not consistently observed in other reimbursement components for which historically there have been caps on the extent of committee action, that is, practice expense components. Malpractice RVUs, which are computed from malpractice insurance rates, do exhibit an associated change in correspondence to RUC rotating membership; however, to the extent that insurance rates could be tiered by RVUs generated, malpractice RVUs may respond to wRVUs changes.
There does not seem to be a correspondence between likelihood of code valuation change and committee membership. This suggests that the increases in specialty‐relevant code reimbursements associated with rotating seat occupancy are a consequence of the RUC rather than as a submission bias on the part of CMS or the CPT editorial panel.
In terms of discussion of the event study, it is necessary to note that due to repeated recycling of the same rotating subspecialties on the RUC, it is difficult to independently estimate the particular effects for each year in the cycle. For instance, the reader should interpret the large average increase in wRVUs observed in the third‐year postmembership as implicitly combined with the first‐year premembership results as, due to the predominance of 2‐year terms, these years are often tagged together. Nevertheless, the event study results are informative. First, they demonstrate that over time there is an increase in the overall level of reimbursement. Second, they demonstrate that this effect is concentrated in highly specialized codes; thus, decreases in the value of less specialized codes in the main specification may be occurring as a consequence of failure to increase the value of these codes in correspondence with year‐over‐year changes rather than the initiation of purposeful decreases. Third, it demonstrates that, for codes associated with RUC rotating seats, positive changes in the valuation of associated codes are timed with RUC membership and that the effect is sustained. This means that after a rotating member loses his seat, the work value for specialty‐related codes remains high and other rotating seat members do not actively lower wRVUs for nonspecialty‐associated codes in representative absence.
Overall, these changes represent on average a 3–5 percent increase in Medicare specialty reimbursement per year of committee membership. As an example of implicit scale, according to the PSPS in 2007, Medicare paid $1.5 billion to gastroenterology. Thus, a three percent annual increase would represent a $45 million increase in Medicare annual payments to gastroenterologists as a result of a single year of RUC membership.
Several additional limitations of this study are as follows. I am limited by restricted data access. During the 2007 internal review of specialty participation on the RUC, the AMA noted that no significant distributive outcomes were found from voting records. I am able to roughly replicate the results of this review in my initial analysis using publicly available data; however, the inability to observe votes somewhat limits my ability to discriminate the mechanism for any RUC‐associated increases. Additionally, it is not possible to provide an estimate for the larger part of the RUC composition because it is composed of permanent representation. Because this study looks only at within variation for codes matched to specialties in the year 2007, it is not able to comment on the extent to which committee composition may have an effect between codes or in the introduction of new codes.
Nevertheless, these findings are important for health care regulation. The short‐term marginal increases reported here cannot explain the growth in the income gap between general practitioners and specialists, nor should they be expected to. Physician income is driven by a variety of factors related or unrelated to within‐code price effects. However, these findings suggest that the current procedural evaluation process may be biased toward the perpetuation of higher specialty reimbursement shares of overall health expenditures. As such, the current committee dynamic has the possibility to exacerbate existing disparities, which occur to the detriment of aims to increase the supply ratio of primary care physicians to specialists.
Changes in RUC composition have already been made. However, given the current cap in overall spending, it is difficult to imagine a context in which committee incentives would align to give generalists a bureaucratic advantage. One possibility is to consider less specialized codes, or codes of particular concern by some other metric (e.g., evaluation and management codes), as separate from highly specialized codes and then subject such codes to a segregated pool of spending. This would enable more targeted control of reimbursement growth in given categories while acknowledging the essential differences that exist between types of services and procedures.
A larger issue at stake is how to assess physician work overall. Like fee‐for‐service, the RBRVS implies reimbursement should be coupled with marginal costs. In the context of an increasing emphasis on accountable care, future physician payments may be tied instead to marginal patient benefit. Systemic reorganization of physician reimbursement may constitute an opportunity to create an improved balance between specialty expenditure shares; however, it is no guarantee. For one, specialty and nonspecialty care often have different aims and different measurable outcomes for patients within the short, medium, and long terms. While treatment of an illness may constitute a discrete measure, prevention of one is worthwhile, but often more difficult to quantify. It may be necessary to recognize that specialists and nonspecialists function differently within the context of modern medical care and it may similarly be reasonable to formulate accountable reimbursements separately with these differences in mind.
Supporting information
Figure S1. Resource‐Based Relative Value Scale Revision Process Summary.
Table S1. RVS Update Committee Rotating Specialty Seat Occupation by Year.
Appendix S1: Empirical Specification.
Acknowledgments
Joint Acknowledgment/Disclosure Statement: The author would like to thank Christopher Berry, Robert Lalonde, Pablo Montagnes, David Meltzer, Damon Jones, Dan Black, and the workshop participants at the Harris School of Policy for their helpful comments and conversations. The author gratefully acknowledges financial support from National Institutes of Health TL1 linked training award and National Research Service Award T32 grant.
Disclosures: None.
Disclaimer: None.
References
- American Medical Association . 1992. Medicare RBRVS : The Physicians' Guide. Chicago, IL: American Medical Association. [Google Scholar]
- American Medical Association . 2012. “What the RUC Is & Is Not” [accessed on April 1, 2014]. Available at http://www.ama-assn.org/resources/doc/rbrvs/ruc-is-ruc-is-not.pdf
- American Medical Association . 2013. “AMA/Specialty Society RVS Update Process” [accessed on June 8, 2014].
- Berenson, R. A. , and Goodson J. D.. 2016. “Finding Value in Unexpected Places — Fixing the Medicare Physician Fee Schedule.” New England Journal of Medicine 374 (14): 1306–9. [DOI] [PubMed] [Google Scholar]
- Bodenheimer, T. , Berenson R. A., and Rudolf P.. 2007. “The Primary Care‐Specialty Income Gap: Why It Matters.” Annals of Internal Medicine 146 (4): 301–6. [DOI] [PubMed] [Google Scholar]
- Bodenheimer, T. , and Pham H. H.. 2010. “Primary Care: Current Problems and Proposed Solutions.” Health Affairs (Project Hope) 29 (5): 799–805. [DOI] [PubMed] [Google Scholar]
- Centers for Medicare Medicaid Services . 2013. “2008‐06‐30” [accessed April 1, 2014]. Available at https://www.cms.gov/Newsroom/MediaReleaseDatabase/Fact-sheets/2008-Fact-sheets-items/2008-06-30.html
- Kuziemko, I. , and Werker E.. 2006. “How Much Is a Seat on the Security Council Worth? Foreign Aid and Bribery at the United Nations.” Journal of Political Economy 114 (5): 905–30. [Google Scholar]
- Laugesen, M. 2016. Fixing Medical Prices. Cambridge, MA: Harvard University Press. [Google Scholar]
- Laugesen, M. J. , Wada R., and Chen E. M.. 2012. “In Setting Doctors' Medicare Fees, CMS Almost Always Accepts the Relative Value Update Panel's Advice on Work Values.” Health Affairs 31 (5): 965–72. [DOI] [PMC free article] [PubMed] [Google Scholar]
- Maxwell, S. , Zuckerman S., and Berenson R. A.. 2007. “Use of Physicians' Services under Medicare's Resource‐Based Payments.” New England Journal of Medicine 356 (18): 1853–61. 10.1056/NEJMsa063258. [DOI] [PubMed] [Google Scholar]
- McCall, N. , Cromwell J., and Braun P.. 2006. “Validation of Physician Survey Estimates of Surgical Time Using Operating Room Logs.” Medical Care Research and Review 63 (6): 764–77. [DOI] [PubMed] [Google Scholar]
- Robinson, J. C. 2001. “Theory and Practice in the Design of Physician Payment Incentives.” Milbank Quarterly 79 (2): 149–77. [DOI] [PMC free article] [PubMed] [Google Scholar]
- Schroeder, S. A. , and Sandy L. G.. 1993. “Specialty Distribution of U.S. Physicians – The Invisible Driver of Health Care Costs.” New England Journal of Medicine 328 (13): 961–2. [DOI] [PubMed] [Google Scholar]
- Social Security Act: Payment for Physician Services . 2016. “United States Code. Vol. Title 18” [accessed October 31, 2016]. Available at https://www.ssa.gov/OP_Home/ssact/title18/1848.htm
Associated Data
This section collects any data citations, data availability statements, or supplementary materials included in this article.
Supplementary Materials
Figure S1. Resource‐Based Relative Value Scale Revision Process Summary.
Table S1. RVS Update Committee Rotating Specialty Seat Occupation by Year.
Appendix S1: Empirical Specification.