

Abstract
Objective
To determine patterns of mental health service use before and after VA disability compensation awards for posttraumatic stress disorder (PTSD).
Data Sources
A 10 percent random sample of VHA‐enrolled Veterans with new or increased PTSD service connection between 2012 and 2014 (n = 22,249).
Study Design
We used latent trajectory analysis to identify utilization patterns and multinomial logistic regression to assess associations between Veteran characteristics and trajectory membership.
Data Extraction Methods
We assessed receipt of VHA mental health encounters in each of the 52 weeks prior to and following PTSD disability rating or rating increase.
Principal Findings
The best fitting model had five groups: No Use (36.6 percent), Low Use (37.7 percent), Increasing Use (9.4 percent), Decreasing Use (11.2 percent), and High Use (5.1 percent). Adjusting for demographic characteristics and compared with the No Use group, Veterans in the other groups were more likely to reside closer to a VHA facility, receive a higher PTSD disability rating, and screen positive for military sexual trauma.
Conclusions
Service use remained stable (80 percent) or increased (9 percent) for the vast majority of Veterans. Service utilization declined for only 11 percent. Data did not indicate substantial service discontinuation following rating. Low VHA service utilization suggests opportunities to enhance outreach for Veterans with PTSD‐related disability benefits.
Keywords: Veteran, Veterans Affairs, posttraumatic stress disorder, compensation, service connection
The Veterans Benefits Administration (VBA) operates a disability program called the Service‐Connected Disability Compensation program that provides tax‐free monthly benefits to Veterans for disabilities that were incurred or aggravated during military service (VBA 2016). Depending on level of disability, these benefits may include a monthly stipend, priority enrollment in the Veterans Health Administration (VHA), free or reduced cost health care in VHA, payment for travel to receive care for service‐connected conditions, long‐term care services, access to vocational rehabilitation, life insurance, survivor benefits, and educational and health insurance benefits for family members (VA 2016).
In 2015, the Veterans Benefits Administration provided benefits to 4.6 million Veterans, totaling $66.3 billion (VBA 2016). An individual's level of compensation varies by disorder and degree of disability. Based on the Veterans Affairs Schedule of Rating Disabilities, Veterans can be service‐connected for posttraumatic stress disorder (PTSD) at levels of 0, 10, 30, 50, 70, or 100 percent. It is estimated that 49 percent of post‐9/11 Veterans have some service‐connected condition (VA 2015; VBA 2016) and 15 percent are service‐connected for PTSD (VA 2015; VBA 2016). Among all Veterans, PTSD is the third most prevalent service‐connected condition, after tinnitus and hearing loss (VBA 2016).
Veterans with PTSD experience substantial distress and disability, and those who apply for service‐connected disability awards for PTSD commonly experience high morbidity and functional impairment (Murdoch et al. 2011, 2017). However, patterns of mental health service utilization prior to and following disability awards are poorly understood. Previous studies have used small or single‐site samples (Elhai, Reeves, and Frueh 2004; Grubaugh et al. 2004; Sayer, Spoont, and Nelson 2004b; Spoont et al. 2007; Sayer et al. 2008), with limited generalizability. Veterans who are service‐connected for PTSD have high illness burden (Schnurr et al. 2009) and high need for care, which may be delivered by VHA or by non‐VHA providers.
There have been concerns voiced regarding whether some Veterans may seek mental health services to establish a basis for a PTSD claim and then disengage from mental health treatment after the claim is adjudicated (Frueh et al. 2007; McNally and Frueh 2012). A related concern is that Veterans’ use of VHA mental health services could abruptly diminish upon reaching a disability rating of 100 percent (Frueh et al. 2007; McNally and Frueh 2013). Such concerns often note a report from the Office of the Inspector General that reported a drop in mental health service use after reaching 100 percent service connection for PTSD (OIG 2005). However, critics have charged that the report was derived from a small, nonrepresentative, and potentially biased sample, with limited generalizability (Marx et al. 2012). While some arguments cite clinical perceptions that Veterans drop out of treatment once awarded benefits (e.g., see Meshberg‐Cohen, DeViva, and Rosen 2017), the majority of the current evidence does not support this claim (Elhai, Reeves, and Frueh 2004; Grubaugh et al. 2004; Sayer, Spoont, and Nelson 2004b; Laffaye et al. 2007; Spoont et al. 2007; Sayer et al. 2008; Aakre, Himelhoch, and Slade 2014).
Although studies suggest that Veterans do not typically reduce service utilization after being awarded disability benefits, preliminary evidence indicates that service utilization patterns do change over the course of the service connection rating process. For example, one study reported that the prevalence of VHA mental health services receipt doubled from 1 year before disability evaluation to the 3‐month time period after disability evaluation, decreased by 7 percent at 1 year postdisability evaluation, but still remained higher than before the claims initiation process had begun (Spoont et al. 2007). This pattern of mental health service use during the process of seeking disability has been found outside the VHA as well (Overland et al. 2008). However, due to the individualized nature of stressors and needs that Veterans experience during the service connection process, we anticipate that there may be distinct patterns of service utilization changes beyond the dichotomous assessment of some use versus no use.
Multiple factors and stressors may have an influence on mental health service utilization during the service connection process (Spoont et al. 2008). For example, the process of filing a claim is often stressful and Veterans with PTSD may experience increased symptoms and functional impairment during the claim submission period (Spoont et al. 2008). Additional stressors include the uncertainty of the process (Spoont et al. 2008), the stress of the evaluation itself (Sayer, Spoont, and Murdoch 2004a; Spoont et al. 2008; Rosen 2010; Meshberg‐Cohen, DeViva, and Rosen 2017), and the significance of the decision (Spoont et al. 2008). Afterward, Veterans must also cope with accepting results from the adjudication (Sayer et al. 2008). These stressors may increase the need for mental health services both leading up to and during the aftermath of the service connection process. However, to date, no studies have used a data‐driven approach to identify different patterns of service utilization during this process, nor followed Veterans for a substantial period of time after the rating date.
To determine whether receiving PTSD service connection is associated with mental health service use, as well as to inform VHA initiatives related to access and treatment, we used latent trajectory analysis to identify patterns of VHA mental health service utilization before and after new or increased PTSD service connection ratings. Also, to better discern subgroups that exhibit different service utilization patterns, we examined sociodemographic correlates of utilization trajectories. Finally, given focused interest regarding those awarded 100 percent service connection (Frueh et al. 2007), we examined whether a service‐connected disability rating of <100 percent versus 100 percent was associated with trajectory membership.
Methods
Participants
Using VBA administrative data, we identified a representative 10 percent random sample of Veterans with new or increased PTSD ratings between June 2012 and December 2014 who were alive for 12 months following rating date (n of 10 percent sample = 22,254; N of overall cohort = 222,547). All Veterans in the sample were enrolled in VHA for at least 12 months prior to the PTSD rating date. Data on VHA service utilization were obtained from the VA Corporate Data Warehouse (VA 2017). Further information on this source can be found in Fihn et al. (2014).
Outcome Measure
We assessed the presence or absence of at least one mental health encounter (excluding compensation and pension evaluations) in each of the 52 weeks prior to and following the date of VBA staff determination of service‐connected disability rating. Qualifying visits include outpatient visits, telemental health visits, residential stays or inpatient stays. Thus, for each week, there was a dichotomous indication of having had some mental health encounter(s) or of having had no mental health encounters.
Independent Variables
Sociodemographic characteristics included Veteran age at rating date (categorized as <30, 30–39, 40–49, 50–59, 60–69, 70–79, and 80+), gender, most recent period of service (World War II, Korean War, Vietnam War, Peacetime, Gulf War, and Global War on Terror), straight‐line distance from the center of the Veteran's zip code to the center of the zip code of the nearest VHA facility or VHA Community‐Based Outpatient Clinic (<10 miles, 10–24 miles, 25–49 miles, 50 or more miles, or unknown), service connection level for PTSD (0–10, 30, 50, 70, and 100 percent), PTSD service connection rating change status (new or increased), and military sexual trauma (MST) status (yes, no, declined to answer, and unknown/not screened). All Veterans who receive VHA care are supposed to be screened at least once for MST, which is defined as sexual assault or sexual harassment occurring during military service.
Data Analysis
We used latent trajectory analysis to distinguish service utilization patterns. Latent trajectory analysis identifies clusters of individuals following a similar progression of an outcome over time (Nagin and Odgers 2010). This method assumes that the population is composed of a finite mixture of distinct groups defined by their trajectories over time (Nagin and Odgers 2010). Analyses were conducted using PROC TRAJ in SAS version 9.4 (SAS Institute, Inc. 2013; SAS 9.4. Cary, NC: SAS Institute Inc.) using maximum likelihood estimation. The outcome variable was the presence or absence of a mental health encounter, and the independent variable was time in weeks from the period from 52 weeks prior to the rating date to 52 weeks after the rating date. A generalized logit model was used. Both linear and quadratic terms were estimated during model fitting, following Nagin (2005), and up to five trajectories were specified. Fit indices, average posterior probability (likelihood of fitting best into the assigned trajectory), and interpretability of trajectories were used to determine the number of trajectories in the final model. Patients were assigned to the trajectory for which they had the highest posterior probability of membership.
Chi‐square tests were used to examine the association between trajectory membership and sociodemographic characteristics. Also, we conducted an additional chi‐square test categorizing Veterans as <100 percent versus 100 percent service‐connected for PTSD. Multinomial logistic regression was then used to model associations between patient characteristics and trajectory membership. For the main analysis, the group with the least utilization was the reference group. Relative risk ratios (RRRs) with 95% confidence intervals (CIs) were used to compare covariates between groups.
Sensitivity Analysis
Given the importance of understanding women Veterans’ experiences, we also conducted gender‐stratified analyses. Due to small cell sizes, these analyses did not include individuals with unknown or declined MST status, individuals who served in World War II, or individuals who lived an unknown distance from a VHA facility. In total, 1,281 men (6.2 percent of men) and 74 women (4.4 percent of women) were excluded from these analyses.
Results
Demographic characteristics of the sample are presented in Table 1. About 30 percent of Veterans were under the age of 40, 92 percent were male, 43 percent served in Vietnam, and another 41 percent in the Global War on Terror. Sixty‐eight percent of Veterans received new PTSD ratings and 32 percent received rating increases. There were no significant differences between the final sample and the overall cohort (all p > .2).
Table 1.
Veterans with New or Increased PTSD Service Connection Rating: Characteristics, Overall, and by Trajectory Group
| Overall (10% Sample) | Group 1 (No Use) (n = 8,132) | Group 2 (Low Use) (n = 8,428) | Group 3 (Increasing Use) (n = 2,078) | Group 4 (Decreasing Use) (n = 2,492) | Group 5 (High Use) (n = 1,124) | Chi‐sq p‐Value | |||||||
|---|---|---|---|---|---|---|---|---|---|---|---|---|---|
| N | % | N | % | N | % | N | % | N | % | N | % | ||
| Age | |||||||||||||
| <30 | 2,618 | 11.8 | 1,040 | 12.8 | 1,000 | 11.9 | 223 | 10.7 | 277 | 11.1 | 78 | 6.9 | <.001 |
| 30–39 | 3,900 | 17.5 | 1,392 | 17.1 | 1,483 | 17.6 | 397 | 19.1 | 466 | 18.7 | 162 | 14.4 | |
| 40–49 | 3,234 | 14.5 | 1,023 | 12.6 | 1,240 | 14.7 | 379 | 18.2 | 416 | 16.7 | 176 | 15.7 | |
| 50–59 | 2,160 | 9.7 | 569 | 7.0 | 773 | 9.2 | 272 | 13.1 | 358 | 14.4 | 188 | 16.7 | |
| 60–69 | 8,794 | 39.5 | 3,330 | 40.9 | 3,388 | 40.2 | 716 | 34.5 | 889 | 35.7 | 471 | 41.9 | |
| 70–79 | 1,034 | 4.6 | 495 | 6.1 | 368 | 4.4 | 73 | 3.5 | 65 | 2.6 | 33 | 2.9 | |
| 80+ | 514 | 2.3 | 283 | 3.5 | 176 | 2.1 | 18 | 0.9 | 21 | 0.8 | 16 | 1.4 | |
| Sex | |||||||||||||
| Male | 20,566 | 92.4 | 7,697 | 94.7 | 7,819 | 92.8 | 1,867 | 89.8 | 2,219 | 89.0 | 964 | 85.8 | <.001 |
| Female | 1,688 | 7.6 | 435 | 5.3 | 609 | 7.2 | 211 | 10.2 | 273 | 11.0 | 160 | 14.2 | |
| Period of service | |||||||||||||
| World War II | 222 | 1.0 | 135 | 1.7 | 69 | 0.8 | 5 | 0.2 | 6 | 0.2 | 7 | 0.6 | <.001 |
| Korean | 342 | 1.5 | 165 | 2.0 | 131 | 1.6 | 18 | 0.9 | 18 | 0.7 | 10 | 0.9 | |
| Vietnam | 9,578 | 43.0 | 3,690 | 45.4 | 3,640 | 43.2 | 775 | 37.3 | 963 | 38.6 | 510 | 45.4 | |
| Peacetime | 730 | 3.3 | 131 | 1.6 | 239 | 2.8 | 96 | 4.6 | 155 | 6.2 | 109 | 9.7 | |
| Gulf War | 2,205 | 9.9 | 653 | 8.0 | 865 | 10.3 | 251 | 12.1 | 288 | 11.6 | 148 | 13.2 | |
| GWOT | 9,177 | 41.2 | 3,358 | 41.3 | 3,484 | 41.3 | 933 | 44.9 | 1,062 | 42.6 | 340 | 30.2 | |
| Percent service connection for PTSD | |||||||||||||
| 0–10% | 659 | 3.0 | 321 | 3.9 | 210 | 2.5 | 56 | 2.7 | 58 | 2.3 | 14 | 1.2 | <.001 |
| 30% | 4,562 | 20.5 | 2,102 | 25.8 | 1,613 | 19.1 | 359 | 17.3 | 368 | 14.8 | 120 | 10.7 | |
| 50% | 7,142 | 32.1 | 2,839 | 34.9 | 2,696 | 32.0 | 653 | 31.4 | 662 | 26.6 | 292 | 26.0 | |
| 70% | 7,471 | 33.6 | 2,304 | 28.3 | 2,968 | 35.2 | 741 | 35.7 | 999 | 40.1 | 459 | 40.8 | |
| 100% | 2,415 | 10.9 | 566 | 7.0 | 939 | 11.1 | 268 | 12.9 | 405 | 16.3 | 237 | 21.1 | |
| Percent service connection for PTSD (100 vs. all others) | |||||||||||||
| 0–70% | 19,839 | 89.1 | 7,566 | 93.0 | 7,487 | 88.8 | 1,809 | 87.1 | 2,087 | 83.7 | 885 | 78.7 | <.001 |
| 100% | 2,415 | 10.9 | 566 | 7.0 | 939 | 11.1 | 268 | 12.9 | 405 | 16.3 | 237 | 21.1 | |
| Distance from nearest VA facility | |||||||||||||
| <10 miles | 11,572 | 52.0 | 4,009 | 49.3 | 4,274 | 50.7 | 1,129 | 54.3 | 1,386 | 55.6 | 774 | 68.9 | <.001 |
| 10–24 miles | 7,198 | 32.3 | 2,741 | 33.7 | 2,760 | 32.7 | 670 | 32.2 | 784 | 31.5 | 243 | 21.6 | |
| 25–49 miles | 2,762 | 12.4 | 1,073 | 13.2 | 1,125 | 13.3 | 215 | 10.3 | 269 | 10.8 | 80 | 7.1 | |
| ≥50 miles | 471 | 2.1 | 197 | 2.4 | 180 | 2.1 | 47 | 2.3 | 34 | 1.4 | 13 | 1.2 | |
| Unknown | 251 | 1.1 | 112 | 1.4 | 89 | 1.1 | 17 | 0.8 | 19 | 0.8 | 14 | 1.2 | |
| Military sexual trauma | |||||||||||||
| Yes | 1,538 | 6.9 | 256 | 3.1 | 538 | 6.4 | 216 | 10.4 | 309 | 12.4 | 219 | 19.5 | <.001 |
| No | 19,812 | 89.0 | 7,033 | 86.5 | 7,850 | 93.1 | 1,856 | 89.3 | 2,172 | 87.2 | 901 | 80.2 | |
| Declined to answer | 50 | 0.2 | 17 | 0.2 | 21 | 0.2 | 3 | 0.1 | 8 | 0.3 | 1 | 0.1 | |
| Unknown | 854 | 3.8 | 826 | 10.2 | 19 | 0.2 | 3 | 0.1 | 3 | 0.1 | 3 | 0.3 | |
| New or increased service connection | |||||||||||||
| New | 15,115 | 67.9 | 5,959 | 73.3 | 5,430 | 64.4 | 1,384 | 66.6 | 1,647 | 66.1 | 695 | 61.8 | <.001 |
| Increased | 7,139 | 32.1 | 2,173 | 26.7 | 2,998 | 35.6 | 694 | 33.4 | 845 | 33.9 | 429 | 38.2 | |
Goodness‐of‐fit indices for the 1–5 trajectory models are presented in Table 2. Based on fit indices, we selected a 5‐group model as the optimal solution (see Figure 1). Average service utilization before and after rating date is presented in Table 3. Based on these numbers and visual inspection of the trajectories, the five trajectory groups were labeled as follows: (1) No Use (36.6 percent of Veterans), (2) Low Use (37.7 percent), (3) Increasing Use (9.4 percent), (4) Decreasing Use (11.2 percent), and (5) High Use (5.1 percent). The average posterior probability was 0.96 for Veterans assigned to Group 1, 0.94 for Veterans assigned to Group 2, 0.93 for those assigned to Groups 3 and 4, and 0.98 for those assigned to Group 5. Average posterior probabilities above 0.7 are considered acceptable (Nagin 2005).
Table 2.
Trajectory Fit Statistics
| Number of Trajectories | BIC | SSBIC | AIC | L |
|---|---|---|---|---|
| 1 | −908,495.9 | −908,488.9 | −908,476.0 | −908,473.9 |
| 2 | −772,032.0 | −772,015.7 | −771,987.7 | −771,980.7 |
| 3 | −738,901.2 | −738,875.7 | −738,831.6 | −738,820.6 |
| 4 | −726,200.6 | −726,165.8 | −726,105.7 | −726,090.7 |
| 5 | −716,640.0 | −716,595.9 | −716,519.8 | −716,500.8 |
AIC, Akaike information criterion; BIC, Bayesian information criterion; L, Likelihood ratio; SSBIC, sample size adjusted Bayesian information criterion.
Figure 1.
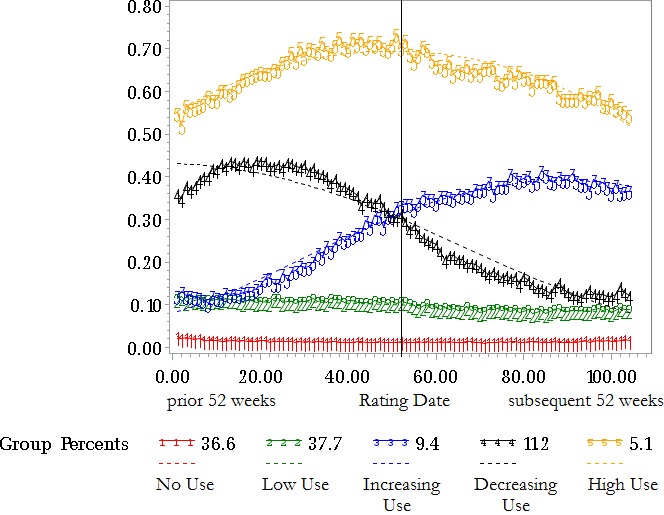
Receipt of Mental Health Encounters by Week [Color figure can be viewed at http://wileyonlinelibrary.com]
Table 3.
Number of Weeks with Any Mental Health Use, 52 Weeks before and after Rating Date
| Group | Label | Prerating Date Period | Postrating Date Period | ||||
|---|---|---|---|---|---|---|---|
| Mean | SD | 95% CI | Mean | SD | 95% CI | ||
| 1 | No use | 0.74 | 1.03 | 0.72–0.76 | 0.66 | 0.98 | 0.64–0.68 |
| 2 | Low use | 5.71 | 3.28 | 5.64–5.78 | 4.64 | 2.97 | 4.58–4.70 |
| 3 | Increasing use | 10.02 | 5.70 | 9.77–10.27 | 19.63 | 7.00 | 19.33–19.93 |
| 4 | Decreasing use | 20.55 | 6.63 | 20.29–20.81 | 8.99 | 5.04 | 8.79–9.19 |
| 5 | High use | 34.19 | 8.76 | 33.68–34.70 | 32.70 | 9.17 | 32.16–33.24 |
Table 1 also presents the results of bivariate comparisons among the five groups. There were group differences by age, sex, period of service, service connection level, distance from nearest VA facility, MST status, and status of service connection for PTSD (new vs. increased). We conducted an additional chi‐square test categorizing Veterans as <100 percent versus 100 percent service‐connected. Findings indicated that those with 100 percent service connection were more likely than those who were <100 percent service‐connected to be in the High Use group (Table 1).
Multinomial regression results are presented in Table 4 and Table S1. For these analyses, we conducted three post hoc comparisons to address specific questions about divergent patterns of service use. First, we compared the groups representing any use (Groups 2–5) with the No Use group (Group 1) to determine the characteristics of Veterans who were engaging in care to some degree versus those not engaging at all. Adjusting for other covariates and compared with the No Use group, Veterans in the other groups were more likely to have served in the Vietnam War or Gulf War, to live closer to a VHA facility, have greater service connection for PTSD, positive MST screens, and have had an increase rather than a new rating (see Table 4). They were less likely to have served in World War II or the Korean War. Second, we compared the Increasing Use group (Group 3) with the Decreasing Use group (Group 4) to determine the factors associated with divergent patterns of use during the service connection process. Compared with the Increasing Use group, Veterans in the Decreasing Use group were less likely to live 50 miles or more from the nearest VA facility (RRR = 0.58, CI = 0.37–0.91; see Table S1). Third, given similar low initial levels of use, we compared the Increasing Use (Group 3) with the Low Use (Group 2) to determine who begins to expand engagement in care during the service connection process. Compared with the Increasing Use group, Veterans in the Low Use group were more likely to have served in World War II (RRR = 3.72, CI = 1.50–9.27), the Korean War (RRR = 1.94, CI = 1.18–3.20), or the Vietnam War (RRR = 1.23, CI = 1.10–1.37), more likely to live 25–49 miles from the nearest VA facility (RRR = 1.34, CI = 1.15–1.58), and less likely to have a positive MST screen (RRR = 0.67, CI = 0.55–0.83).
Table 4.
Adjusted Multinomial Regression Results Predicting Trajectory Membership, as Compared with the No Use Group
| Characteristic | Group | RRR | 95% CI |
|---|---|---|---|
| Gender: Female vs. Male | Low use | 1.03 | 0.89–1.21 |
| Increasing use | 1.04 | 0.84–1.29 | |
| Decreasing use | 1.02 | 0.83–1.25 | |
| High use | 1.08 | 0.83–1.40 | |
| Service‐connected percent 30 vs. 0–10 | Low use | 1.11 | 0.92–1.35 |
| Increasing use | 0.93 | 0.68–1.27 | |
| Decreasing use | 0.93 | 0.68–1.26 | |
| High use | 1.24 | 0.70–2.19 | |
| Service‐connected percent 50 vs. 0–10 | Low use | 1.28 | 1.06–1.54* |
| Increasing use | 1.17 | 0.87–1.58 | |
| Decreasing use | 1.16 | 0.86–1.56 | |
| High use | 2.05 | 1.18–3.57* | |
| Service‐connected percent 70 vs. 0–10 | Low use | 1.65 | 1.36–1.99*** |
| Increasing use | 1.57 | 1.16–2.12** | |
| Decreasing use | 2.08 | 1.54–2.79*** | |
| High use | 3.57 | 2.06–6.20*** | |
| Service‐connected percent 100 vs. 0–10 | Low use | 1.98 | 1.60–2.45*** |
| Increasing use | 2.26 | 1.62–3.14*** | |
| Decreasing use | 3.36 | 2.44–4.62*** | |
| High use | 6.97 | 3.95–12.30*** | |
| World War II vs. GWOT | Low use | 0.43 | 0.32–0.58*** |
| Increasing use | 0.12 | 0.05–0.28*** | |
| Decreasing use | 0.12 | 0.05–0.26*** | |
| High use | 0.41 | 0.19–0.90* | |
| Korean Conflict vs. GWOT | Low use | 0.72 | 0.57–0.92** |
| Increasing use | 0.37 | 0.23–0.61*** | |
| Decreasing use | 0.31 | 0.19–0.52*** | |
| High use | 0.52 | 0.27–1.00* | |
| Vietnam Era vs. GWOT | Low use | 1.51 | 1.20–1.90* |
| Increasing use | 1.90 | 1.42–2.54*** | |
| Decreasing use | 2.41 | 1.85–3.13*** | |
| High use | 4.15 | 3.06–5.63*** | |
| Peacetime Era vs. GWOT | Low use | 0.92 | 0.86–0.99*** |
| Increasing use | 0.75 | 0.67–0.84*** | |
| Decreasing use | 0.81 | 0.73–0.90*** | |
| High use | 1.36 | 1.17–1.58*** | |
| Gulf War vs. GWOT | Low use | 1.24 | 1.10–1.39*** |
| Increasing use | 1.29 | 1.09–1.53** | |
| Decreasing use | 1.25 | 1.06–1.46** | |
| High use | 1.82 | 1.47–2.27*** | |
| Distance: 10–24 miles vs. <10 | Low use | 0.97 | 0.91–1.04 |
| Increasing use | 0.91 | 0.81–1.01 | |
| Decreasing use | 0.87 | 0.79–0.97* | |
| High use | 0.49 | 0.42–0.58*** | |
| Distance: 25–49 miles vs. <10 | Low use | 0.99 | 0.90–1.10 |
| Increasing use | 0.74 | 0.63–0.87*** | |
| Decreasing use | 0.76 | 0.65–0.89*** | |
| High use | 0.39 | 0.31–0.50*** | |
| Distance: 50+ miles vs. <10 | Low use | 0.84 | 0.68–1.03 |
| Increasing use | 0.85 | 0.61–1.18 | |
| Decreasing use | 0.49 | 0.34–0.72*** | |
| High use | 0.34 | 0.19–0.60*** | |
| Distance: unknown vs. <10 | Low use | 0.77 | 0.57–1.03 |
| Increasing use | 0.53 | 0.31–0.91* | |
| Decreasing use | 0.52 | 0.31–0.85** | |
| High use | 0.67 | 0.38–1.20 | |
| MST: Yes vs. No | Low use | 1.63 | 1.37–1.95*** |
| Increasing use | 2.43 | 1.93–3.06*** | |
| Decreasing use | 2.82 | 2.28–3.49*** | |
| High use | 4.24 | 3.30–5.44*** | |
| MST declined to answer vs. no | Low use | 1.13 | 0.59–2.16 |
| Increasing use | 0.68 | 0.20–2.32 | |
| Decreasing use | 1.52 | 0.65–3.59 | |
| High use | 0.40 | 0.05–3.00 | |
| MST unknown vs. no | Low use | 0.02 | 0.01–0.03*** |
| Increasing use | 0.01 | 0.01–0.05*** | |
| Decreasing use | 0.01 | 0.00–0.04*** | |
| High use | 0.03 | 0.01–0.10*** | |
| Rating type increased vs. new | Low use | 1.29 | 1.20–1.39*** |
| Increasing use | 1.17 | 1.04–1.31** | |
| Decreasing use | 1.08 | 0.97–1.20 | |
| High use | 1.21 | 1.05–1.39** |
*p < .05; **p < .01; ***p < .001.
Sensitivity Analysis: Gender‐Stratified Results
Results of gender‐stratified analyses were largely consistent with the primary study findings and can be found in Tables S2–S5. Adjusting for other covariates and compared with the No Use group, male and female Veterans in the other groups were more likely to have served in the Gulf War, to live closer to a VHA facility, have greater service connection for PTSD, and positive MST screens (see Tables S2 and S3). Compared with the Increasing Use group, male Veterans in the Decreasing Use group were more likely to have served in the Peacetime era and less likely to live 50 miles or more from the nearest VA facility (see Table S4). Compared with the Increasing Use group, male Veterans in the Low Use group were more likely to have served in the Korean War and Vietnam War, more likely to live 25–49 miles from the nearest VA facility, more likely to have an increased rather than a new rating, and less likely to have a positive MST screen (Table S4). Compared with the Increasing Use group, female Veterans in the Low Use group were less likely to have a positive MST screen (Table S5).
Discussion
We conducted a latent trajectory analysis of Veterans who received service‐connected disability awards for PTSD between 2012 and 2014 to identify patterns of VHA mental health service utilization before and after the rating date. The majority of Veterans were categorized in trajectories with no appreciable change in service use over the study period. Approximately equal proportions (11.2 and 9.4 percent, respectively) fit the trajectories of decreasing use and increasing use. Inconsistent with long‐standing concerns about the VA disability compensation system incentivizing illness behavior, only a small percentage of participants in our sample showed a decrease in their use of VHA mental health services. Furthermore, there was no evidence to suggest that high levels of service connection were associated with decreased service use after rating date. A large proportion of service‐connected Veterans were not engaged with VHA mental health services. These findings suggest that greater efforts are necessary to engage Veterans with need in mental health care for PTSD.
Study findings were largely consistent with previous findings, which have generally failed to indicate a decrease in mental health utilization following service connection for most Veterans who receive PTSD disability benefits. Prior studies have either not identified differences in treatment utilization by service‐connected disability status (Elhai, Reeves, and Frueh 2004; Grubaugh et al. 2004) or have observed that those receiving PTSD service connection awards maintained (Sayer et al. 2008; Spoont et al. 2008) or increased their mental health service utilization (Sayer, Spoont, and Nelson 2004b; Spoont et al. 2007). To our knowledge, no peer‐reviewed publications have indicated decreased service use after service connection awards. Our study adds to the literature by examining a large, nationally representative sample and defining subtypes of service utilization in the pre‐ and postrating date periods.
In targeted comparisons, compared with the No Use group, Veterans in the other groups were more likely to live closer to a VHA facility, suggesting that Veterans who live farther from a VHA facility are less likely to be engaged in VHA care. This finding supports VHA initiatives to increase access for Veterans who live farther from VHA facilities, such as service provision via telehealth. Of note, we included telehealth encounters in the measure of mental health services. The fact that distance to facility still predicted frequency of service use suggests that the current availability of telehealth services may not be sufficient to address barriers to care among Veterans who live at a greater distance from VHA facilities. Those with positive MST screens were more likely to be in the greater use trajectories compared with the No Use trajectory and were also more likely to expand engagement in care during the service connection process. These results held for both men and women, when analyzed separately. Our findings are perhaps due to VHA's concerted efforts to engage and provide care for Veterans with MST, or due to greater need or willingness to seek care. Greater levels of service connection were associated with more use, overall, and Veterans with a service connection rating of 100 percent were more likely to be in the High Use group.
Comparisons between the Increasing Use group and the Low Use group suggest that among occasional but infrequent users, earlier era Veterans are less likely to start using services regularly over the course of the service connection process. Greater efforts may be needed to engage these Veterans in care. Level of service connection was not associated with likelihood of belonging to the Low Use versus Increasing Use group or the Decreasing Use versus Increasing Use group. Overall, few of the observed variables predicted trajectory membership in these comparisons. These findings suggest that service use demands are complex, and there are many reasons why service utilization may change following disability award.
There are several potential reasons for the emergence of different trajectories during and after the service connection process. For example, the compensation and pension evaluation are often perceived to be a stressful process (Sayer, Spoont, and Murdoch 2004a). It is a forensic evaluation, and so is not designed to be therapeutic in the same way as a mental health treatment service (Worthen and Moering 2011). Consequently, the evaluation can occasionally be perceived as adversarial (Meshberg‐Cohen, DeViva, and Rosen 2017). One study found that self‐reported PTSD symptoms and disability scores exhibited a slight increase between the time of claim initiation and disability examination and remained slightly elevated after notification (Spoont et al. 2008). The authors posited that this distress could have been associated with a desire to improve financial status, fear about the examination, or fear about being discredited or stigmatized (Spoont et al. 2008). Veterans may also plan to appeal the decision once it is made, which extends the period of uncertainty (Sayer et al. 2008). The claims process can also be stressful because it requires discussion of trauma and its impact on one's life (Sayer, Spoont, and Murdoch 2004a). Thus, there are many reasons that an individual might experience more distress before, during, or after an evaluation, depending on the circumstances. Increased distress might contribute to increased need for mental health services during this time. Aside from level of distress, there are other reasons why Veterans might increase or decrease utilization following their disability award. Service connection may increase utilization because it improves access to care by reducing the cost of care and cost of transportation to care. Utilization may also increase during the pre‐award period if Veterans are determined to be temporarily eligible for VA care (potentially including transportation) during the period before adjudication (Tentative Eligibility Determinations 2009). Problems identified during the disability evaluation may result in placement of referrals for VA mental health care and thus lead to increased service use in the time between evaluation and claim determination. Alternatively, Veterans awarded service connection may decrease their VHA service utilization because they are avoidant of both internal and external reminders of their trauma (core PTSD symptoms) and are avoiding treatment, or because they now have the financial resources to seek care outside the VHA, if this is their preference (Marx et al. 2012).
Veterans also have various reasons for seeking service connection. A qualitative study of reasons for seeking service connection among 44 Veterans filing claims identified the following categories: tangible need, need for problem identification or clarification, justification or legitimization of disability status (e.g., deserving compensation or recognition and validation for military trauma or PTSD), encouragement from trusted others, and professional assistance with the application process (Sayer et al. 2011). Furthermore, if Veterans are applying for service connection for conditions other than PTSD, they may find it easier to put in claims for all conditions at once rather than applying for them one at a time (Sayer et al. 2011). Veteran advocate assistance and social network encouragement may play a key role in promoting claim filing (Sayer et al. 2011). The delays that have been observed between time of trauma and time of filing (e.g., among Vietnam era Veterans who are only recently filing claims for PTSD) may be due to a previous lack of these key facilitating factors (Sayer et al. 2011). Furthermore, because of assistance from Veterans advocates and Veterans service organizations, some Veterans describe the process of filing a disability claim as easier than seeking treatment for PTSD from VHA (Sayer et al. 2011). Thus, Veterans apply for service connection for a variety of reasons.
There are several limitations to this study. The sample did not include Veterans whose claims were denied. These Veterans may experience higher rates of impaired functioning including poverty and homelessness (Murdoch et al. 2011) and thus may have a higher need for care. Consequently, Veterans whose claims are denied may have different patterns of VHA service utilization following claim determination. Second, the data did not include measures of PTSD symptom severity or psychiatric comorbidity, and thus, it was not possible to determine whether these clinical variables predicted service use trajectories. Third, it was not possible to measure use of mental health care outside of VHA or PTSD care that was provided through the VA Readjustment Counseling Service (Vet Center) System. Vet Centers served over 200,000 Veterans and military families in FY2015 (https://www.vetcenter.va.gov/) and have served or provided outreach to approximately 40 percent of all discharged GWOT Veterans (Amdur et al. 2011). Approximately 25 percent of Vet Center users carry a diagnosis of PTSD (OIG 2009) and approximately 40 percent do not use VHA care. Therefore, a decline in VHA mental health service utilization may or may not indicate the absence of care altogether. It is possible that Veterans may shift out of VHA before or after the service connection award. Fourth, we tracked service use for a year prior to award determination, but given the average length of time required to process a claim, it is likely that most of the sample was already involved in the service connection process at the beginning of the study period. Consequently, the patterns of service utilization during this pre‐award period may not be a “true baseline” of service utilization.
In summary, we conducted a latent trajectory analysis of VHA service utilization patterns in the year preceding and following service connection award for PTSD and found an overall low rate of service utilization among service‐connected Veterans. These results may be helpful for clinicians and policy makers, insofar as they provide previously unavailable information regarding mental health service utilization in relation to PTSD disability awards. Generally, low VHA mental health service use observed in this study suggests the need for expanded efforts to ensure access and treatment engagement for Veterans who are service‐connected for PTSD.
Supporting information
Appendix SA1: Author Matrix.
Table S1. Adjusted Multinomial Regression Results Predicting Trajectory Membership, as Compared with the Increasing Use Group.
Table S2. Gender‐Stratified Analysis. Adjusted Multinomial Regression Results Predicting Trajectory Membership in Male Veterans, as Compared with the No Use Group.
Table S3. Gender‐Stratified Analysis. Adjusted Multinomial Regression Results Predicting Trajectory Membership in Female Veterans, as Compared with the No Use Group.
Table S4. Gender‐Stratified Analysis. Adjusted Multinomial Regression Results Predicting Trajectory Membership in Male Veterans, as Compared with the Increasing Use Group.
Table S5. Gender‐Stratified Analysis. Adjusted Multinomial Regression Results Predicting Trajectory Membership in Female Veterans, as Compared with the Increasing Use Group.
Acknowledgments
Joint Acknowledgment/Disclosure Statement: A poster based on these findings was presented at the July 2017 Annual Meeting of the VA Health Services Research and Development Service in Arlington, VA. Dr. Sripada is supported by CDA 15‐251, IK2 HX‐002095‐01 from the United States (U.S.) Department of Veterans Affairs Health Services R&D (HSRD) Service.
Disclosures: None.
Disclaimer: None.
References
- Aakre, J. M. , Himelhoch S., and Slade E. P.. 2014. “Mental Health Service Utilization by Iraq and Afghanistan Veterans after Entry into PTSD Specialty Treatment.” Psychiatric Services (Washington, D. C.) 65 (8): 1066–9. [DOI] [PubMed] [Google Scholar]
- Amdur, D. , Batres A., Belisle J., Brown J. H. Jr, Cornis‐Pop M., Mathewson‐Chapman M., Harms G., Hunt S. C., Kennedy P., and Mahoney‐Gleason H.. 2011. “VA Integrated Post‐Combat Care: A Systemic Approach to Caring for Returning Combat Veterans.” Social Work in Health Care 50 (7): 564–75. [DOI] [PubMed] [Google Scholar]
- Elhai, J. D. , Reeves A. N., and Frueh B. C.. 2004. “Predictors of Mental Health and Medical Service Use in Veterans Presenting with Combat‐Related Posttraumatic Stress Disorder.” Psychological Services 1 (2): 111. [Google Scholar]
- Fihn, S. D. , Francis J., Clancy C., Nielson C., Nelson K., Rumsfeld J., Cullen T., Bates J., and Graham G. L.. 2014. “Insights from Advanced Analytics at the Veterans Health Administration.” Health Affairs 33 (7): 1203–11. [DOI] [PubMed] [Google Scholar]
- Frueh, B. C. , Grubaugh A. L., Elhai J. D., and Buckley T. C.. 2007. “US Department of Veterans Affairs Disability Policies for Posttraumatic Stress Disorder: Administrative Trends and Implications for Treatment, Rehabilitation, and Research.” American Journal of Public Health 97 (12): 2143–5. [DOI] [PMC free article] [PubMed] [Google Scholar]
- Grubaugh, A. L. , Elhai J. D., Monnier J., and Frueh B. C.. 2004. “Service Utilization Among Compensation‐Seeking Veterans.” Psychiatric Quarterly 75 (4): 333–41. [DOI] [PubMed] [Google Scholar]
- Laffaye, C. , Rosen C. S., Schnurr P. P., and Friedman M. J.. 2007. “Does Compensation Status Influence Treatment Participation and Course of Recovery from Post‐Traumatic Stress Disorder?” Military Medicine 172 (10): 1039–45. [DOI] [PubMed] [Google Scholar]
- Marx, B. P. , Jackson J. C., Schnurr P. P., Murdoch M., Sayer N. A., Keane T. M., Friedman M. J., Greevy R. A., Owen R. R., and Sinnott P. L.. 2012. “The Reality of Malingered PTSD among Veterans: Reply to McNally and Frueh (2012).” Journal of Traumatic Stress 25 (4): 457–60. [Google Scholar]
- McNally, R. J. , and Frueh B. C.. 2012. “Why We Should Worry about Malingering in the VA System: Comment on Jackson et al. (2011).” Journal of Traumatic Stress 25 (4): 454–6; author reply 57–60. [DOI] [PubMed] [Google Scholar]
- McNally, R. J. , and Frueh B. C.. 2013. “Why Are Iraq and Afghanistan War Veterans Seeking PTSD Disability Compensation at Unprecedented Rates?” Journal of Anxiety Disorders 27 (5): 520–6. [DOI] [PubMed] [Google Scholar]
- Meshberg‐Cohen, S. , DeViva J. C., and Rosen M. I.. 2017. “Counseling Veterans Applying for Service Connection Status for Mental Health Conditions.” Psychiatric Services (Washington, D. C.) 68 (4): 396–9. [DOI] [PubMed] [Google Scholar]
- Murdoch, M. , Sayer N. A., Spoont M. R., Rosenheck R., Noorbaloochi S., Griffin J. M., Arbisi P. A., and Hagel E. M.. 2011. “Long‐Term Outcomes of Disability Benefits in US Veterans with Posttraumatic Stress Disorder.” Archives of General Psychiatry 68 (10): 1072–80. [DOI] [PMC free article] [PubMed] [Google Scholar]
- Murdoch, M. , Spoont M. R., Kehle‐Forbes S. M., Harwood E. M., Sayer N. A., Clothier B. A., and Bangerter A. K.. 2017. “Persistent Serious Mental Illness among Former Applicants for VA PTSD Disability Benefits and Long‐Term Outcomes: Symptoms, Functioning, and Employment.” Journal of Traumatic Stress 30 (1): 36–44. [DOI] [PMC free article] [PubMed] [Google Scholar]
- Nagin, D. S. 2005. Group‐Based Modeling of Development. Cambridge, MA: Harvard University Press. [Google Scholar]
- Nagin, D. S. , and Odgers C. L.. 2010. “Group‐Based Trajectory Modeling in Clinical Research.” Annual Review of Clinical Psychology 6: 109–38. [DOI] [PubMed] [Google Scholar]
- OIG . 2005. Office of Inspector General. Review of State Variances in VA Disability Compensation Payments (Report #05‐00765‐137). Washington, DC: Department of Veterans Affairs. [Google Scholar]
- OIG . 2009. Office of Inspector General. Healthcare Inspection Readjustment Counseling Service Vet Center Report (Report #08‐02589‐171). Washington, DC: Department of Veterans Affairs. [Google Scholar]
- Overland, S. , Glozier N., Henderson M., Maeland J. G., Hotopf M., and Mykletun A.. 2008. “Health Status before, during and after Disability Pension Award: The Hordaland Health Study (HUSK).” Occupational and Environmental Medicine 65 (11): 769–73. [DOI] [PubMed] [Google Scholar]
- Rosen, M. I. . 2010. “Compensation Examinations for PTSD—An Opportunity for Treatment?” Journal of Rehabilitation Research and Development 47 (5): xv. [DOI] [PMC free article] [PubMed] [Google Scholar]
- Sayer, N. A. , Spoont M., and Murdoch M.. 2004a. “The Department of Veterans Affairs Disability Compensation Program: What Providers Should Know.” Federal Practitioner 21 (5): 15–20. [Google Scholar]
- Sayer, N. A. , Spoont M., and Nelson D. B.. 2004b. “Disability Compensation for PTSD and use of VA Mental Health Care.” Psychiatric Services (Washington, D. C.) 55 (5): 589. [DOI] [PubMed] [Google Scholar]
- Sayer, N. A. , Spoont M., Nelson D. B., Clothier B., and Murdoch M.. 2008. “Changes in Psychiatric Status and Service Use Associated with Continued Compensation Seeking after Claim Determinations for Posttraumatic Stress Disorder.” Journal of Traumatic Stress 21 (1): 40–8. [DOI] [PubMed] [Google Scholar]
- Sayer, N. A. , Spoont M., Murdoch M., Parker L. E., Hintz S., and Rosenheck R.. 2011. “A Qualitative Study of U.S. Veterans’ Reasons for Seeking Department of Veterans Affairs Disability Benefits for Posttraumatic Stress Disorder.” Journal of Traumatic Stress 24 (6): 699–707. [DOI] [PubMed] [Google Scholar]
- Schnurr, P. P. , Lunney C. A., Bovin M. J., and Marx B. P.. 2009. “Posttraumatic Stress Disorder and Quality of Life: Extension of Findings to Veterans of the Wars in Iraq and Afghanistan.” Clinical Psychology Review 29 (8): 727–35. [DOI] [PubMed] [Google Scholar]
- Spoont, M. R. , Sayer N. A., Nelson D. B., and Nugent S.. 2007. “Does Filing a Post‐Traumatic Stress Disorder Disability Claim Promote Mental Health Care Participation among Veterans?” Military Medicine 172 (6): 572–5. [DOI] [PubMed] [Google Scholar]
- Spoont, M. R. , Sayer N. A., Nelson D. B., Clothier B., Murdoch M., and Nugent S.. 2008. “Does Clinical Status Change in Anticipation of a PTSD Disability Examination?” Psychological Services 5 (1): 49. [Google Scholar]
- “Tentative Eligibility Determinations.” 2009. 38 C.F.R. § 17.34.
- VA . 2015. Epidemiology Program, Post‐Deployment Health Group, Office of Patient Care Services, Veterans Health Administration, Department of Veterans Affairs. Analysis of VA Health Care Utilization among Operation Enduring Freedom, Operation Iraqi Freedom, and Operation New Dawn Veterans, from 1st Qtr FY 2002 through 3rd Qtr FY 2015. Washington, DC: Author; Available at https://www.publichealth.va.gov/docs/epidemiology/healthcare-utilization-report-fy2015-qtr3.pdf [Google Scholar]
- VA . 2016. Federal Benefits for Veterans, Dependents and Survivors. Washington, DC: U.S. Government Printing Office. [Google Scholar]
- VA . 2017. “US Department of Veterans Affairs. 172VA10P2: VHA Corporate Data Warehouse – VA. 79 FR 4377.” Updated (December 15, 2017) [accessed on December 15, 2017].
- VBA . 2016. Veterans Benefits Administration Annual Benefits Report, Fiscal Year 2016. Washington, DC: Department of Veterans Affairs, Veterans Benefits Administration; Available at https://benefits.va.gov/REPORTS/abr/ABR-Compensation-FY16-0613017.pdf [Google Scholar]
- Worthen, M. D. , and Moering R. G.. 2011. “A Practical Guide to Conducting VA Compensation and Pension Exams for PTSD and Other Mental Disorders.” Psychological Injury and Law 4 (3–4): 187–216. [Google Scholar]
Associated Data
This section collects any data citations, data availability statements, or supplementary materials included in this article.
Supplementary Materials
Appendix SA1: Author Matrix.
Table S1. Adjusted Multinomial Regression Results Predicting Trajectory Membership, as Compared with the Increasing Use Group.
Table S2. Gender‐Stratified Analysis. Adjusted Multinomial Regression Results Predicting Trajectory Membership in Male Veterans, as Compared with the No Use Group.
Table S3. Gender‐Stratified Analysis. Adjusted Multinomial Regression Results Predicting Trajectory Membership in Female Veterans, as Compared with the No Use Group.
Table S4. Gender‐Stratified Analysis. Adjusted Multinomial Regression Results Predicting Trajectory Membership in Male Veterans, as Compared with the Increasing Use Group.
Table S5. Gender‐Stratified Analysis. Adjusted Multinomial Regression Results Predicting Trajectory Membership in Female Veterans, as Compared with the Increasing Use Group.