

SUMMARY
Dietary soluble fibers are fermented by gut bacteria into short-chain fatty acids (SCFA), which are considered broadly health-promoting. Accordingly, consumption of such fibers ameliorates metabolic syndrome. However, incorporating soluble fiber inulin, but not insoluble fiber, into a compositionally defined diet, induced icteric hepatocellular carcinoma (HCC). Such HCC was microbiota-dependent and observed in multiple strains of dysbiotic mice but not in germ-free nor antibiotics-treated mice. Furthermore, consumption of an inulin-enriched high-fat diet induced both dysbiosis and HCC in wild-type (WT) mice. Inulin-induced HCC progressed via early onset of cholestasis, hepatocyte death, followed by neutrophilic inflammation in liver. Pharmacologic inhibition of fermentation or depletion of fermenting bacteria markedly reduced intestinal SCFA and prevented HCC. Intervening with cholestyramine to prevent reabsorption of bile acids also conferred protection against such HCC. Thus, its benefits notwithstanding, enrichment of foods with fermentable fiber should be approached with great caution as it may increase risk of HCC.
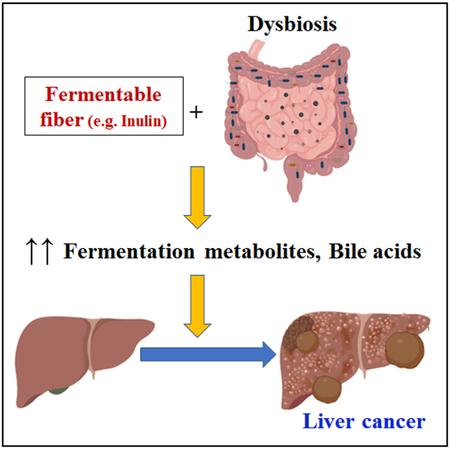
Graphical Abstract
In Brief
Dysregulated fermentation of dietary soluble fibers by gut microbiota induces cholestasis, hepatic inflammation, and liver cancer in mice.
INTRODUCTION
Societal changes associated with industrialization have resulted in increased consumption of processed foods rich in sugars and fats and decreased consumption of grains, fruits, and vegetables, which are naturally rich in fiber. Such dietary changes have ushered a well-documented increase in the prevalence of obesity and related metabolic diseases. Yet, engineering and effective marketing of “low-fat” and “fat-free” foods have not slowed the obesity epidemic. One seemingly logical and practical approach to counter some of the unhealthy effects of “western diets” might be to enrich processed foods with plant-derived fibers.
Dietary fiber can be broadly categorized as insoluble or soluble, while the former resists fermentation, the latter is readily metabolized by gut bacteria. One such prebiotic fiber is inulin, which is fermented by gut microbiota into short-chain fatty acids (SCFA) acetate, butyrate, and propionate in the colon (Gill et al., 2006). SCFA play important roles in mammalian physiology, including serving as an energy source for gut epithelia (Donohoe et al., 2011) and promoting the differentiation of anti-inflammatory regulatory T cells (Arpaia et al., 2013; Furusawa et al., 2013; Smith et al., 2013). Such effects likely contribute to inulin’s beneficial metabolic effects, which include reducing adiposity (Cani et al., 2007) and improving glycemic control (Dewulf et al., 2013).
Metabolism of dietary fibers into valuable nutrients is among the prime benefits gut microbiota provide to their host. However, the inability to properly manage gut microbiota can be detrimental to the host and result in chronic inflammation. For example, we demonstrated that mice deficient in Toll-like receptor 5 (TLR5; a receptor for flagellin) are prone to developing overt microbiota-dependent colitis (Vijay-Kumar et al., 2007) and low-grade inflammation associated with metabolic syndrome (Vijay-Kumar et al., 2010). Ablation of microbiota in TLR5-deficient (T5KO) mice ameliorated such inflammation and corrected their metabolic abnormalities, whereas transplant of their microbiota into germ-free wild-type (WT) mice recapitulated indices of metabolic syndrome in the recipients (Singh et al., 2015; Vijay-Kumar et al., 2010).
The initial purpose of this study was to test whether fermentable fibers, and SCFA generated therefrom, might ameliorate metabolic syndrome in T5KO mice. While fermentable fiber did reduce adiposity and improve glycemic control, it also had a highly disconcerting effect, namely induction of cholestasis and hepatocellular carcinoma (HCC). Such HCC was microbiota- and fermentation-dependent, and not specific to T5KO mice but, rather was observed in other dysbiotic mice fed compositionally defined diets enriched with fermentable fiber. These observations support the emerging hypothesis (Chassaing et al., 2015b; Miles et al., 2017; Park et al., 2016; Perry et al., 2016; Singh et al., 2015) that the extent to which soluble fibers and SCFA are beneficial is highly context-dependent. Consequently, enriching foods with fiber to manipulate microbiota should be approached with great caution.
RESULTS
Dietary Inulin Ameliorates Metabolic Syndrome but Causes Liver Dysfunction in T5KO Mice
Supplementation of diet with inulin can ameliorate low-grade inflammation, insulin resistance, and obesity (Cani et al., 2007; Dewulf et al., 2013). We therefore postulated that dietary intervention with inulin, and other soluble fibers (Table S1), might ameliorate microbiota dysbiosis and prevent metabolic syndrome in T5KO mice. Accordingly, we modified an open-source diet, frequently used as a control diet in nutritional studies and whose sole fiber source is cellulose, to formulate an inulin-containing diet (ICD) (Table S1) comprised of 7.5% inulin and 2.5% cellulose. The retention of 2.5% cellulose was to prevent diarrhea associated with the lack of roughage.
Feeding T5KO mice ICD lowered incidence of obesity in ~40% of mice, relative to what was observed for such mice fed a grain-based chow diet (Singh et al., 2015; Vijay-Kumar et al., 2010). The prevention of weight gain in this ~40% subset of mice (Figure S1A) correlated with a reduction in indices of metabolic syndrome (Figures S1B–S1F). The hyperphagia of T5KO mice (Vijay-Kumar et al., 2010) was unabated, as their average food intake remained higher than WT mice (Figure S1G). However, while preparing serum samples, we observed that the ~40% subset that seemingly lacked metabolic syndrome displayed a striking fluorescent yellow hue in their sera (Figure S1H), which begged investigation.
Subsequent analysis revealed that the bright yellow color observed in the serum of ~40% ICD-fed T5KO mice was due to elevated bilirubin, which marks cholestasis. Hence, we stratified the mice as either high (HB) or normal (NB) bilirubin groups. The hyperbilirubinemia (H-bili) was largely explained by increased conjugated bilirubin, but not unconjugated bilirubin (Figure S1I). Appearance of bilirubin in the urine (Figure S1J) further evinced conjugated bilirubinuria in HB mice. While both HB and NB mice had elevated serum lactate dehydrogenase (LDH) (Figure S1K), only HB mice displayed increases in serum alanine aminotransferase (ALT), aspartate aminotransferase (AST), and alkaline phosphatase (Figures S1L-S1N). The indicators for liver detoxification functions, i.e., serum hippurate and paraoxonase 1 (PON1) activity, were elevated in NB, but reduced in HB mice (Figures S1O and S1P). The reduced serum albumin in HB mice further implied impairment in liver function (Figure S1Q). To examine whether erythrocyte hemolysis contributed to H-bili, hematology was performed. Although HB mice exhibited leukocytosis, there were no differences in hematocrits between ICD-fed HB, NB, and WT mice (Table S2). Lack of hemolytic anemia or defects in hepatic bilirubin conjugation suggested that the H-bili was likely due to a chronic liver disorder.
Prolonged Feeding of Fermentable Fiber to T5KO Mice Potentiates Hyperbilirubinemia and Icteric HCC
Gross analysis of liver following 6 months of ICD feeding revealed that ~40% of T5KO mice and 0% of WT mice developed multinodular HCC (Figures 1A and 1B) with elevated serum α-fetoprotein (AFP) (Figure 1C). Tumors were primary and liver-specific, displaying a trabecular pattern, mitotic figures, anisocytosis, cell swelling, apoptotic bodies, ectopic lymphoid aggregates, and formation of atypical bile ducts (Figures 1D–1I) with the tumor demarcated by the substantial loss and distorted reticulin network (Figure 1I, iii). Increased expression of cytokeratin-19 (CK-19) was observed in certain regions of the tumor with atypical bile ducts, suggesting potential involvement of biliary cholangio-cytes (Figure 1I, iv). In contrast, non-tumor regions exhibited inflammation, hepatic lipidosis, necrosis, and anisocytosis. No histological signs of tumorigenesis were observed in adjacent organs (lungs, pancreas, kidney, and colon; data not shown). HB mice were moribund that required euthanasia at 12–14 months of age (Video S1). Large tumor nodules spanning the entire liver were observed upon exitus (Figure 1J).
Figure 1. Dietary Soluble Fiber Inulin-Induced Icteric Hepatocellular Carcinoma in Innate Immune-Deficient Mice.

(A) Macroscopic liver images (yellow arrows indicate multinodular HCC in T5KO + Inu-HB, HCC incidence: ~40%).
(B) Average number of liver tumors.
(C) Serum α-fetoprotein (AFP).
(D) (i-vi) H&E stained liver sections (scale bar, 1 mm). The boxed regions in (i-iii) are magnified (iv-vi, scale bar, 100 μm). Dotted line demarcates the tumor and non-tumor region.
(E and F) Presence of (E) trabecular pattern (black square), mitotic figures (yellow arrow), and necrotic hepatocyte (black arrow, scale bar, 100 μm) and (F) bile ducts (black arrow, scale bar, 50 μm).
(G) Masson’s trichrome staining (scale bar, 100 μm).
(H) Liver histology score.
(I) Staining for (i) lipid (scale bar, 20 μm), (ii) collagen (scale bar, 20 μm), (iii) reticulin (black line, scale bar, 100 μm), (iv) cytokeratin 19 (scale bar, 50 μm,) proliferating cellular nuclear antigen (PCNA, scale bar, 20 μm), (vi) Ki67 (scale bar, 20 μm), and (vii) glypican (scale bar, 20 μm).
(J) (i) Gross appearance of T5KO + Inu-HB livers at indicated time points. (ii) PCNA staining (scale bar, 50 μm). The data are representative of 4 independent experiments and from 3 different facilities.
See also Figures S1, S2, and S3, Table S2, and Video S1.
HCC incidence correlated strongly with H-bili (i.e., 100% in HB and 0% in NB mice). Serum bilirubin was elevated as early as 2 weeks to 6 months following ICD feeding and its levels strongly correlated with AFP (Figure S1R), whose upregulations marked all HCC-positive mice. These mice displayed hepatomegaly (Figure S1S), albeit with high variability, and liver steatosis with fibrotic (Figures 1G and S1T) and hyperproliferative hepatocytes (Figure 1I, v and vi). Elevated expression of glypican-3 (Figure 1I, vii) and lipidosis were observed in the livers from HB mice (Figure 1I, i). Several other markers of fibrosis and HCC were likewise elevated in the livers of HB mice (Figures S1T–S1U). HB livers also displayed increased cell death, as indicated by elevated caspase 3 and 9, but with a modest increase in Akt (Figure S1V). Even though serum lipids were lower in HB mice, they had higher hepatic neutral lipids, cholesteryl esters, and triglycerides (Figures S1W and S1X). Similar to male mice, female T5KO mice fed ICD also developed HCC, albeit with a reduced disease penetrance (~20% in females versus ~40% in males); such gender predilection is reminiscent of human HCC, which preferentially affects males (El-Serag and Rudolph, 2007).
ICD-Induced HCC in T5KO Mice Is Associated with Hepatic Inflammation but Independent of TLR4 and NLRC4
Despite susceptibility of T5KO mice to develop spontaneous colitis (Vijay-Kumar et al., 2007), neither HB or NB T5KO mice displayed signs of overt colitis. Yet, HB mice exhibited leukocytosis (Table S2), elevated serum and hepatic lipocalin 2 (Lcn2), and splenomegaly (Figures S2A–S2C). Moreover, extensive hepatic inflammation with substantial infiltration of neutrophils, macrophages, and T cells was observed in livers of HB, but not in NB nor WT mice (Figure S2D). Serum amyloid A was also elevated in HB mice (Figure S2E). Hepatic expression of pattern recognition receptors (PRR) such as Nlrc4 and Tlr2 were substantially elevated in HB mice, whereas only a modest increasing trend was observed for Tlr4 and Nlrp3 (Figure S2F). Expression of inflammatory mediators such as Mcp-1, Tnfα, Il17, and Cox2 was upregulated only in HB mice, although Il6 was elevated in both HB and NB mice (Figure S2G).
Spontaneous inflammation in T5KO mice is driven, in part, by compensatory upregulation of other PRR, such as TLR4 and NLRC4 (Vijay-Kumar et al., 2007). Hence, we next investigated whether genetic deletion of Tlr4 in T5KO mice may attenuate ICD-induced HCC. This was not the case as penetrance (~36%) and morphology of hepatic tumors in T5/Tlr4 double knockout (DKO) mice fed ICD was indistinguishable from the HCC observed in T5KO mice (data not shown). Nor did deletion of Nlrc4 confer any protection as ICD-fed T5/Nlrc4-DKO mice also displayed HCC (data not shown).
Phenotypes associated with TLR5 deficiency are not specific to this receptor per se, but are more aligned to the chronic inflammation arising due to innate immune deficiencies. Hence, we next investigated if mice with other discrete innate immune deficiencies might develop HCC following ICD feeding. Tlr4KO mice also developed H-bili and HCC following 6 months of ICD feeding, albeit at a lower penetrance (~17%, Figures S2H–S2K). Mice deficient in the innate immune protein, Lcn2 (Lcn2KO), likewise developed H-bili and HCC when fed ICD (~20%, Figures S2L–S2O). However, mice deficient in MyD88, which broadly mediates signaling by TLRs and inflammasome cytokines, did not develop HCC upon ICD feeding (Figures S2P–S2S). These results indicate that the induction of HCC by ICD does not absolutely require the loss of TLR5, but rather may result, in a MyD88-dependent manner, when a range of innate immune-dysregulated mice are fed on ICD.
HCC Can Be Induced by Soluble Fibers Pectin and Fructooligosaccharide but Not by Non-fermentable or Insoluble Fiber Cellulose
To elucidate whether other types of soluble fiber can promote HCC, we replaced ICD’s inulin (long-chain β-(2 → 1) polyfructosan) with pectin (α-(1 → 4) poly-D-galacturonate) (Table S1, pectin-contain diet [PCD]). After 6 months of feeding, 2 out of 15 (~13%) PCD-fed T5KO mice recapitulated the metabolic phenotype of HB mice, i.e., low body weight (data not shown), elevated serum bilirubin, ALT, and AFP and, moreover, developed multinodular HCC (Figures 2A–2F). Similar results were observed when the soluble fiber component was substituted with fructooligosaccharides (FOS) (short-chain β-(2 → 1) poly-fructosan), wherein 2 out of 16 T5KO mice (~12.5%) were positive for H-bili and HCC upon feeding of FOS-containing diet (FCD) for 6 months (Figures 2G–2L; Table S1). While such incidences of HCC in PCD and FCD fed mice were lower than the ~40%–50% observed in ICD-fed T5KO mice, the former is nonetheless a relatively high incidence as this disorder is extremely rare in mice (Caviglia and Schwabe, 2015). Reducing the amount of soluble fiber in the diet by ~70% (2.5% inulin w/w) was still sufficient to induce HCC (i.e., 4 out of 22 mice were positive for H-bili and HCC) (Figures 2M–2R). In contrast, T5KO mice fed a diet that lacked fermentable fiber and, rather, contained 10% cellulose (fermentation-resistant β-(1 → 4) D-glucose polymer, cellulose-containing diet [CCD]) did not develop HCC (Figures 2S–2V). Rather, CCD-fed T5KO mice exhibited hepatic steatosis and indices of metabolic syndrome (data not shown) analogous to what was previously observed for T5KO mice fed grain-based chow (Singh et al., 2015).
Figure 2. Soluble Fibers Pectin (PCD) and Fructooligosaccharides, but Not Insoluble Fiber Cellulose (CCD), Induced HCC in T5KO Mice.

(A-F) PCD-fed mice: (A) serum total bilirubin, (B) ALT, (C) AFP, (D) gross liver (~14% HCC incidence), and hepatic mRNA level of (E) fibrosis and (F) HCC markers.
(G-L) Fructooligosaccharides (FOS)-fed mice: (G) total bilirubin, (H) ALT, (I) AFP, (J) gross liver (~13% HCC incidence), and (K) hepatic fibrosis and (L) HCC markers.
(M-R) Low dose ICD-fed group: (M) total bilirubin, (N) ALT, (O) AFP, (P) gross liver (~16% HCC incidence), and (Q) hepatic fibrosis and (R) HCC markers.
(S-V) CCD-fed group: (S) total bilirubin, (T) ALT, (U) AFP, and (V) gross liver (0% HCC incidence). Red circles represent mice with high serum bilirubin that developed HCC on 6 months feeding of indicated diets. Each dot represents the data from one mouse.
High-Fat Diet-Enriched with Inulin Induces Icteric HCC in WT Mice and Aggravates Disease Severity and Penetrance in T5KO Mice
Consumption of a “western-style” high-fat diet (HFD) also induces dysbiosis and metabolic syndrome, thus leading us to consider whether HFD enriched with inulin might eventuate in HCC in WT mice. To address this hypothesis, we retained the fiber composition of ICD (Table S1) but replaced the base diet with an obesogenic high-fat diet (HFD-I). Most WT mice fed HFD-I for 6 months developed metabolic syndrome, although this was not the case for a subset of mice (4 out of 41) that displayed elevated serum bilirubin, AFP, and ALT (Figures S3A–S3C). Histological analysis revealed the presence of small well-differentiated tumors, albeit an apparently mild or early form of this disease, characterized by a trabecular pattern, increased cell proliferation, foci of inflammation, and fibrosis (Figures S3D–S3H) in WT HB mice. Incomplete penetrance, coupled with its low incidence (~10%) in HFD-I-fed WT mice might explain why we did not observe HCC in our prior study (Chassaing et al., 2015b; Zou et al., 2018).
Feeding HFD-I, but not HFD-cellulose, increased the incidence of HCC from ~40% to ~65% in T5KO mice (Figures S3I–S3N). These HCC-positive T5KO mice displayed attenuated indices of metabolic syndrome (data not shown), but elevated serum bilirubin, AFP, and ALT (Figures S3I–S3K). Unlike the modest HCC in WTHB mice, T5KO HB mice displayed multinodular HCC at the gross and histological level (Figures S3L–S3N). These findings suggest that metabolic perturbation has a role in the progression of HCC, and induction of HCC upon consumption of soluble fiber is applicable to WT mice, at least in the context of HFD.
HCC-Prone T5KO Mice Displayed Gut Dysbiosis Characterized by an Increase in Fiber-Fermenting Bacteria and Proteobacteria
One consequence of innate immune deficiency is development of alterations in microbiota composition (i.e., dysbiosis). T5KO-associated gut dysbiosis was characterized by increased in total fecal bacterial load (i.e., ~2-fold in NB and ~3.5-fold in HB) when compared to WT mice (Figure 3A). Dissimilarity in constitution of gut microbiota between ICD-fed HB T5KO mice from NB T5KO and WT mice was noted via principal coordinate analysis (Figure 3B). There were no differences in relative abundance of Bacteroidetes and Firmicutes between these three ICD-fed groups. Yet, HB mice exhibited reduced Tenericutes, expanded Proteobacteria, and clearly reduced species richness and alpha diversity (Figures 3C–3E). Alteration in the make-up of microbial community due to diet was also observed between ICD- and CCD-fed T5KO mice (Figures 3F and 3G). Linear discriminant analysis effect size (LEfSe) identified 753 bacterial taxa that were differentially altered between ICD-fed HB, NB, and WT mice. Taxonomy cladograms from LEfSe analyses revealed that Clostridia predominantly distinguished HB from the other groups (Figures 3H and 3I). Clostridia members (phylum Firmicutes) comprise a constellation of fiber-fermenting bacteria, particularly the Clostridium cluster XIVa, which are the main producers of butyrate and secondary bile acids (Van den Abbeele et al., 2013). In addition, the phylum Proteobacteria was also found to be strongly associated with H-bili. Overgrowth of Proteobacteria was noteworthy as it occurs in a spectrum of disease states and is implicated in hepatocarcinogenesis in humans (Grąt et al., 2016). Furthermore, metagenome prediction analysis identified enrichment in genes encoding for fatty acid/lipid biosynthesis as well as motility/secretion (data not shown) in HB mice. These results correlated with the increased microbiota byproducts (i.e., LPS, flagellin) in the gut of HB mice and the markers of their systemic dissemination (Figures 3J–3N).
Figure 3. T5KO Mice with Soluble Fiber-Induced HCC Displayed Profound Alterations in Gut Microbiota Composition and Systemic Dissemination of Microbial Products.

(A) Total fecal bacterial load.
(B-G) Fecal microbiota composition was analyzed by 16S rRNA sequencing: (B) principal coordinate analysis (PCoA) plot, (C) abundance of major bacterial phyla (%), (D) γ-proteobacteria, (E) rarefaction curves of OTUs observed at various sequencing depths, (F) PCoA plot, and (G) rarefaction curves of OTUs.
(H and I) Taxonomic cladogram from LEfSe analysis. Taxa specifically increased were colored as follows: (H) red, WT-Inu; green, T5KO + Inu-NB; blue, T5KO + Inu-HB; (I) red, T5KO + Inu-NB; green, T5KO + Inu-HB.
(J and K) Quantification of fecal (J) LPS and (K) flagellin.
(L and M) Serum immunoreactivity to (L) LPS and (M) flagellin.
(N) Immunoblot of serum immunoreactivityto E. coli proteins (arrows showing new bands/increased intensity in T5KO-inu-HB mice). The data are representative of 2 independent experiments.
See also Figure S4.
Dissimilar HCC induction by the different diets (i.e., ICD, PCD, FCD) could be due to structural differences in soluble fibers that are unlikely to be fermented equally, thus resulting in a disparate repertoire of metabolites. Metabolomics assessment of cecal contents indicated that acetate levels were comparable between T5KO mice fed ICD and CCD, but elevated in T5KO mice fed PCD and FCD (Figure S4A). A similar trend was observed in WT mice. Cecal propionate levels were similar in all WT and T5KO groups fed on these diets (Figure S4B). Cecal butyrate was greatly enhanced in ICD-fed HB mice along with modest elevation in PCD-fed and FCD-fed HB mice when compared to CCD-fed T5KO mice (Figure S4C).
Proneness of T5KO Mice to ICD-Induced HCC Is Microbiota-Dependent and Transmissible to WT Mice via Cohousing or Cross-Fostering
Metabolic syndrome in T5KO mice is predominantly driven by the acquired gut dysbiosis, which is dependent on the microbes present in the facility in which the mice are raised (Letran et al., 2011; Singh et al., 2015). We hypothesized that perhaps ICD feeding may not induce HCC in T5KO mice reared in a manner that does not result in severe dysbiosis. Indeed, “non-dysbiotic” T5KO mice (Letran et al., 2011) procured directly from Jackson Laboratories failed to develop icteric HCC upon ICD feeding (data not shown), whereas mice bred independently in Pennsylvania State University, Georgia State University, and University of Toledo consistently displayed 35%–50% incidence of HCC upon ICD-feeding in repeated experiments. Liver-specific T5KO mice, having an intact intestinal TLR5 (Etienne-Mesmin et al., 2016), also did not develop icteric HCC upon ICD feeding (Figures S4D–S4G).
To investigate the role of gut microbiota in ICD-induced HCC, we co-housed dysbiotic T5KO mice with WT mice, thus allowing the transfer of microbiota via coprophagy. Co-housing of WT and T5KO mice while maintained on ICD resulted in the development of HCC in both strains by 6 months (Figures 4A–4F). The development of HCC in cross-fostered WT mice (Figures 4G–4L) following ICD feeding further affirmed the role of microbiota in ICD-induced HCC. However, the cross-fostered T5KO mice were not protected from ICD-induced HCC (data not shown). Notably, microbiota ablation with broad-spectrum antibiotics mitigated HCC in ICD-fed T5KO mice (Figures S4H–S4K). Only 1 out of 12 antibiotic-treated T5KO mice exhibited a slight increase in serum bilirubin, AFP, ALT, but no tumors were evident. Moreover, germ-free T5KO mice fed irradiated ICD did not recapitulate either H-bili or HCC (Figures 4M–4P). Altogether, these findings indicate that a dysbiotic microbiota is required to develop HCC upon prolonged feeding with ICD and suggest that such oncogenic microbiota is transmissible to susceptible hosts.
Figure 4. ICD-Induced HCC Is Microbiota-Dependent.

(A-F) Co-housed group (n = 12): serum (A) total bilirubin, (B) AFP, (C) and ALT, and (D) gross liver (~17% HCC incidence). (E) H&E (scale bar, 100 μm) and (F) PCNA (scale bar, 20μm) -stained liver sections.
(G-L) Cross-fostered group: serum (G) total bilirubin, (H) AFP, (I) ALT, and (J) gross liver (~16% HCC incidence). (K) H&E (scale bar, 100 μm) and (L) PCNA (scale bar, 20 μm)-stained liver sections.
(M-O) Germ-free (GF) T5KO group: (M) total bilirubin, (N) ALT, and (O) AFP.
(P) Gross liver (HCC incidence: conventional T5KO: ~45%; germ-free T5KO: 0%). Yellow arrows indicate tumor nodule. Red arrows point the PCNA-positive cells.
Prolonged Exposure to Butyrate Promotes Hepatocyte Proliferation and Liver Fibrosis
Among the major products of fiber fermentation, butyrate has been extensively studied for its ability to both inhibit and promote cell proliferation and tumorigenesis (Belchevaet al., 2014; Donohoe et al., 2012; Kaiko et al., 2016). Thus, we next examined the extent to which butyrate affects proliferation of hepatocytes. Butyrate at 5 mM level was found to be cytotoxic to a murine hepatocyte cell line (data not shown). On the contrary, lower doses of 0.05 mM exerted mitogenic effects and promoted proliferation of these hepatocytes (Figures S4L and S4M). No effect on hepatocyte proliferation was observed when treated with acetate or propionate at this concentration.
To investigate the applicability of such findings in vivo, we administered butyrate (100 mM) in drinking water to T5KO mice for 9 months. A large subset of butyrate-treated mice (~54%) displayed H-bili, hepatic inflammation, and upregulation of liver fibrosis and HCC markers, although no tumors were observed (Figures S4P–S4Z). Lack of tumorigenesis by butyrate alone suggests that ICD-induced HCC may require other metabolites/factors, possibly PRR ligands or bile acid dysmetabolism, although further studies are required to ascertain their contribution as a “second hit” to HCC pathogenesis.
Next, we investigated the hepatic proteome and metabolome of ICD-fed mice. Proteomic analyses revealed the upregulation and downregulation of various proteins in HB livers (data not shown). Notably, Lcn2 was upregulated in livers of HB mice, reflecting hepatic inflammation (Asimakopoulou et al., 2016). One downregulated tumor suppressor proteins in HB livers was glycine N-methyltransferase (GNMT; >50% decrease, data not shown) (Martinez-Chantar et al., 2008). HB mice also displayed an altered hepatic metabolome, characterized by elevated aromatic amino acids, lactate, choline, taurine, glutamine, and trimethylamine-N-oxide (TMAO) with increased expression of hepatic flavin monooxygenase 3 (data not shown).
Inhibition of Microbial Fermentation Protects T5KO Mice from ICD-Induced HCC
Our hypothesis that fermentation of inulin promotes HCC holds that its inhibition may reduce HCC incidence. To test this notion, we depleted butyrate-producing bacteria by administering metronidazole (Kaiko et al., 2016; Louis and Flint, 2007) to ICD-fed T5KO mice. Metronidazole-treated T5KO mice displayed a reduced cecal butyrate (Figure 5A) and butyrate-producers (data not shown). Remarkably, the incidence of HCC was reduced in metronidazole-treated T5KO mice fed ICD for 6 months, albeit not eliminated (Figures 5B–5E).
Figure 5. Targeting Butyrate Producers, Bacterial Fermentation, and Dietary Interventions Prevent HCC in ICD-Fed T5KO Mice.

(A-E) Metronidazole treatment group: (A) cecal SCFA, (B) total bilirubin, (C) AFP, (D) ALT, and (E) gross liver.
(F-J) β-acid treatment group: (F) cecal SCFA, (G) total bilirubin, (H) AFP, (I) ALT, and (J) gross liver (arrows indicate tumor nodules). HCC incidence: vehicle, ~39%; 2 ppm β-acid, ~10%; 20 ppm β-acid, 0%.
(K-O) ICD → CCD switch group: (K) total bilirubin, (L) AFP, (M) ALT, (N) TBA, and (O) gross liver (arrows indicate tumor nodules).
Next, we tested whether inhibiting bacterial fermentation by plant-derived β-acids from hops (Humulus lupulus) might reduce HCC in ICD-fed mice. β-acids are commercially used to preserve beer from spoilage (Sakamoto and Konings, 2003) and have been employed to inhibit hindgut fermentation of inulin in horses and cattle (Flythe and Aiken, 2010; Harlow et al., 2014). Treatment of ICD-fed T5KO mice with β-acids at 20 ppm dose lowered cecal butyrate (Figure 5F), without impacting gut bacterial loads (data not shown). Moreover, none of the T5KO mice that received 20 ppm β-acids along with ICD developed HCC. β-acids reduced incidence of HCC in a dose-dependent manner (Figures 5G–5J).
Last, we examined whether HCC initiated by ICD could be halted by removing fermentable fiber from the diet. We identified pre-HCC mice at 2 weeks of ICD feeding by screening for serum bilirubin as a surrogate marker. These HB mice were either continued on ICD or immediately switched onto CCD for the remainder of the 6 months. While ICD-fed HB mice developed robust HCC, those that were switched to CCD were substantially protected and displayed marked decreases in serum bilirubin, ALT, and AFP (Figures 5K–5O). Together, these results argue strongly that prolonged exposure to microbial fermentation of soluble fiber drives HCC development in ICD-fed dysbiotic mice.
HCC in ICD-Fed T5KO Mice Is Initiated with Cholestasis, Hepatocyte Death, and Neutrophilic Inflammation
To delineate the events initiating hepatocarcinogenesis, we identified HB mice following 2 weeks of ICD feeding for detailed analysis. Intriguingly, HB mice displayed a >10-fold elevation in serum total bile acid (TBA), when compared to NB and WT mice (Figure 6A). Retrospective analysis of sera from all HB mice, collected over the span of this study, confirmed that such cholemia is invariably present with cholestasis upon ICD-feeding (data not shown). Metabolomic analysis via liquid chromatography-mass spectrometry (LC-MS) affirmed that both primary and secondary bile acids were elevated in the serum of HB mice fed ICD for 4 weeks (Figure 6A). In contrast, levels of fecal bile acids in HB mice were substantially reduced or undetectable (Figure 6A, i-xiv). Differences in the hepatic bile acids between HB and NB were less remarkable, but nonetheless showed a trend of modest elevation in HB mice (Figure 6B, i-iii).
Figure 6. Dysregulated Bile Acid Metabolism in ICD-Fed Hyperbilirubinemic T5KO Mice.

(A) Bile acids in serum and feces: (i and ii) total bile acids, (iii-vii) unconjugated primary bile acids, (viii-xiii) conjugated primary bile acids, and (xiv) secondary bile acids.
(B) Bile acids in liver.
(C and D) Relative expression of genes encoding for bile acid synthesis, metabolism, and transport via (C) RNA-seq and (D) qRT-PCR in liver and terminal ileum.
See also Figure S6.
Following 4 weeks ICD feeding, HB mice displayed elevated hepatic expression of Cyp7a1 and Cyp8b1 (classical pathway) but reduced Cyp27a1 and Cyp7b1 (alternate pathway) (Figures 6C and 6D). Such impaired expression of genes required for bile acid uptake into hepatocytes, as well as genes encoding canalicular and basolateral exporters, in HB mice (Figures 6C and 6D) implied that their elevated serum TBA could be due to “leakage/spillover” into systemic circulation, rather than being secreted into the duodenum via gall bladder. Major bile acid transporters in the ileum were upregulated (Figure 6E), possibly as a mechanism to compensate for the defective gallbladder emptying. Moreover, RNA sequencing (RNA-seq) analysis showed that T5KO HB mice exhibited dramatic alterations in their hepatic transcriptome, compared to T5KO NB and WT mice (data not shown).
High concentrations of bile acids are cytotoxic to hepatocytes (Cai et al., 2017), presumably due to their detergent-like properties. Hence, we hypothesized that the elevated TBA might underlie the liver dysfunction in HB mice (Figures 7A–7D and S5A–S5C). This hypothesis was supported by our findings that butyrate induced hepatocyte death in the presence of secondary bile acids in vitro (Figures S4N and S4O) and that ~54% of T5KO mice maintained on butyrate treatment for 9 months exhibited cholemia (Figure S4U). TUNEL staining on HB livers illustrated the extensive cell death occurring in the regions proximity to the portal triad (Figures 7E–7G). This disproportionate apoptotic response was accompanied with increased levels of chemoattractants (i.e., KC and sICAM-1) and neutrophils infiltrating the liver at 4 weeks of ICD feeding (Figures 7H–7J, S5J, and S5U). Elevated levels of myeloperoxidase, elastase, and hepatocyte reactive oxygen species (ROS) (Figures 7K–7M) may have also contributed to hepatic damage. Furthermore, HB livers displayed more oxidative stress as indicated by elevated hepatic malondialdehyde (Figure 7N) and DNA damage as reflected by increased serum and urinary 8-hydroxy-2’-deoxyguanosine (Figure 7O).
Figure 7. Short-Term ICD Feeding Induces Hyperbilirubinemia, Apoptosis, and Neutrophil Infiltration in the Liver of T5KO Mice.

(A–D) One-month ICD fed group: (A) serum appearance, (B) total bilirubin, (C) ALT, and (D) gross liver.
(E–G) TUNEL-stained liver sections: (E) WT, (F) T5KO-NB, and (G) T5KO-HB. Positive cells in green, DAPI in blue. Scale bars, 50 μm (E and F); 100 μm (G).
(H) Liver KC.
(I) Serum sICAM-1.
(J-O) Hepatic (J) neutrophils (K) MPO (L) NE (M) ROS (N) MDA (O) 8-hydroxy-2’-guanosine (8-OH-dG) in serum and urine.
See also Figures S5 and S7
Following 2 weeks of ICD feeding, there was no change in levels of hepatic interleukin (IL)-1β, IL-6, tumor necrosis factor alpha (TNF-α), and KC, except reduction in interferon (IFN)γ, and a mild elevation of Lcn2 in HB mice (Figures S5D–S5I). Rather, evidence of hepatic inflammation was present at 4 weeks post-feeding. While such inflammation was primarily neutrophilic, hepatic CD8+ T cells were also increased; however, regulatory T cells were reduced with no change in B cells (Figures S5K–S5N). Hepatic triglycerides and cholesterol esters were elevated in the HB T5KO mice at both 2 and 4 weeks (data not shown), suggesting steatosis contributed to the liver phenotype. At 1 and 3 months, HB mice displayed lower body weights and fasting serum triglyceride and cholesterol (Figures S5O–S5Q), but with elevated serum bilirubin, ALT, and AFP (Figures S5R–S5T), when compared to NB mice. HB mice developed a progressively pronounced hepatic inflammation and fibrosis (Figures S5U–S5X), wherein 100% of mice with H-bili developed frank HCC within 6 months. Microscopic analysis at early time point showed hepatocyte swelling (Figures S5Y and S5Z), indicating emergence of pre-neoplastic lesions. Although we did not observe any satellite nodules in proximity to the primary tumor, our findings do not rule out the possibility that tumors had metastasized intrahepatically.
Next, we asked whether intervening with cholestyramine to specifically inhibit the enterohepatic recycling of bile acids could impact ICD-induced HCC. As anticipated, supplementing ICD with cholestyramine to HB mice substantially reduced their serum total bilirubin and ALT, but no change in AFP and TBA (Figures S6A–S6D). More importantly, these mice do not display visible tumors at the gross or histologic level. However, these outcomes do not rule out that the HCC may be delayed, rather than prevented, as the livers of these mice still displayed abnormal internal structure (Figure S6E). It is likely that cholestyramine could only prevent the reabsorption of bile acids and thus mitigated the disease, but inadequate to abate the cholestasis and injury induced by ICD.
Taken together, our temporal analyses of HCC is consistent with the paradigms in cholestatic liver disease (Li et al., 2017). We propose that in dysbiotic mice, ICD feeding results in cholestasis and cholemia leading to hepatocyte injury that drives inflammation, compensatory cell proliferation that, together, eventuate in HCC. This model holds that one potential determinant of whether mice develop HCC is the nature and extent of their microbiota dysbiosis prior to initial consumption of ICD. To investigate this possibility, we analyzed the microbiota in mice that would later become NB or HB using fecal samples collected before and after 2 weeks of ICD feeding. We applied this strategy to 2 distinct colonies of T5KO mice maintained in vivaria at different institutions. In both cases, there was no broadly discernable distinction in overall microbiota composition between NB and HB mice (Figures S7A and S7B). However, there were some features of dysbiosis, i.e., elevation in the overall bacterial load and γ-protectobacteria, in mice that later developed H-bili (Figures S7C–S7F). Better understanding of the underlying processes of how dysbiosis, inflammation, and fermentation eventuate in HCC may yield strategies to prevent and treat this condition.
DISCUSSION
Approximately one-half of United States adults consume dietary supplements (Bailey et al., 2011) that are purported to improve health. The general goal of such supplements is to provide purified versions of specific beneficial components of foods long associated with health, especially fruits and vegetables. However, some consumers of these products develop adverse effects, including jaundice and cholestasis following intake of multi-ingredient plant-derived supplements (Navarro et al., 2017). Accordingly, the United States Drug-Induced Liver Injury Network (DILIN) study (Navarro et al., 2014) states that plant-derived, and purified, supplements are not universally harmless. The current study extends this concept to highly refined fermentable fibers, which we show can promote cholestasis and subsequently HCC in mice. Such findings should give pause to the common and increasing incorporation of such fibers into processed foods that might contribute to the recently defined association of consumption of ultra-processed foods with incidence of cancer (Fiolet et al., 2018). Thus, further studies are urgently needed to determine whether processed soluble fibers promote cholestasis and HCC in humans.
Consumption of a plant-based diet naturally abundant in fiber has been customarily associated with numerous health benefits. As such, it is presumed that enriching foods with fermentable fibers might be a practical means to improve the health of persons who consume highly refined foods that typically lack such fibers. Indeed, our published observations support this long and widely held notion. Specifically, we reported that mice consuming purified, compositionally defined diets (CDD) that lack fermentable fiber display gut atrophy, which is corrected by enrichment of such diets with inulin (Chassaing et al., 2015b). The administration of inulin to mice also improves metabolic parameters and protects against obesity (Zou et al., 2018). However, further study has led us to appreciate that consumption of processed foods enriched with purified fibers may have dire consequences in certain contexts. For instance, we observed that mice consuming inulin-enriched CDD develop severe colitis upon exposure to the chemical colitogen DSS (Miles et al., 2017). We herein report that prolonged feeding of fermentable fiber-enriched CDD to mice with pre-existing microbiota dysbiosis such as, but by no means limited to, T5KO mice, resulted in development of cholestatic HCC. In contrast, there were no indications of liver disease in T5KO mice that consumed similar amounts of inulin added to grain-based rodent chow (data not shown), which is a relatively unrefined conglomerate of food scraps that has classically served as the standard diet for rodents used in research. These results suggest that the dietary context (i.e., refined or unrefined diet) in which a fermentable fiber is consumed is of great importance and, in particular, caution against enriching highly refined foods with fermentable fibers.
To date, gut microbiota have been strongly implicated in hepatocarcinogenesis as a result of sustaining hepatic inflammation via activating TLR4 (Dapito et al., 2012) or producing cytotoxic secondary bile acids (Yamada et al., 2018; Yoshimoto et al., 2013). In this study, we report the potential concerted role for microbiota dysbiosis, SCFA and bile acid dysmetabolism, and hepatic inflammation in promoting HCC. The dysbiosis in HCC-developing mice fed ICD was marked by several key “signatures”: (1) increase in total bacterial load, (2) loss in species richness and diversity, (3) increase in Proteobacteria, (4) distinct enrichment of Clostridia spp. and other fiber-fermenting bacteria, and (5) atypical elevation of secondary bile acids in the systemic circulation. Enrichment of Proteobacteria is evident even before any dietary interventions in the T5KO mice, which eventually developed ICD-induced HCC. Keeping Proteobacteria species, a number of which are considered opportunistic pathogens, in-check is an important function of innate immunity in the gut. The failure to do so may explain why not only T5KO mice, but also Tlr4KO and Lcn2KO mice were prone to ICD- induced HCC.
We fully appreciate that a number of studies have observed the anti-tumorigenic effect of inulin and SCFA (Pool-Zobel, 2005). However, we speculate that generation of large amounts of butyrate in a context of dysbiosis, cholemia, and inflammation may instead create a tumor-promoting microenvironment that outweighs any of its beneficial effects. This consideration is in accord with the “butyrate paradox,” which argues that the ability of this SCFA to promote or impede cell proliferation is contextually dependent on the cell-type, time, and the amount of exposure (Donohoe et al., 2012). The doses of SCFA exceeding the threshold tolerable by the host have been shown to aggravate colonic inflammation (Kaiko et al., 2016; Kim et al., 2013) and tumorigenesis (Belcheva et al., 2014; Misikangas et al., 2008; Pajari et al., 2003), induce urethritis and hydronephrosis (Park et al., 2016), and promote obesity by aggravating hepatic lipogenesis (Singh et al., 2015) and hyperphagia (Perry et al., 2016). Janssen et al. (2017) reported that feeding of guar gum (a soluble fiber comprised of mannose [β 1,4-linked] and galactose [1,6-linked]) for 18 weeks protected mice from diet-induced obesity but eventuated hepatic inflammation and fibrosis associated with increased plasma TBA and disrupted enterohepatic circulation). Although Janssen et al. (2017) did not observe HCC, their observations nonetheless reiterate that the intake of soluble fiber may not be beneficial to the liver in the absence of a functional gut microbiota.
In summary, our study documents the unexpected observation that prolonged consumption of fermentable fiber enriched foods by mice prone to dysbiosis results in HCC. Such HCC, first observed in, but not limited to, T5KO mice, is reminiscent of human icteric HCC encompassing key features of progressive cholestasis, steatohepatitis, and tumorigenesis (Arteel, 2013). The most intriguing and key finding of this study is the absolute requirement of soluble fiber-feeding to develop HCC. We demonstrated that interventions that deplete butyrate-producing bacteria, inhibit gut fermentation, exclude soluble fiber from the diet, or prevent enterohepatic recycling of bile acids, are feasible strategies to mitigate such ICD-induced HCC. The identification of oncogenic bacteria, however, remains elusive and is complicated by the extent to which gut bacteria participate in inter-species cross-feeding of SCFA (Wrzosek et al., 2013). Yet, it is intriguing to note that our observations on the adverse effects of fermentable fiber is not restricted to inulin alone, but broadly applicable to other types of soluble fibers, including pectin and FOS. Future studies will certainly be needed to disentangle the “harmful” from the “beneficial” aspects of gut fermentation, thus paving the way for personalized use of fermentable fiber to safely promote health.
STAR★METHODS
Detailed methods are provided in the online version of this paper and include the following:
CONTACT FOR REAGENT AND RESOURCE SHARING
Further information and requests for resources and reagents should be directed to and will be fulfilled by the Lead Contact, Matam Vijay-Kumar (matamvijay.kumar@utoledo.edu).
EXPERIMENTAL MODEL AND SUBJECT DETAILS
Mice
Toll-like receptor 5 (T5), Lipocalin 2 (Lcn2) deficient (T5KO & Lcn2KO respectively) mice were originally generated by Dr. Shizuo Akira, Japan on BL6 background. These mice were bred and maintained under specific pathogen-free condition at Georgia State University, Atlanta GA and at The Pennsylvania State University, University Park PA and at University of Toledo, Toledo OH. MyD88, and Toll-like receptor 4 deficient mice (Myd88KO & T4KO, respectively) were procured from Jackson Laboratories (Bar Harbor, ME). Mice lacking NLRC4 (Nlrc4KO), generated on C57BL/6J background were kindly provided by Dr. Vishva Dixit (Genen-tech, South San Francisco, CA). The above mice were bred with BL6 WT mice in our mouse colony to generate their WT littermates. In this study, 2nd – 4th generation male and female offspring of T5KO, Lcn2KO and WT littermates were used. Mice were housed in gang cages (n = 8-10 mice/cage) containing corn cob bedding (Bed-O-Cob, The Andersons Co.) and nestlets (Cat # CABFM00088, Ancare), and fed ad libitum (LabDiet5020 for breeders and LabDiet5001 for weaned mice) with unrestricted access to water throughout the study. Dietary interventions were initiated when mice were four weeks old and generally maintained up to six months, unless specified. The cages were housed at 23°C and underwent a 12-h light/dark phase cycle. The institutional animal ethical committees at Georgia State University, The Pennsylvania State University and University of Toledo approved the mouse experiments. Using an alpha of 0.05 (two-sided) and a power of 0.80, we calculated 5-7 mice per genotype (WT and T5KO) as the minimum number necessary to get a data that is statistically significant between control and diseased animals. We have appropriately adjusted the number of mice to minimum 15 per group to account for the 40% disease penetrance of HCC in T5KO mice and for the inevitable attrition associated with animal studies.
Cell line
Hepa-1c1c7 cells (CRL-2026) were obtained from ATCC and were maintained in a humidified incubator at 37°C with 5% CO2. Cells were cultured in complete αMEM media supplemented with 10% FBS, 100 units penicillin per mL, and 100 μg streptomycin per mL.
METHOD DETAILS
Diets
Inulin, a polyfructosan (Orafti® HP; Source: chicory root; inulin content: 100%; and degree of polymerization: > 23) was procured from Beneo (Tienen, Belgium). Pectin, a polygalacturonate (Source: Citrus Peel Sigma ≥ 74.0%) was purchased from Sigma. fructooligosaccharides (Orafti® P95, mainly contains oligofructose produced by partial enzymatic hydrolysis of chicory inulin, degree of polymerization: between 2 and 8) was purchased from Beneo (Tienen, Belgium). Diets composition is provided in table S1. The open-source diet (base diet: cat# D11112201) was adapted from AIN76 and AIN93 formulations to reduce sucrose levels and introduce a 10% total fiber content (2.5% inulin; 7.5% cellulose). To test our hypothesis, we reversed the fiber composition in the base diet to formulate an inulin-containing diet (ICD: cat# D12081401) comprised of 7.5% inulin and 2.5% cellulose. ICD containing lower dose of inulin (2.5% w/w) was comprised of 2.5% inulin and 7.5% cellulose (ICD-L, cat#D17013110). All diets were prepared by the Research Diets (New Brunswick, NJ). Mice were weaned at 22 days and maintained on grain-based chow (LabDiet 5001) diet for one week to acclimatize for solid food and stabilize their intestinal microbiota. Subsequently, mice were switched to inulin containing diet (ICD), cellulose containing diet (CCD), pectin containing diet (PCD), fructooligosaccharide containing diet (FCD), ICD supplemented with cholestyramine (2% w/w) or a high-fat diet containing inulin (HFD-I) or cellulose (HFD-C) (For detailed diet composition see Table S1) for six months. Body weight (bi-weekly) and food intake (every four weeks) were monitored. Mice were bled minimally via retro-orbital bleeding, and hemolysis-free sera were collected to measure the serum bilirubin and other parameters. Mice were stratified into two groups: 1-normal serum bilirubin (NB, 1–4.5 μmol/L), and 2- high serum bilirubin (HB, 6-8 μmol/L). To examine the early and late hepatocellular carcinoma (HCC), the NB and HB mice were euthanized at 1,3 and 6 months after maintaining them on above diets.
Co-housing
Male T5KO and WT mice were co-housed (4 weeks old) in gang cages. One week post co-housing, mice were switched to above purified diets for six months and monitored for body weight and other parameters, as described above.
Cross-fostering
Pregnant T5KO and WT mice were monitored every day, and immediately after birth (within ~4h) all the WT pups were housed with lactating T5KO dams. Similarly, same day born T5KO pups were housed with lactating WT dams. After three weeks, the crossfostered pups were weaned and used for dietary studies as mentioned above and monitored for HCC.
Administration of β-acids in drinking water
One-week post-weaning, male T5KO mice were simultaneously fed with vehicle or β-acids from Hops (Humulus lupulus; in 45% w/w in food-grade propylene glycol at 0, 2 or 20 ppm in drinking water) and ICD for six months and monitored for HCC. Control T5KO mice received food grade propylene glycol (in drinking water) as vehicle control along with ICD.
Microbiota depletion
Four-week-old male T5KO and WT mice were placed on a broad-spectrum antibiotics ampicillin (1.0g/L) and neomycin (0.5g/L) in drinking water (Vijay-Kumar et al., 2010). After one week, mice were placed on ICD along with antibiotics in drinking water for six months. Antibiotic water was changed weekly and this regimen of cocktail deplete more than 90% bacteria from the gut (Vijay-Kumar et al., 2010).
Metronidazole treatment
To specifically deplete the major fermenters (butyrate producers) mice were administered metronidazole (Alfa Aesar 1.0g/L) in drinking water 3 days before switching them to ICD. Mice were maintained on ICD for 6 months along with metronidazole and then analyzed for standard HCC markers.
Germ-free mice studies
Germ-free C57BL/6 WT and T5KO mice were maintained and bred in axenic conditions in isolators (Park Bioservices) as previously described (Chassaing et al., 2015a). GF-T5KO mice were removed from isolator, housed in ventilated ISOCage (Techniplast, West Chester, PA USA) and fed doubly irradiated (20-40 kGy) inulin-containing diet (Cat# D12081401-1.5Vi; Research Diets, New Brunswick, NJ USA) for 3 months and then analyzed for HCC markers. The control group (conventional T5KO mice) received the regular ICD for similar time.
Dietary intervention with cellulose
Four weeks old T5KO mice were fed on ICD for one month, and then analyzed for serum bilirubin. Subsequently, all high bilirubin mice were divided into two groups. One group (n = 5) maintained on ICD until 6 months, whereas, another group (n = 5) of mice were switched to cellulose containing diet for another 5 months and analyzed for HCC.
Food intake
Equal number of mice were housed in each cage and fed with a known amount of food for 24h. The remaining food was carefully collected and weighed. The food intake was expressed as g/mouse/day.
Blood glucose measurement
Mice were fasted overnight (15h), and blood glucose levels were measured by using glucose test strips and the glucometer (Nova Max, Waltham, MA USA).
Serum lipids and enzyme quantification
Mice were bled after 5h fasting and hemolysis-free serum was collected using serum separating tubes (BD Biosciences). Serum cholesterol, triglycerides, AST, ALT, LDH, and bilirubin, were measured by using biochemical kits from Randox Laboratories (Kearneysville, WV). Serum albumin and ALP were measured using Olympus AU680 chemistry analyzer (Beckman-Coulter, Brea CA) at the Comparative Clinical Pathology Services (Columbia, MO) under the supervision of a board-certified Veterinary Clinical Pathologist (Charles E. Wiedmeyer DVM, Ph.D.).
Liver lipids
As described earlier (Singh et al., 2015), the levels of liver triglycerides and cholesterol esters were quantified by gas chromatography (GC) with the help of NIH Mouse Metabolic Phenotyping Center (MMPC)/DTRC Lipid laboratory, Vanderbilt University, Nashville, TN USA.
Lipid peroxidation
Lipid peroxidation in liver was assayed by estimating the formation of thiobarbituric acid reactive substances (TBARs) according to the method described by Buege and Aust (1978). Weighted liver tissues were homogenized in ice cold 1.15% KCl to make 10% homogenate. Liver homogenates were incubated with 1mM FeSO4 and 1.5 mM ascorbic acid in 150 mM Tris-HCl buffer for 15min at 37°C. Next, TBA reagent (0.375% TBA and 10% TCA) was added to the samples and then incubated for 15 min in 80°C water bath. Sample absorbance at 535 nm was measured with a spectrophotometer. The amount of malondialdehyde (MDA) formed was quantified using the MDA molar extinction coefficient of 1.56 × 10⁵ M−1.
Hepatic transcriptome via RNA-Seq
RNA-seq analysis was performed by Arraystar, MD. Total RNA was extracted from liver tissues in biological triplicates from 4 weeks ICD-fed WT, T5KO-NB and T5KO-HB mice by using illustra RNAspin Mini Kit (GE Healthcare). RNA samples were quantified using Nanodrop and qualified by agarose gel electrophoresis. Illumina kits which include procedures of RNA fragmentation, random hexamer primed first strand cDNA synthesis, dUTP based second strand cDNA synthesis, end-repairing, A-tailing, adaptor ligation and library PCR amplification, were used for RNA-seq library preparation. Finally, the prepared RNA-seq libraries were qualified using Agilent 2100 Bioanalyzer and quantified by qPCR absolute quantification method. The sequencing was performed using Illumina Hiseq 4000.
Raw sequencing data generated from Illumina HiSeq 4000 that pass the Illumina chastity filter were used for the following analysis. Trimmed reads (trimmed 5’,3’-adaptor bases) are aligned to reference genome. Based on alignment statistical analysis (mapping ratio, rRNA/mtRNA content, fragment sequence bias), we determine whether the results can be used for subsequent data analysis. If so, the expression profiling, differentially expressed genes and differentially expressed transcripts are calculated. The novel genes and transcripts are also predicted. Principal Component Analysis (PCA), Correlation Analysis, Hierarchical Clustering, Gene Ontology (GO), Pathway Analysis, scatterplots and volcano plots were performed for the differentially expressed genes in R or Python environment for statistical computing and graphics.
Serum total bile acid quantification
Total bile acids (TBA) in hemolysis-free sera was measured using a TBA assay kit (enzyme cycling method; Diazyme Laboratories) according to the manufacturer’s protocol.
Bile acid profiles in sera, liver and feces via LC-MS
Targeted bile acid extraction and analysis by liquid chromatography-tandem mass spectrometry (LC MS/MS) (Waters Acquity - ABSciex 4000 Qtrap) on the sera, fecal, and liver samples (obtained from WT and T5KO mice fed ICD for 4 weeks) were performed by West Coast Metabolomics Center (UC, Davis).
Serum paraoxonase 1 assay
Paraoxonase 1 (PON1; arylesterase activity) assay was performed as described earlier (Dantoine et al., 1998). A 100x stock of 4-nitrophenyl acetate (Sigma) was prepared in methanol and diluted to 1mM with reaction buffer (9mM Tris, 0.9mM MgCl2, pH 8.0). Next, 200 μL of working 4-nitrophenyl acetate was added to 20 μL of diluted serum (1:50). Rate of p-nitrophenol generated was captured at 405nm (ε405 = 18,000 M−1:cm−1 at pH 7.4) over 30 min at 37°C on a microplate reader. One unit (U) was measured as 1 mole of p-nitrophenol generated/min.
Serum hippurate quantification
Serum hippurate (a complex of benzoic acid and glycine; a measure of liver conjugating activity) were measured as described by Zinalibdin and Yacob, (2013). Serum samples (25 μL) were mixed with equal volume of pyridine and 10 μL of benzenesulfonyl chloride and incubated for 30 min at 25°C. After incubation, 190 μL of absolute ethanol was added and centrifuged at 1500 g for 5 min. Supernatants (200 uL) was transferred to a new 96-wells plate and read at 417nm. Hippuric acid (Sigma, 1, 0.5, 0.25, 0.125, and 0 mg/mL) was used for generating standard curve.
Complete blood analysis
Mice were bled retro-orbitally, and blood was collected in EDTA (anticoagulant)-coated tubes and immediately analyzed for hematological parameters at Animal Diagnostic Laboratory, The Pennsylvania State University using HEMAVET 950FS analyzer (Gentle Health Care, Waterbury CT).
ELISA
Keratinocyte-derived chemokine (KC), α-fetoprotein, serum amyloid A (SAA), interleukin (IL)-6, IL-1β, tumor necrosis factor α (TNFα), interferon gamma (IFNγ), soluble intercellular adhesion molecule 1 (sICAM-1), and neutrophil elastase(NE) were measured by Duoset ELISA kits (R&D Systems; Minneapolis, MN) according to the manufacturer’s protocol. Mouse Insulin ELISA kit from EMD Millipore (Billerica, MA) was used to measure serum insulin. Feces (100mg) were suspended in 1 mL of PBS containing 0.05% Tween 20, vortexed, and spun at 14000 g for 5 min. The liver was homogenized in RIPA buffer containing protease inhibitor cocktail (100mg/ml). The fecal supernatant (1:20), liver homogenate (1:50), and serum (1:200) was diluted using reagent diluent, and Lcn2 levels were determined by ELISA kit from R&D Systems (Minneapolis, MN). Levels of 8-hydroxy-2’-deoxyguanosine and related oxidized guanine species (8-OH-dG) was measured in the serum and urine, as a marker for DNA/RNA oxidative damage, via an ELISA kit from Cayman Chemical (Ann Habor, MI).
Histochemical staining
Immediately after euthanasia, the liver, colon, lungs, kidney and pancreas were harvested and preserved in 10% neutral buffered formalin (NBF, Fisher Scientific) for 24h. A portion of liver and other tissues were submitted to the Penn State University Animal Diagnostic Laboratory and University of Toledo Microscopy Facility for paraffin-embedded sectioning, hematoxylin and eosin (H&E) staining, and Masson’s trichrome staining. Histology images were generated from VS120 Virtual Slide Microscope (Olympus) through the OlyVIA software.
Oil red O staining
NBF-fixed liver samples were dehydrated using 15, 20, 30% sucrose gradient and embedded in optimal cutting temperature (OCT) compound in a cryomold. The cryomold was snap-frozen on dry-ice. Frozen sections (10 microns) generated using Cryostat (Leica Biosystems CM3050 S) were used for Oil red O staining to monitor steatosis. In brief, sections were kept in PBS for 10 min. and briefly washed with 60% isopropanol. Liver sections were placed in Oil red O (Sigma-Aldrich, St. Louis, MO) solution (0.5% in 60% isopropanol) for 30 min. Afterward, sections were briefly rinsed with 60% isopropanol to remove the non-specific staining and counter-stained with Mayer’s hematoxylin (Sigma-Aldrich, St. Louis, MO).
Picrosirius red staining
Picrosirius red staining was used to observe the collagen accumulation in the liver. Briefly, deparaffinized liver (5 microns) sections were incubated with picrosirius red (0.1% sirius red in saturated picric acid) solution for one hour and quickly washed with acidified water (0.5% acetic acid). Collagen was selectively visualized as bright orange-red birefringent fibers and the image acquired under polarized light microscope.
Immunohistochemical staining
Immunohistochemical staining was performed on paraffin-embedded liver sections (5 microns) for immune cell infiltration [Ly6G (1:200), F4/80 (1:50), & CD3 (1:200)], cell proliferation [PCNA (1:2000), & Ki67 (1:250)], hepatobiliary tract (Cytokeratin 19; 1:100) and HCC markers (glypican-3; 1:200). Source of all antibodies are incorporated in key resources table. Immunoreactivity was revealed by using Vectastain Elite ABC kit and peroxidase substrate kit (Vector Laboratories, Burlingame, CA). Similar exposure time for each section was used to acquire the image. Liver reticular fiber was stained using the reticulin silver plating kit (EMD Millipore, MA) according to the manufacturer’s protocol.
TUNEL assay
Five-micron sections of paraffin-embedded mouse liver were used for the detection of apoptotic/cell death using cell death detection kit from Roche. Briefly, after deparaffinization, the sections were treated with proteinase K. After permeabilization, the sections were incubated with the TUNEL-mixture as per manufacturer’s protocol. The sections were imaged and analyzed by Olympus OlyVIA.
Isolation of hepatocytes and immune cells from liver
Liver hepatocytes and immune cells were isolated by using the Percoll gradient method. The liver was thoroughly perfused with 20 mL of sterile PBS (pH 7.0) and was grinded and gently passed through a 100-μM cell strainer (BD) to remove tissue debris and resuspended in digestion buffer (DMEM containing 0.04% (w/v) collagenase IV, 0.002% DNase and 5% BSA). The cell suspension was agitated in a rotary shaker (200 rpm) for 15 min, at 37°C. Next, the cell suspension was centrifuged at 1500 rpm and the pellet was resuspended in 33% Percoll solution and then loaded on the layer of 80% Percoll solution followed by centrifugation at 2000 rpm for 20 min at room temperature. After centrifugation, the upper layer (hepatocytes) was collected and immune cells were aspirated carefully from the Percoll interface and washed twice with Hanks’ Balanced Salt solution (HBSS). An aliquot of freshly isolated hepatocytes and immune cells were stained with trypan blue to evaluate cell viability and determine total cell number in a hemocytometer. The purity and viability of hepatocytes were > 90% and hepatic immune cells were > 85%.
Flow cytometric quantitation of hepatocyte ROS
To measure intracellular ROS, hepatocytes (5×10⁵ cells) were incubated with 5.0 μM CellROX® Deep Red dye for 30 min at 37°C in the dark and washed twice with PBS. Fluorescence was measured by flow cytometry (Accuri C6, BD Biosciences) and analyzed via BD Accuri C6 Software. Intracellular ROS was expressed by mean fluorescence intensity (MFI).
Flow cytometric analysis of hepatic immune cells
Hepatic immune cells (2.0×10⁵ cells) were stained with fluorophore-conjugated anti-mouse mAbs from BD Biosciences directed against the following cell surface proteins: CD11b-FITC, F4/80-PE, Ly6G-APC, CD3-PE, CD4-PE-Cy7, CD8-FITC, CD19-APC in staining buffer and incubated for 30 min at room temperature in the dark. Cells were washed in PBS, fixed and permeabilized with FoxP3 Staining Buffer Kit according to manufacturer’s instructions and incubated with FoxP3-Alexa fluor for 1h at room temperature. Cells were washed twice in FACS Buffer and were analyzed by Accuri C6 flow cytometer (BD Biosciences) with BD Accuri C6 Software (Becton Dickinson). Immune cells were defined by using surface markers: neutrophils CD11b+Ly6G+F480−, and macrophages CD11b+Ly6G−F480+.
Immunoblotting
Liver protein (40 μg) lysate in radioimmunoprecipitation assay (RIPA) buffer with protease inhibitor cocktail was separated by electrophoresis using 4%–20% gel under reducing condition. The proteins were transferred to PVDF membrane, blocked with 5% nonfat dry milk and probed for Lcn2 (1:1000) (R&D Systems), Akt (1:1000), cleaved caspase 3 (1:1000), and caspase 9 (1:1000) (Cell Signaling) using respective antibodies (1:1000). Immunoblots were developed using ECL chemiluminescent reagent. GAPDH was used as a loading control.
Serum immunoreactivity to bacterial proteins
E. coli (K12 strain; BW25113, Coli Genetic Source Center, Yale University) was grown overnight in Luria-Bertani (LB) medium. The bacteria were pelleted by centrifugation, lysed in RIPA buffer (Cell Signaling) containing protease inhibitor cocktail (Roche). Proteins (40ug) were fractionated via SDS-PAGE, transferred to PVDF membrane and probed with WT, T5KO N-Bili and H-Bili sera (1:1000 as primary antibody) for overnight at 4°C and 1h with anti-mouse HRP (1:000) (Cell Signaling). LI-COR Odyssey CLX method was used to develop the immunoblot.
Serum immunoreactivity to LPS and flagellin
Serum immunoreactivity to LPS and flagellin were examined by ELISA as described previously (Ziegler et al., 2008). High-binding ELISA plates were coated overnight with purified flagellin (100 ng/well) or LPS (2 μg/well; from E. coli 0128: B12, Sigma) in 9.6 pH bicarbonate buffer. Sera were diluted 1:200 and added to wells coated with flagellin or LPS. After incubation at 37°C for 1h, the wells were washed and then incubated with HRP-conjugated anti-mouse IgG (1:1000). After washing, the peroxidase substrate tetrame-thylbenzidine (TMB) was added to the wells and, after 5 min, optical density (OD) was read at 450 nm with an ELISA plate reader. Data are reported as OD corrected by subtracting with the readings in blank samples.
Fecal microbiota analysis by 16S rRNA sequencing
16S rRNA gene sequencing was performed as previously described (Chassaing et al., 2015a), with data deposited in the European Nucleotide Archive under accession number PRJEB28447. Sequences were demultiplexed, quality filtered using the Quantitative Insights Into Microbial Ecology (QIIME, version 1.8.0) software package, and forward and reverse Illumina reads were joined using the fastq-join method. We used QIIME default parameters for quality filtering (reads truncated at first low-quality base and excluded if: (1) there were more than three consecutive low quality base calls; (2) less than 75% of read length was consecutive high quality base calls; (3) at least one uncalled base was present; (4) more than 1.5 errors were present in the barcode; (5) any Phred qualities were below 20; or (6) the length was less than 75 bases). Sequences were assigned to OTUs using the UCLUST algorithm with a 97% threshold of pairwise identity (with or without the creation of new clusters with sequences that do not match the reference sequences) and classified taxonomically using the Greengenes reference database. Alpha diversity curves were determined using the determination of the number of observed OTUs. Beta diversity was analyzed using principal coordinate analysis of the unweighted Unifrac distance. LEfSE (LDA Effect Size) was used to investigate bacterial members that drive differences between groups. PICRUSt (Phylogenetic Investigation of Communities by Reconstruction of Unobserved States) was used to predict the metagenome-based on microbiota composition analysis. A closed-OTU picking strategy was using against the Greengenes reference database 13-8, and predicted metagenomes were analyzed. Predicted metagenomes were categorized at level 2 of the Kyoto Encyclopedia of genes and genomes (KEGG) pathways and principal coordinates of the beta diversity was analyzed using Euclidean method with QIIME. Predicted metagenomes were categorized at level 3 of the Kyoto Encyclopedia of genes and genomes (KEGG) pathways, and gene-E was used for heatmap representation of pathways with a significantly altered abundance in one group compared to another.
Preparation of fecal extracts
Feces were collected from WT, T5KO N-Bili and H-Bili mice and immediately homogenized in sterile PBS (100 mg/ml), followed by 3x freezing and thawing followed by sonication. Clear fecal extracts were collected after centrifugation at 20,000 g (15 min, 4°C). The fecal extract was kept at −20°C until analyzed.
Hepatocytes culture and treatment
Mouse hepatocyte cell line (Hepa-1c1c7; ATCC CRL-2026) were grown in complete αMEM media with 10% FBS and penicillin and streptomycin in 6 or 24 well plates. Confluent cells were stimulated with acetate, propionate or butyrate at different concentration in serum-free media for 6, 24 and 72 h. Cells were harvested and used either for RNA isolation or flow cytometry analysis. In another set of experiment, Hepa-1, 6 cells were stimulated with 10 μl fecal extracts (100 mg/ml in sterile PBS) from WT, T5KO N-Bili and H-Bili mice for 24 h. Salmonella flagellin (1 μg/ml), E. coli LPS (100 ng/ml) were used as positive controls. Cell supernatants were analyzed for Lcn2 and KC via ELISA.
Hepatocyte proliferation assay
Hepa-1c1c7 cells (ATCC CRL-2026) were stained with 0.5 μM carboxyfluorescein succinimidyl ester (CFSE) for 7 min in the dark at 37°C. Cells were washed thrice with cold PBS containing 5% FBS and cultured in the presence of acetate, propionate or butyrate (0.05 mM) for 72 h in 24 well plates (1×10⁶ cells/ml). The proliferation of CFSE-stained cells was analyzed by quantifying the degree of CFSE dilution in proliferated cells via flow cytometry (BD LSR-Fortessa, BD Biosciences). FlowJo software (Becton Dickinson) was used to analyze the results. Data presented in the histogram indicate CFSE-labeled Hepa-1,6 cells.
Hepatocyte cytotoxicity assay
The cytotoxicity in Hepa-1c1c7 cells (ATCC CRL-2026) were measured using CellTiter 96® AQueous Solution (Promega) according to the manufacturer’s protocol. Briefly, Hepa-1c 1c7 cells (5×10⁴ cells/well in 200 μl αMEM media) were incubated with bile acids (cholate, chenodeoxycholate, lithocholate, deoxycholate, taurodeoxycholate, or glycodeoxycholate; 0.05 or 0.5 mM) in presence or absence of butyrate (0-0.5 mM, 1 h pre-incubation) for 24 h at 37°C. Cell titer solution were added (20 μl per well) and incubated for 3 h at 37°C; the absorbance was measured at 490 nm on a microplate reader. Results were calculated and expressed as % viability, relative to untreated cells.
Quantification of fecal flagellin and LPS
Levels of fecal bioactive flagellin and lipopolysaccharide (LPS) were quantified using human embryonic kidney (HEK)-Blue-mTLR5 and HEK-Blue-mTLR4 cells, respectively (Invivogen, San Diego, CA, USA). Feces were suspended in PBS to a final concentration of 100 mg/mL and homogenized for 10 s using a Mini-Beadbeater-24 without the addition of beads to avoid bacterial cell disruption. Samples were centrifuged at 8000 g for 2 min, and the supernatant was serially diluted and used for the above cell stimulation. Purified E. coli flagellin and LPS (Sigma-Aldrich) were used for standard curve determination using HEK-Blue-mTLR5 and HEK-Blue-mTLR4 cells, respectively. After 24 h of stimulation, the cell culture supernatant was applied to the QUANTI-Blue medium (Invivogen, San Diego, CA, USA) and the alkaline phosphatase activity was measured at 620 nm after 30 min.
Colonic myeloperoxidase assay
Frozen or freshly collected colon tissue (50 mg) was homogenized in 1 mL of potassium phosphate buffer (50 mM, pH 6.0) containing 0.5% hexadecyl trimethyl ammonium bromide (HTAB), freeze-thawed (thrice), sonicated, and centrifuged (10000 g, 4°C). The clear supernatants were collected for measuring myeloperoxidase (MPO) activity. The reaction was initiated by adding final concentrations of 50 mM guaiacol and 0.002% H2O2 to the clear supernatant in the 96-well plate (Corning). The change in absorbance at 470 nm was measured over a period of 10 min at 1-min intervals. One unit of MPO activity was defined as the amount that increases absorbance at 470 nm by OD of 1.0 per minute at 25°C, calculated from the initial rate of reaction.
Quantitative Reverse-Transcription PCR
Liver samples from various groups including CCD, ICD, PCD, FCD-fed (for 6 months) WT and T5KO mice were analyzed for inflammation, fibrosis and HCC markers. Liver tissues from 4 weeks ICD-fed WT and T5KO mice were employed to examine the relative expression of genes encoding for inflammation, fibrosis, HCC and bile acid metabolism, transport and secretion. RNA was extracted from liver and colonic tissue using TRI reagent (Sigma) as per the manufacturer’s protocol. The cDNA was synthesized from 800 ng of purified RNA using the qScript cDNA Synthesis Kit (Quanta BioSciences). Quantitative PCR was performed using the Step One Plus Real-Time PCR System (Applied Biosystems) in a 24μL reaction mixture containing cDNA, SYBR Green Master Mix (Quanta BioSciences), and mouse-specific oligonucleotides (Table S3). The 36B4, HPRT and β-actin gene were used as internal standards. The data were expressed as a relative fold-change in comparison to the control.
Liver proteomic analysis
Liver samples were lysed by bead beating in a buffer composed of 75mM NaCl (Sigma), 3% sodium dodecyl sulfate (Fisher), 1mM sodium fluoride (Sigma), 1mM beta-glycerophosphate (Sigma), 1mM sodium orthovanadate (Sigma), 10mM sodium pyrophosphate (Sigma), 1mM phenylmethylsulfonyl fluoride (Sigma) and 1X Complete mini EDTA-free protease inhibitors (Roche) in 50mM HEPES (Sigma), pH 8.5. Proteins were digested in a two-step process with LysC (Wako) and trypsin, then samples were desalted with C18 Sep-Paks (Waters) as previously described (Tolonen and Haas, 2014).
Samples were labeled with 10-plex TMT reagents (Thermo Scientific) as previously described (McAlister et al., 2014). Fractionation was carried out by basic pH reverse-phase liquid chromatography with fraction combining as previously described (Tolonen and Haas, 2014). Fractions were dried and re-suspended in 8 μL of 5% formic acid/5% acetonitrile and analyzed by LC-MS2/MS3 for identification and quantitation.
LC-MS2/MS3 experiments were conducted on an Orbitrap Fusion (Thermo Fisher Scientific) with an in-line Easy-nLC 1000 (Thermo Fisher Scientific). The Orbitrap Fusion was run in data-dependent mode; a survey scan was collected over 500-1200 m/z at a resolution of 120000 in the Orbitrap. MS2/MS3 analysis, top speed mode was enabled to select the most abundant ions for analysis in a 5 s cycle. For MS2/MS3 analysis, the decision tree option was used, with charge state and m/z range as qualifiers. MS3 analysis was conducted using the synchronous precursor selection (SPS) option to maximize TMT quantitation sensitivity. Centroided data were collected for all MS3 scans.
Resultant data files were processed using Proteome Discoverer 2.1 (Thermo Fisher Scientific). MS2 data were queried against the Uniprot Mouse database using the Sequest algorithm (Eng et al., 1994). A decoy search was also conducted with sequences in reversed order (Elias and Gygi, 2007). Data were filtered to a 1% peptide and protein level false discovery rate using the target-decoy strategy (Elias and Gygi, 2007). Reporter ion signal to noise values were used for quantitation. Spectra were used if the average signal to noise was greater than 10 across samples and if isolation interference was less than 25%. Data were normalized in a two-step process, whereby they were first normalized to the mean for each protein. To account for variation in the amount of protein labeled, values were then normalized to the median of the entire dataset. Final values are reported as normalized summed signal to noise per protein per sample.
SCFA quantification
Sample preparation
At termination, mice were maintained in fed state and euthanized in the early morning as rodents eat and drink primarily at night. Ceca was collected and stored immediately in dry ice. The cecal contents were weighed and processed in the cold room to avoid loss of SCFA. In brief, ~50 mg cecal contents were mixed in 1 mL of 0.005 M aqueous NaOH containing 5 μg/mL d3-caproic acid, vortexed using Fast-Prep-5G homogenizer (M.P. Biomedicals), and spun at 20,000 g for 15 min. The supernatants (500 μL) were collected in a glass scintillation vial and mixed with equal volume of 1-propanol: pyridine (v/v = 3:2). Next, 100 uL of propyl chloroformate was slowly added to the above mixture and incubated at 60°C for one hour. The derivatized samples were extracted with hexane and transfer the supernatant to a glass autosampler vial for GC-MS analysis.
GC-MS analysis
Analysis of the SCFA was performed using a Shimadzu GC-2010 gas chromatography system coupled with a QP20 10 EI mass spectrometric detector (GCMS-QP2010, Shimadzu, Kyoto, Japan). Propylated derivatives of the SCFA were separated using a Supelco SPB-5 fused silica column (30 m length, 0.25mm diameter, 0.25 μm thickness, Supelco, Bellefonte, PA). One microliter of derivative dissolved in hexane was injected using split mode (1:6 split ratio), a solvent delay of 2.5 min, and a gas flow rate of 0.42 mL/min with helium as the carrier gas. The injection port temperature was set at 220°C. The initial oven temperature of 50°C was held for 3 min and then increased at a rate of 7°C/min until 150°C was achieved. Then the rate was raised to 16°C/min and held at 250°C for 10 min. Mass spectral data were collected in scan mode, and both the interface and detector temperature were set at 200°C.
Shimadzu Post-Run Analysis software was used to process raw chromatogram data (GC-MS solution, Shimadzu, Kyoto, Japan). Multiple ion counts (MIC) were used to reduce noise and improve signal-to-noise ratios by selecting ions that were representative of the six targeted analytes. These ion counts were added together to obtain the MIC, and peaks areas were calculated. Areas of analyte peaks were compared to the internal standard (d3-caproate) and a standard mix to determine concentrations.
NMR spectroscopy
Liver and cecal content were extracted and analyzed using an optimized procedure described previously (Singh et al., 2015). All 1H NMR spectra of liver and cecal extracts were recorded at 298 K using a Bruker Avance III 600 MHz NMR spectrometer (operating at 600.08 MHz for proton, Bruker Biospin, Germany) equipped with an inverse cryogenic probe.
QUANTIFICATION AND STATISTICAL ANALYSIS
Statistical analysis
All data represent mean ± SEM. Each dot present in dot plots represent value from one mouse. The D’Agostino-Pearson omnibus normality test was used to test the normal distribution of data. Nonparametric tests were applied for the data, which do not pass normal distribution test. Statistical significance between two groups was calculated using unpaired, two-tailed t test. Data from more than two groups was compared using a one-way ANOVA followed by Dunnett’s post hoc test (when to compare the mean of each column with the mean control column) or Tukey’s multiple comparison tests (when to compare the mean of each column with the mean of every other column). The Spearman correlation (r) was used to establish the association of the two variables. *p < 0·05 was considered statistically significant. All statistical analyses were performed with the GraphPad Prism 7.0 program (GraphPad).
DATA AND SOFTWARE AVAILABILITY
The accession numbers for the unprocessed transcriptomic sequencing data and the unprocessed 16S sequencing data reported in this paper are European Nucleotide Archive: PRJEB28449 and PRJEB28447, respectively.
Supplementary Material
KEY RESOURCES TABLE
| REAGENT or RESOURCE | SOURCE | IDENTIFIER |
|---|---|---|
| Antibodies | ||
| Anti-Proliferating Cell Nuclear Antigen antibody | Sigma-Aldrich | Cat # P8825 RRID: AB_477413 |
| Glypican-3 antibody | Abbiotec | Cat # 251482 RRID: AB_10641641 |
| Neutrophil antibody [NIMP-R14]; Ly6G | Abcam | Cat# ab2557 RRID: AB_303154 |
| Rabbit Anti-CD3, T Cell Antibody | Sigma-Aldrich | Cat# C7930 RRID: AB_259074 |
| Ki67 antibody | Abcam | Cat# ab15580 RRID: AB_443209 |
| RAT ANTI MOUSE F4/80 antibody | Bio-Rad / AbD Serotec | Cat# MCA497G RRID: AB_872005 |
| Mouse Lipocalin-2/NGAL mAb (Clone 228418) | R&D Systems | Cat# MAB1857 RRID: AB_2136584 |
| Cleaved Caspase-3 (Asp175) Antibody | Cell Signaling Technology | Cat# 9661 RRID: AB_2341188 |
| Akt (pan) (C67E7) Rabbit mAb antibody | Cell Signaling Technology | Cat# 4691 RRID: AB_915783 |
| Caspase-9 (C9) Mouse mAb antibody | Cell Signaling Technology | Cat# 9508 RRID: AB_2068620 |
| Cytokeratin 19 Antibody (SPM561) | Novus Biologicals | Cat #: NBP2-34379 |
| Chemicals, Peptides, and Recombinant Proteins | ||
| Metronidazole | Alfa Aesar | Cat#: H6025814 |
| Cholestyramine | Sigma-Aldrich | Cat#: C4650 |
| Inulin | Beneo | Cat#: Orafti® HP |
| FOS | Beneo | Cat#: Orafti®P95 |
| Pectin | Sigma-Aldrich | Cat#: P9135 |
| Sodium butyrate | Sigma-Aldrich | Cat#: 303410 |
| Hops β-acid | MDF lab; This paper | N/A |
| Cholic acid | Sigma-Aldrich | Cat #: C1129 |
| Chenodeoxycholic acid | Sigma-Aldrich | Cat #: C9377 |
| Lithocholic acid | Sigma-Aldrich | Cat #: L6250 |
| Deoxycholic acid | Sigma-Aldrich | Cat#: D2510 |
| Taurodeoxycholic acid sodium salt hydrate | Sigma-Aldrich | Cat #: T0875 |
| Oil Red O | Sigma-Aldrich | Cat #: O0625 |
| Lipopolysaccharides from Escherichia coli O128:B12 | Sigma-Aldrich | Cat #: L2887 |
| Glycodeoxycholic Acid | Cayman Chemical | Item #: 20274 |
| Critical Commercial Assays | ||
| In Situ Cell Death Detection Kit, Fluorescein | Sigma-Aldrich/Roche | Cat# 11684795910 |
| Reticulin silver plating staining kit | Millipore-Sigma | Cat# 1002510001 |
| Total Bile Acid (TBA) assay | Diazyme | Cat# DZ042A-k |
| Bilirubin assay | Randox | Cat # BR411 |
| Alanine aminotransferase (ALT) assay | Randox | Cat # AL146 |
| Aspartate aminotransferase (AST) assay | Randox | Cat # AS147 |
| Mouse alpha-Fetoprotein (AFP) ELISA | R&D Systems | Cat# DY5369 |
| Mouse Lipocalin-2 (Lcn2) ELISA | R&D Systems | Cat# DY1857 |
| Mouse Keratinocyte-derived chemokine (KC) ELISA | R&D Systems | Cat# DY453 |
| Mouse soluble intercellular adhesion molecule 1 (sICAM-1) ELISA | R&D Systems | Cat# DY796 |
| Mouse Myeloperoxidase (MPO) ELISA | R&D Systems | Cat# DY3667 |
| Mouse Neutrophil elastase (NE) ELISA | R&D Systems | Cat# DY4517 |
| Mouse Serum Amyloid A (SAA) ELISA | R&D Systems | Cat# DY2948 |
| Mouse Tumor necrosis factor alpha (TNFα) | R&D Systems | Cat# DY410 |
| Mouse Interleukin-1 beta (IL-1β) ELISA | R&D Systems | Cat# DY401 |
| Mouse Interleukin-6 (IL-6) ELISA | R&D Systems | Cat# DY406 |
| Mouse Interferon-gamma (IFN-γ) ELISA | R&D Systems | Cat# DY485 |
| Mouse Insulin ELISA | Millipore-Sigma | Cat# EZRMI-13K |
| Total cholesterol assay | Randox | Cat# CH201 |
| Triglycerides (TG) assay | Randox | Cat# TR210 |
| Lactate Dehydrogenase (LDH) | Randox | Cat# LD3842 |
| Deposited Data | ||
| Transcriptome (RNA-sequencing) | This paper | European Nucleotide Archive, accession number PRJEB28449 |
| 16S sequencing | This paper | European Nucleotide Archive, accession number PRJEB28447 |
| Experimental Models: Cell Lines | ||
| Hepa-1c1c7 (mouse liver hepatoma) | ATCC | Hepa-1c1c7 CRL-2026 |
| HEK-Blue-mTLR4 cells | Invivogen | Cat #: hkb-mtlr4 |
| HEK-Blue mTLR5 cells | Invivogen | Cat#: hkb-mtlr5 |
| Experimental Models: Organisms/Strains | ||
| C57BL/6 WT mice | Animal facility: The Pennsylvania State University (PSU), The university of Toledo (UT) and Georgia State University (GSU) | N/A |
| Germ-free C57BL/6 WT mice | GSU | N/A |
| Tlr5 deficient (Tlr5KO) mice | UT, PSU, and GSU | N/A |
| Germ-free Tlr5KO mice | GSU | N/A |
| Tlr5KO (B6.129S1-Tlr5tm1Flv/J) mice | The Jackson Laboratory | Stock No: 008377 |
| Lcn2 deficient (Lcn2KO) mice | PSU | N/A |
| Tlr4 deficient (Tlr4KO) mice | PSU | N/A |
| MyD88-deficient (MyD88KO) mice | PSU | N/A |
| Tlr5/Tlr4 double knockout (Tlr5/Tlr4-DKO) mice | PSU | N/A |
| Tlr5/Nlrc4 double knockout (Tlr5/Nlrc4-DKO) mice | PSU | N/A |
| Oligonucleotides | ||
| Table S3 | Integrated DNA Technologies | N/A |
| Software and Algorithms | ||
| GraphPad Prism 7.0 | GraphPad | https://www.graphpad.com/scientific-software/prism/ |
| BD Accuri C6 Software | BD Biosciences | https://www.bdbiosciences.com/documents/BD_Accuri_C6_Software_User_Guide.pdf |
| FlowJo software | Becton Dickinson | http://beckmanflow.com/?page_id=76/?pi_ad_id=113583631840 |
| Other | ||
| 16 S sequencing | QIIME, LEFSE and Picrust | QIIME:http://qiime.org/ https://www.nature.com/articles/nmeth.f.303; LEFSE; https://bitbucket.org/biobakery/biobakery/wiki/lefse https://www.ncbi.nlm.nih.gov/pmc/articles/PMC3218848/; Picrust: http://picrust.github.io/picrust/ https://www.ncbi.nlm.nih.gov/pubmed/23975157 |
Highlights.
Diet enriched with soluble, but not insoluble, fiber induced HCC in dysbiotic mice
Fiber-induced HCC displayed early onset of cholemia and hyperbilirubinemia
Soluble fiber-induced HCC was microbiota-dependent and transmissible to WT mice
Inhibition of gut fermentation and exclusion of dietary soluble fiber prevented HCC
ACKNOWLEDGMENTS
The expert opinions of Dr. Jeffrey M. Peters, Department of Veterinary and Biomedical Sciences, PSU are acknowledged. We thank Dr. Dittakavi Sarma, University of Toronto, for helpful suggestions. Hops β-acids extract was donated by S.S. Steiner, Inc. We acknowledge Dr. Xi Cheng, UT Microbiome Consortium for 16S analysis of fecal microbiota. This work was supported by the NIH (R01CA219144, R03DK094864, partial support from R01DK097865 to M.V.-K., and DK061417 and DK083890 to A.T.G.). V.S. and P.S. are supported by Research Fellowship from Crohn’s and Colitis Foundation of America (CCFA). B.C. is supported by CCFA Career Development Award. P.D.C. is senior research associate of the FRS-FNRS and received grants WELBIO-CGR-2017-C2, Funds Baillet Latour, and ERC Starting Grant 2013 (336452-ENIGMO).
Footnotes
SUPPLEMENTAL INFORMATION
Supplemental Information includes seven figures, three tables, and one video and can be found with this article online at https://doi.org/10.1016/j.cell.2018.09.004.
DECLARATION OF INTERESTS
The authors declare no competing interests.
REFERENCES
- Arpaia N, Campbell C, Fan X, Dikiy S, van derVeeken J, deRoos P, Liu H, Cross JR, Pfeffer K, Coffer PJ, and Rudensky AY (2013). Metabolites produced by commensal bacteria promote peripheral regulatory T-cell generation. Nature 504, 451–455. [DOI] [PMC free article] [PubMed] [Google Scholar]
- Arteel GE (2013). Build a better mouse model, and the world will beat a path to your door. Hepatology 58, 1526–1528. [DOI] [PMC free article] [PubMed] [Google Scholar]
- Asimakopoulou A, Borkham-Kamphorst E, Tacke F, and Weiskirchen R (2016). Lipocalin-2 (NGAL/LCN2), a “help-me” signal in organ inflammation. Hepatology 63, 669–671. [DOI] [PubMed] [Google Scholar]
- Bailey RL, Gahche JJ, Lentino CV, Dwyer JT, Engel JS, Thomas PR, Betz JM, Sempos CT, and Picciano MF (2011). Dietary supplement use in the United States, 2003–2006. J. Nutr 141, 261–266. [DOI] [PMC free article] [PubMed] [Google Scholar]
- Belcheva A, Irrazabal T, Robertson SJ, Streutker C, Maughan H, Rubino S, Moriyama EH, Copeland JK, Surendra A, Kumar S, et al. (2014). Gut microbial metabolism drives transformation of MSH2-deficient colon epithelial cells. Cell 158, 288–299. [DOI] [PubMed] [Google Scholar]
- Buege JA, and Aust SD (1978). Microsomal lipid peroxidation. Methods Enzymol 52, 302–310. [DOI] [PubMed] [Google Scholar]
- Cai SY, Ouyang X, Chen Y, Soroka CJ, Wang J, Mennone A, Wang Y, Mehal WZ, Jain D, and Boyer JL (2017). Bile acids initiate cholestatic liver injury by triggering a hepatocyte-specific inflammatory response. JCI Insight 2, e90780. [DOI] [PMC free article] [PubMed] [Google Scholar]
- Cani PD, Neyrinck AM, Fava F, Knauf C, Burcelin RG, Tuohy KM, Gibson GR, and Delzenne NM (2007). Selective increases of bifidobacteria in gut microflora improve high-fat-diet-induced diabetes in mice through a mechanism associated with endotoxaemia. Diabetologia 50, 2374–2383. [DOI] [PubMed] [Google Scholar]
- Caviglia JM, and Schwabe RF (2015). Mouse models of liver cancer. Methods Mol. Biol 1267, 165–183. [DOI] [PubMed] [Google Scholar]
- Chassaing B, Koren O, Goodrich JK, Poole AC, Srinivasan S, Ley RE, and Gewirtz AT (2015a). Dietary emulsifiers impact the mouse gut microbiota promoting colitis and metabolic syndrome. Nature 519, 92–96. [DOI] [PMC free article] [PubMed] [Google Scholar]
- Chassaing B, Miles-Brown J, Pellizzon M, Ulman E, Ricci M, Zhang L, Patterson AD, Vijay-Kumar M, and Gewirtz AT (2015b). Lack of soluble fiber drives diet-induced adiposity in mice. Am. J. Physiol. Gastrointest. Liver Physiol 309, G528–G541. [DOI] [PMC free article] [PubMed] [Google Scholar]
- Dantoine TF, Debord J, Charmes JP, Merle L, Marquet P, Lachatre G, and Leroux-Robert C (1998). Decrease of serum paraoxonase activity in chronic renal failure. J. Am. Soc. Nephrol 9, 2082–2088. [DOI] [PubMed] [Google Scholar]
- Dapito DH, Mencin A, Gwak GY, Pradere JP, Jang MK, Mederacke I, Caviglia JM, Khiabanian H, Adeyemi A, Bataller R, et al. (2012). Promotion of hepatocellular carcinoma by the intestinal microbiota and TLR4. Cancer Cell 21, 504–516. [DOI] [PMC free article] [PubMed] [Google Scholar]
- Dewulf EM, Cani PD, Claus SP, Fuentes S, Puylaert PG, Neyrinck AM, Bindels LB, de Vos WM, Gibson GR, Thissen JP, and Delzenne NM (2013). Insight into the prebiotic concept: lessons from an exploratory, double blind intervention study with inulin-type fructans in obese women. Gut 62, 1112–1121. [DOI] [PMC free article] [PubMed] [Google Scholar]
- Donohoe DR, Garge N, Zhang X, Sun W, O’Connell TM, Bunger MK, and Bultman SJ (2011). The microbiome and butyrate regulate energy metabolism and autophagy in the mammalian colon. Cell Metab. 13, 517–526. [DOI] [PMC free article] [PubMed] [Google Scholar]
- Donohoe DR, Collins LB, Wali A, Bigler R, Sun W, and Bultman SJ (2012). The Warburg effect dictates the mechanism of butyrate-mediated histone acetylation and cell proliferation. Mol. Cell 48, 612–626. [DOI] [PMC free article] [PubMed] [Google Scholar]
- El-Serag HB, and Rudolph KL (2007). Hepatocellular carcinoma: epidemiology and molecular carcinogenesis. Gastroenterology 132, 2557–2576. [DOI] [PubMed] [Google Scholar]
- Elias JE, and Gygi SP (2007). Target-decoy search strategy for increased confidence in large-scale protein identifications by mass spectrometry. Nat. Methods 4, 207–214. [DOI] [PubMed] [Google Scholar]
- Eng JK, McCormack AL, and Yates JR (1994). An approach to correlate tandem mass spectral data of peptides with amino acid sequences in a protein database. J. Am. Soc. Mass Spectrom 5, 976–989. [DOI] [PubMed] [Google Scholar]
- Etienne-Mesmin L, Vijay-Kumar M, Gewirtz AT, and Chassaing B (2016). Hepatocyte toll-like receptor 5 promotes bacterial clearance and protects mice against high-fat diet-induced liver disease. Cell. Mol. Gastroenterol. Hepatol 2, 584–604. [DOI] [PMC free article] [PubMed] [Google Scholar]
- Fiolet T, Srour B, Sellem L, Kesse-Guyot E, Alliès B, Méjean C, Descha-saux M, Fassier P, Latino-Martel P, Beslay M, et al. (2018). Consumption of ultra-processed foods and cancer risk: results from NutriNet-Sante prospective cohort. BMJ 360, k322. [DOI] [PMC free article] [PubMed] [Google Scholar]
- Flythe MD, and Aiken GE (2010). Effects of hops (Humulus lupulus L.) extract on volatile fatty acid production by rumen bacteria. J. Appl. Microbiol 109,1169–1176. [DOI] [PubMed] [Google Scholar]
- Furusawa Y, Obata Y, Fukuda S, Endo TA, Nakato G, Takahashi D, Nakanishi Y, Uetake C, Kato K, Kato T, et al. (2013). Commensal microbe-derived butyrate induces the differentiation of colonic regulatory T cells. Nature 504, 446–450. [DOI] [PubMed] [Google Scholar]
- Gill SR, Pop M, Deboy RT, Eckburg PB, Turnbaugh PJ, Samuel BS, Gordon JI, Relman DA, Fraser-Liggett CM, and Nelson KE (2006). Metagenomic analysis of the human distal gut microbiome. Science 312, 1355–1359. [DOI] [PMC free article] [PubMed] [Google Scholar]
- Grąt M, Wronka KM, Krasnodębski M, Masior Ł, Lewandowski Z, Kosińska I, Grąt K, Styputkowski J, Rejowski S, Wasilewicz M, et al. (2016). Profile of gut microbiota associated with the presence of hepatocellular cancer in patients with liver cirrhosis. Transplant. Proc 48, 1687–1691. [DOI] [PubMed] [Google Scholar]
- Harlow BE, Lawrence LM, Kagan IA, and Flythe MD (2014). Inhibition of fructan-fermenting equine faecal bacteria and Streptococcus bovis by hops (Humulus lupulus L.) β-acid. J. Appl. Microbiol 117, 329–339. [DOI] [PubMed] [Google Scholar]
- Janssen AWF, Houben T, Katiraei S, Dijk W, Boutens L, van der Bolt N, Wang Z, Brown JM, Hazen SL, Mandard S, et al. (2017). Modulation of the gut microbiota impacts nonalcoholic fatty liver disease: a potential role for bile acids. J. Lipid Res 58, 1399–1416. [DOI] [PMC free article] [PubMed] [Google Scholar]
- Kaiko GE, Ryu SH, Koues OI, Collins PL, Solnica-Krezel L, Pearce EJ, Pearce EL, Oltz EM, and Stappenbeck TS (2016). The colonic crypt protects stem cells from microbiota-derived metabolites. Cell 165,1708–1720. [DOI] [PMC free article] [PubMed] [Google Scholar]
- Kim MH, Kang SG, Park JH, Yanagisawa M, and Kim CH (2013). Short-chain fatty acids activate GPR41 and GPR43 on intestinal epithelial cells to promote inflammatory responses in mice. Gastroenterology 145, 396–406. [DOI] [PubMed] [Google Scholar]
- Letran SE, Lee SJ, Atif SM, Flores-Langarica A, Uematsu S, Akira S, Cunningham AF, and McSorley SJ (2011). TLR5-deficient mice lack basal inflammatory and metabolic defects but exhibit impaired CD4 Tcell responses to a flagellated pathogen. J. Immunol 186, 5406–5412. [DOI] [PMC free article] [PubMed] [Google Scholar]
- Li M, Cai SY, and Boyer JL (2017). Mechanisms of bile acid mediated inflammation in the liver. Mol. Aspects Med 56, 45–53. [DOI] [PMC free article] [PubMed] [Google Scholar]
- Louis P, and Flint HJ (2007). Development of a semiquantitative degenerate real-time pcr-based assay for estimation of numbers of butyryl-coenzyme A (CoA) CoA transferase genes in complex bacterial samples. Appl. Environ. Microbiol 73, 2009–2012. [DOI] [PMC free article] [PubMed] [Google Scholar]
- Martínez-Chantar ML, Vázquez-Chantada M, Ariz U, Martínez N, Varela M, Luka Z, Capdevila A, Rodríguez J, Aransay AM, Matthiesen R, et al. (2008). Loss of the glycine N-methyltransferase gene leads to steatosis and hepatocellular carcinoma in mice. Hepatology 47, 1191–1199. [DOI] [PMC free article] [PubMed] [Google Scholar]
- McAlister GC, Nusinow DP, Jedrychowski MP, Wühr M, Huttlin EL, Erickson BK, Rad R, Haas W, and Gygi SP (2014). MultiNotch MS3 enables accurate, sensitive, and multiplexed detection of differential expression across cancer cell line proteomes. Anal. Chem 86, 7150–7158. [DOI] [PMC free article] [PubMed] [Google Scholar]
- Miles JP, Zou J, Kumar MV, Pellizzon M, Ulman E, Ricci M, Gewirtz AT, and Chassaing B (2017). Supplementation of low- and high-fat diets with fermentable fiber exacerbates severity of DSS-induced acute colitis. Inflamm. Bowel Dis 23, 1133–1143. [DOI] [PMC free article] [PubMed] [Google Scholar]
- Misikangas M, Tanayama H, Rajakangas J, Lindén J, Pajari AM, and Mutanen M (2008). Inulin results in increased levels of beta-catenin and cyclin D1 as the adenomas increase in size from small to large in the Min/+ mouse. Br. J. Nutr 99, 963–970. [DOI] [PubMed] [Google Scholar]
- Navarro VJ, Barnhart H, Bonkovsky HL, Davern T, Fontana RJ, Grant L, Reddy KR, Seeff LB, Serrano J, Sherker AH, et al. (2014). Liver injury from herbals and dietary supplements in the U.S. Drug-Induced Liver Injury Network. Hepatology 60, 1399–1408. [DOI] [PMC free article] [PubMed] [Google Scholar]
- Navarro VJ, Khan I, Björnsson E, Seeff LB, Serrano J, and Hoofnagle JH (2017). Liver injury from herbal and dietary supplements. Hepatology 65, 363–373. [DOI] [PMC free article] [PubMed] [Google Scholar]
- Pajari AM, Rajakangas J, Paivarinta E, Kosma VM, Rafter J, and Mutanen M (2003). Promotion of intestinal tumorformation by inulin is associated with an accumulation of cytosolic beta-catenin in Min mice. Int. J. Cancer 106, 653–660. [DOI] [PubMed] [Google Scholar]
- Park J, Goergen CJ, HogenEsch H, and Kim CH (2016). Chronically elevated levels of short-chain fatty acids induce T cell-mediated ureteritis and hydronephrosis. J. Immunol 196, 2388–2400. [DOI] [PMC free article] [PubMed] [Google Scholar]
- Perry RJ, Peng L, Barry NA, Cline GW, Zhang D, Cardone RL, Petersen KF, Kibbey RG, Goodman AL, and Shulman GI (2016). Acetate mediatesamicrobiome-brain-b-cell axisto promote metabolic syndrome. Nature 534, 213–217. [DOI] [PMC free article] [PubMed] [Google Scholar]
- Pool-Zobel BL (2005). Inulin-type fructans and reduction in colon cancer risk: review of experimental and human data. Br. J. Nutr. 93 (Suppl 1), S73–S90. [DOI] [PubMed] [Google Scholar]
- Sakamoto K, and Konings WN (2003). Beer spoilage bacteria and hop resistance. Int. J. Food Microbiol 89, 105–124. [DOI] [PubMed] [Google Scholar]
- Singh V, Chassaing B, Zhang L, San Yeoh B, Xiao X, Kumar M, Baker MT, Cai J, Walker R, Borkowski K, et al. (2015). Microbiota-dependent hepatic lipogenesis mediated by stearoyl CoA desaturase 1 (SCD1) promotes metabolic syndrome in TLR5-deficient mice. Cell Metab. 22, 983–996. [DOI] [PMC free article] [PubMed] [Google Scholar]
- Smith PM, Howitt MR, Panikov N, Michaud M, Gallini CA, Bohlooly-Y M, Glickman JN, and Garrett WS (2013). The microbial metabolites, short-chain fatty acids, regulate colonic Treg cell homeostasis. Science 341, 569–573. [DOI] [PMC free article] [PubMed] [Google Scholar]
- Tolonen AC, and Haas W (2014). Quantitative proteomics using reductive dimethylation for stable isotope labeling. J. Vis. Exp (89) Published online July 1, 2014. 10.3791/51416. [DOI] [PMC free article] [PubMed] [Google Scholar]
- Van den Abbeele P, Belzer C, Goossens M, Kleerebezem M, De Vos WM, Thas O, De Weirdt R, Kerckhof FM, and Van de Wiele T (2013). Butyrate-producing Clostridium cluster XIVa species specifically colonize mucins in an in vitro gut model. ISME J. 7, 949–961. [DOI] [PMC free article] [PubMed] [Google Scholar]
- Vijay-Kumar M, Sanders CJ, Taylor RT, Kumar A, Aitken JD, Sitaraman SV, Neish AS, Uematsu S, Akira S, Williams IR, and Gewirtz AT (2007). Deletion of TLR5 results in spontaneous colitis in mice. J. Clin. Invest 117, 3909–3921. [DOI] [PMC free article] [PubMed] [Google Scholar]
- Vijay-Kumar M, Aitken JD, Carvalho FA, Cullender TC, Mwangi S, Srinivasan S, Sitaraman SV, Knight R, Ley RE, and Gewirtz AT (2010). Metabolic syndrome and altered gut microbiota in mice lacking Toll-like receptor 5. Science 328, 228–231. [DOI] [PMC free article] [PubMed] [Google Scholar]
- Wrzosek L, Miquel S, Noordine ML, Bouet S, Joncquel Chevalier-Curt M, Robert V, Philippe C, Bridonneau C, Cherbuy C, Robbe-Masselot C, et al. (2013). Bacteroides thetaiotaomicron and Faecalibacterium prausnitzii influence the production of mucus glycans and the development of goblet cells in the colonic epithelium of a gnotobiotic model rodent. BMC Biol 11,61. [DOI] [PMC free article] [PubMed] [Google Scholar]
- Yamada S, Takashina Y, Watanabe M, Nagamine R, Saito Y, Kamada N, and Saito H (2018). Bile acid metabolism regulated by the gut microbiota promotes non-alcoholic steatohepatitis-associated hepatocellular carcinoma in mice. Oncotarget 9, 9925–9939. [DOI] [PMC free article] [PubMed] [Google Scholar]
- Yoshimoto S, Loo TM, Atarashi K, Kanda H, Sato S, Oyadomari S, Iwakura Y, Oshima K, Morita H, Hattori M, et al. (2013). Obesity-induced gut microbial metabolite promotes liver cancer through senescence secretome. Nature 499, 97–101. [DOI] [PubMed] [Google Scholar]
- Ziegler TR, Luo M, Estivariz CF, Moore DA 3rd, Sitaraman SV, Hao L, Bazargan N, Klapproth JM, Tian J, Galloway JR, et al. (2008). Detectable serum flagellin and lipopolysaccharide and upregulated anti-flagellin and lipopolysaccharide immunoglobulins in human short bowel syndrome. Am. J. Physiol. Regul. Integr. Comp. Physiol 294, R402–R410. [DOI] [PMC free article] [PubMed] [Google Scholar]
- Zinalibdin MR, and Yacob AR (2013). Detection of hippuric acid: a glue solvent metabolite, using a mobile test kit. J. Arab. Chem 6, 115–120. [Google Scholar]
- Zou J, Chassaing B, Singh V, Pellizzon M, Ricci M, Fythe MD, Kumar MV, and Gewirtz AT (2018). Fiber-mediated nourishment of gut microbiota protects against diet-induced obesity by restoring IL-22-mediated colonic health. Cell Host Microbe. 23, 41–53. [DOI] [PMC free article] [PubMed] [Google Scholar]
Associated Data
This section collects any data citations, data availability statements, or supplementary materials included in this article.