

Abstract
Cell migration through dense tissues or small capillaries can elongate the nucleus and even damage it, and any impact on cell cycle has the potential to affect various processes including carcinogenesis. Here, nuclear rupture and DNA damage increase with constricted migration in different phases of cell cycle—which we show is partially repressed. We study several cancer lines that are contact inhibited or not and that exhibit diverse frequencies of nuclear lamina rupture after migration through small pores. DNA repair factors invariably mislocalize after migration, and an excess of DNA damage is evident as pan-nucleoplasmic foci of phosphoactivated ATM and γH2AX. Foci counts are suppressed in late cell cycle as expected of mitotic checkpoints, and migration of contact-inhibited cells through large pores into sparse microenvironments leads also as expected to cell-cycle reentry and no effect on a basal level of damage foci. Constricting pores delay such reentry while excess foci occur independent of cell-cycle phase. Knockdown of repair factors increases DNA damage independent of cell cycle, consistent with effects of constricted migration. Because such migration causes DNA damage and impedes proliferation, it illustrates a cancer cell fate choice of “go or grow.”
INTRODUCTION
The growth of a cell mass can be suppressed through mechanisms of contact inhibition (Morais et al., 2017) or direct physical crowding (Delarue et al., 2017), but invasive migration of cells into nearby tissues or blood capillaries is expected to release such constraints and permit DNA replication and mitosis (Figure 1Ai). The “go or grow” hypothesis posits proliferation and cell migration to be mutually exclusive (Giese et al., 1996; Garay et al., 2013), and it remains an open question whether a cell that is impeded in migration as it squeezes through a narrow constriction is therefore also upregulating its cell cycle and replicative program.
FIGURE 1:

Invasive migration can affect proliferation but distension can also affect nuclear integrity and distribution of DNA and repair factors. (A) Invasion and proliferation are both hallmarks of cancer. (i) Invading cancer cells squeeze into regions of low cancer cell density, with cell-cycle reentry possible from loss of contact inhibition. (ii) Transwell membranes with small or large cylindrical holes model invasive migration. Cells on top of the membrane at very high density migrate over several hours to the bottom (a low-density environment). During migration through constricting pores, cells exhibit frequent lamina rupture at sites of nuclear blebs, followed by mislocalization of mobile nuclear proteins, including DNA repair proteins, into the cytoplasm. (iii) Superresolution images show lamina dilation in the nuclear blebs of three different cancer lines that have migrated through 3-µm pores. The blebs are indicated by white triangles. (Representative of ≥5 cells per cell type.) The percentage of “bleb-positive” refers to the proportion of each cell type that exhibits blebs following 3-µm-pore migration. In all cases, blebs are observed at similar frequencies in 2N and 4N cells (≥150 cells per cell type, n = 2 experiments.). (B) (i) A549 cells with endogenously RFP-tagged lamin-B1 were pulled into a ∼3 µm pipette under controlled pressure after latrunculin treatment and detachment. In all cells, lamin-B shows initial depletion from the leading tip of the nucleus, which is quantified as a decline in the tip-to-outside RFP-LMNB1 intensity ratio (inset) over an approximately hour-long aspiration experiment. Each cell is represented by a different symbol and fitted with a blue line. The red dashed line is fitted to all data (eight cells). (ii) The blue-line slopes from panel i are binned and plotted against pipette diameter; the exponential decay is a guide to the eye and indicates little effect beyond ∼5 µm (error bars represent SEM). (iii) A representative A549 RFP-LMNB1 cell with overexpressed GFP-53BP1 squeezes into a micropipette. The aspirated nucleus shows lamin-B dilation at the leading tip and rupture of GFP-53BP1 into the cytoplasm. Notably, the nucleus also shows segregation of GFP-53BP1, a mobile protein, away from regions of high chromatin compaction. These local density gradients are evident before aspiration (inset), and then exacerbated by applied pressure, especially at the pipette entrance (representative of 4 cells, n = 2 experiments).
Replication often increases a basal level of DNA damage in cells (Técher et al., 2017), and so invasive migration can in principle increase DNA damage simply by causing cell-cycle reentry. Migration of contact-inhibited cancer cell lines through small constricting pores increases DNA damage within the nucleus based on increased numbers of phosphorylated foci of chromatin-bound histone-2AX and based also on electrophoretic mobility of DNA from isolated nuclei (Irianto et al., 2017). Large intranuclear accumulations of overexpressed constructs of GFP-53BP1 (a DNA repair factor) have also been interpreted as evidence of constriction-induced DNA damage (Denais et al., 2016; Raab et al., 2016), but constricted migration segregates mobile nuclear proteins (including GFP-53BP1) away from compacted chromatin (Irianto et al., 2016). Nuclear envelope rupture in constricted migration is nonetheless unmistakable based on cytoplasmic mis-localization of constructs of GFP-NLS (GFP with added nuclear localization signal peptide) (Denais et al., 2016; Raab et al., 2016) and mobile DNA repair factors (Irianto et al., 2017) (Figure 1Aii). What remains unclear is whether any cell cycle changes occur and to explain the observed excess of γH2AX foci that results from constricted migration.
Cell-cycle phases also link to the repair of DNA damage in that cell-cycle checkpoints require basal levels of DNA damage to be sufficiently decreased via DNA repair (Dasika et al., 1999). Careful accounting of cell-cycle and DNA damage after constricted migration is further motivated by a previously noted correlation between DNA replication in a given normal tissue’s stem cells and cancer risk in that tissue (Supplemental Figure S1Ai). Such replication is, for example, higher in normal lung than in brain and much higher than in bone, with “replicative” cancer risk following the same trend. Here studies of migration through small and large pores begin with a focus on U251 glioblastoma cells, which are mesenchymal-like and not contact inhibited (Fuse et al., 2000), in comparison to two epithelial-like and contact-inhibited cancer cell lines (A549 from lung and U2OS from bone) previously studied in constricted migration (Irianto et al., 2017). Because the porosity of tumors is in the range of microns (Wolf et al., 2009; Harada et al., 2014), and the lumen of a capillary can be as small as 3 µm (Sarveswaran et al., 2016), our studies use filters with pore diameters of either 3 or 8 µm.
RESULTS
Migration through the 3-μm constricting pores takes hours, after which all three cancer lines exhibit nuclear blebs (Figure 1Aiii). Such blebs were previously associated with rupture of the nuclear envelope (Denais et al., 2016; Raab et al., 2016; Irianto et al., 2017) and are seen here in all cancer lines to be independent of low or high DNA content (designated simply as “2N” or “4N” content; see Materials and Methods). Only a minor fraction (∼15%) of mesenchymal U251 nuclei exhibit visible blebs compared with the more epithelial-like cell lines (∼60–80%). Superresolution microscopy nonetheless indicates a common bleb structure with near complete loss of lamin-B as well as dilated webs of lamin-A (Figure 1Aiii). Larger pores of 8 μm rarely generate such blebs.
Micropipettes allow controlled pressures to be applied to detached cells over hour-long timescales, as is relevant to pore migration, and the ∼kPa pressures are relevant to the traction stresses applied by cells to two-dimensional gels (Wolf et al., 2009; Harada et al., 2014). To understand the behavior of the endogenous B-type lamins that are disrupted in migration, A549 cells with gene-edited RFP-Lamin-B1 were studied (RFP denotes red fluorescent protein). Depletion of this lamin on the protruding tip of the nucleus increases with time (Figure 1Bi) and steepens with decreasing diameter (Figure 1Bii). Higher curvature imposed by smaller pores thus causes greater dilation of the lamina, which is consistent with nuclear blebs and rupture occurring only after migration though highly constricting pores. It is also consistent with theoretical predictions based on the time-dependent redistribution of lamin-B as a consequence of nuclear deformation under applied pressure (Supplemental Figure S1B). Even before pressure is applied, the nucleoplasmic repair factor GFP-53BP1 shows a density distribution anti-correlated with DNA (Figure 1Biii, grayscale insets); the anti-correlation becomes even more apparent on aspiration, with DNA entering the micropipette and becoming more dense while 53BP1 is excluded. Leakage of 53BP1 from the tip is also evident (Figure 1Biii and Supplemental Figure S1C).
After constricted migration, immunostaining shows mislocalization of the endogenous DNA repair factor KU80, with abundant KU80 in the cytoplasm (Figure 2Ai) and net loss of KU80 from the nucleus (Figure 2Aii). Such migration-induced mislocalization of DNA repair factors could in principle delay the repair of DNA breaks (Figure 2Bi). To begin to assess DNA damage and repair, superresolution imaging was applied to pore-migrated U251 nuclei (Figure 2Bii). Images show pan-nucleoplasmic foci of anti-γH2AX and anti-53BP1, and these two markers of DNA repair are known to often colocalize at sites of DNA damage (Denais et al., 2016; Raab et al., 2016). As noted in the Introduction, accumulations of overexpressed 53BP1-GFP have been interpreted previously as evidence of constriction-induced DNA damage (Denais et al., 2016; Raab et al., 2016), but such overexpressed fusions segregate from DNA (Figure 1Biii) (Irianto et al., 2017), and 53BP1 is less reliable for quantifying DNA damage than γH2AX (D’Abrantes et al., 2018). Here quantitative analyses of γH2AX foci in conventional confocal images show significantly higher foci counts above a basal level of DNA damage for all three cancer lines after constricted migration through 3-μm pores (Figure 2C). Despite the greater-than fourfold range in nuclear bleb frequency, all three cell lines also show a similar level of repair factor mislocalization to the cytoplasm. Migration through large pores does not cause nuclear blebs, KU80 mislocalization, or excess DNA damage in any cancer line. Furthermore, constricted migration of all cancer lines also leads to very low cell densities (bottom, Figure 2C), which has important implications for cell-cycle reentry, DNA replication, and potential coupling to DNA damage (Técher et al., 2017).
FIGURE 2:

Constricted migration causes varying degrees of nuclear rupture but consistently mis-localizes repair factor and increases DNA damage. (A) (i) Confocal images of U251 cells show that mobile nuclear proteins, including the DNA repair factor KU80, are often observed outside the boundary of the DNA edge in cells that have migrated through 3-µm pores (“3 µm Bottom”). Such mislocalization, indicative of nuclear rupture, is rarely seen among unmigrated cells (“3 µm Top”). (ii) Across three cancer cell lines that have squeezed through 3-µm pores, cells like those in panel i that show obvious mislocalization of KU80 (“KU80 leakage”) have lower levels of KU80 in their nuclei than cells without obvious mislocalization. Rupture causes a net loss of nuclear KU80 but not lamin-B. Asterisks indicate a significant difference (p < 0.05) in total nuclear intensity (≥8 cells per condition, error bars represent SEM). (B) (i) Schematic showing that constriction-induced mislocalization of repair factors physically inhibits repair of DNA breaks, leading perhaps to an excess of DNA damage above the basal level. (ii) Superresolution images of a representative formaldehyde-fixed, immunostained U251 cell show pan-nucleoplasmic 53BP1 foci that appear to mostly overlap with γH2AX foci. However, higher magnification insets reveal heterogeneity within individual foci. (C) U251, U2OS, and A549 cells exhibit diverse frequencies of lamina rupture following 3-µm-pore migration (as indicated by the percentage of migrated cells with blebs), but all exhibit a constriction-induced increase in the proportion of cytoplasmic (vs. nucleoplasmic) endogenous KU80 as well as an increase in γH2AX foci. Asterisks indicate a significant difference (p < 0.05) in percentage total KU80 signal or γH2AX foci (≥100 cells per condition, n = 2 experiments, error bars represent SEM).
An alternative hypothesis to the loss of repair factors is that nuclear constriction itself activates the DNA damage response signaling pathway: ATR kinase reportedly localizes to sites of nuclear deformation, as during pipette aspiration (Kumar et al., 2014). Ataxia-telangiectasia mutated (ATM) kinase is a related kinase that phosphorylates histone H2AX, yielding γH2AX, in response to DNA damage (Burma et al., 2001) (Figure 3A, i and ii). If ATM were mechanoresponsive in the same way as ATR, then one might expect to see stress-induced local accumulations of phosphoactivated ATM (pATM) during pore migration. However, we find that pATM foci are similar in appearance and pan-nucleoplasmic distribution to γH2AX foci both on the top and bottom of 3-µm-pore filters (Figure 3Aiii). pATM foci are fewer in number than γH2AX foci, consistent with ATM being a key upstream kinase for γH2AX as a longer-lived substrate. The pan-nucleoplasmic foci (of both pATM and γH2AX) thus likely mark DNA damage as is usually reported, especially because their numbers correlate with the results of electrophoretic comet assays that measure DNA damage (Irianto et al., 2017). In the process of counting foci and finding that both pATM and γH2AX increase after migration, we also noticed a tendency for more foci in late phase nuclei, which prompted scrutiny of cell-cycle effects on the excess damage. The role of cell cycle in migration-induced DNA damage is not yet known: excess damage could be a trivial consequence, for example, of contact-inhibited cells reinitiating replication that incurs damage.
FIGURE 3:

Phosphoactivated ATM (pATM) is an upstream kinase for γH2AX in the DNA damage response pathway, and pATM foci colocalize with γH2AX foci, which are suppressed in late cell cycle. (A) (i) DNA damage activates ATM through auto- or trans-phosphorylation. Activated ATM then mediates the phosphorylation of histone H2AX, yielding γH2AX. (ii) Treatment of unmigrated U2OS cells with an ATM inhibitor (ATMi) suppresses formation of phosphoactivated ATM (pATM) foci as well as γH2AX foci, consistent with ATM being an upstream kinase for γH2AX in the DNA damage response signaling pathway. Note that the number of γH2AX foci is lower here than in other figures because these cells were imaged at low magnification, making it difficult to visualize the smallest foci (≥99 cells per condition, error bars represent SEM). (iii) In confocal images of U2OS cells, foci of pATM colocalize with γH2AX foci, though the latter are larger and more numerous. The distribution of foci is pan-nucleoplasmic in both migrated (“3 µm bottom”) and unmigrated (“3 µm top”) cells. Scatter plots show that number of γH2AX foci increases with number of pATM foci for both 2N and 4N cells. There is an overall increase in foci after migration (inset) (≥160 cells per condition, error bars represent SEM). (B) (i) Schematic illustrating the EdU cell proliferation assay that was used to assess the impact of 3-μm-pore migration on cell-cycle progression. Immediately following a 24-h migration period, EdU was added to the Transwell membrane (or two-dimensional culture) for 1 h before the usual fixation and staining procedure. EdU-labeled cells were stained by a “click” chemistry reaction that is compatible with immunohistochemical staining of other antigens. (ii) As shown in this representative plot, the EdU and DNA intensity of individual cells—measured by immunofluorescence microscopy—can be used to classify the cells as 2N or 4N and, further, as G1, early S (eS), late S (lS), or G2. Plot shows cells on the top of an 8-µm-pore Transwell membrane. (iii) Cells in late phases of cell cycle (lS, G2, M) exhibit fewer γH2AX foci per total DNA than cells in early phases (G1, eS). U251 images show cells on the top of an 8-µm-pore Transwell membrane. Across all experimental conditions, U251 cells in late S have an average of 0.8 × as many γH2AX foci per DNA as U251 cells in G1; cells in G2 have 0.65× as many; and mitotic cells have 0.4× as many. Trends are similar for U2OS cells and A549 cells (adhering on bottom of Transwell) (Supplemental Figure S2; ≥60 cells per condition, n = 2 experiments.)
Cell-cycle suppression by constricted migration does not impact excess DNA damage
Cell-cycle analyses on the various cells before and after migration (Figure 3Bi) were done by fluorescence imaging of both DNA content and integration of the thymidine analogue 5-ethynyl-2´-deoxyuridine (EdU) into newly synthesized DNA (Figure 3Bii) (Salic and Mitchison, 2008). Conventional designations for nonreplicated genomes (“2N”) and the twice-larger, fully replicated genomes (“4N”) are used again for simplicity despite the aneuploid nature of typical cancer genomes. Counts of γH2AX foci were normalized to total DNA content and then compared with G1, which shows that DNA damage decreases in late phases of the cell cycle, including late S (lS), G2, and M (Figure 3Biii and Supplemental Figure S2A). This is consistent with well-known cell-cycle checkpoints for DNA damage (Dasika et al., 1999). Foci in mitosis are sometimes symmetric between daughters, which suggests inherited damage rather than random immunolabeling. The results add confidence to the measurements of DNA damage foci and also begin to suggest that the excess DNA damage is independent of cell cycle.
The identifications of cell-cycle phases further revealed that constricted migration suppresses the fraction of cells in late cell cycle (Figure 4Ai). Although it is clear that U251 cells are not contact inhibited (Fuse et al., 2000) and thus differ as expected from the A549 and U2OS cells in this respect (Figure 4Aii), all of the cancer lines studied show G2 and M phases are suppressed after constricted migration (Figure 4A, iii and iv, and Supplemental Figure S2B). With large pores, in contrast, migration from high density (“Top”) to low density (“Bottom”) leads to cell-cycle reentry for the contact-inhibited cells (A549 and U2OS), with more cells in S/G2/M phases after migration.
FIGURE 4:

Constricted migration perturbs cell cycle. (A) U251, U2OS, and A549 cells were seeded at three different densities (low, medium, high) on two-dimensional plastic and were also migrated through 3- and 8-µm-pore Transwell membranes. In each case, cell-cycle analysis was performed using total DNA content combined with EdU incorporation, as described previously in Figure 3 and as depicted here in panel i. (ii) Epithelial-like A549 and U2OS cells seem to experience stronger contact inhibition than mesenchymal-like U251 cells. Density and percentage 4N were measured for (nonmigrated) cells in two-dimensional and on top of Transwell membranes (≥70 cells per density condition for each cell type). (iii, iv) Constricted migration causes a decrease in the proportion of G2 cells for every cancer cell line studied, whether or not the cell line exhibits contact inhibition. Migration through the larger pores is consistent with cell-cycle progression, with more cells in G2 phase compared with the small pores. Red lines are fits to two-dimensional data points. Asterisks indicate a significant difference (p < 0.05) in % G2 between “3 µm bottom” cells and either sparse two-dimensional cells (U251) or “8 µm bottom” cells (U2OS and A549) (≥60 cells per condition, n = 2 experiments, error bars represent SEM). (B) Starting with contact-inhibited cells, migration through large pores into sparse microenvironments releases contact inhibition and enables cell-cycle reentry, whereas constricted migration represses entry into late S/G2/M despite low density. U2OS cells were plated at high density for 48 h to loosely synchronize them in G1/eS phase. After 48 h, the cells were trypsinized; a portion of them were seeded on 3- and 8-µm TW membranes, and then allowed to migrate for 8 or 24 h. Another portion of the cells were seeded at three different densities (high, med, low) in two dimensions, and then incubated for either 0, 8, or 24 h. Migration through 8-µm pores causes an increase in the 4N population as cells move from high density on top of the Transwell membrane (right-most plot, contact-inhibited) to low density on the bottom (middle plot). Migration through 3-µm pores, despite also alleviating contact inhibition, delays entry into 4N over at least 8 h. Asterisks indicate a significant difference (p < 0.05) in percentage 4N between “3 µm bottom” cells and “8 µm bottom” cells (≥95 cells per condition, error bars represent SEM).
To exert more control over cell cycle, U2OS cells were cultured prior to migration at very high density for 48 h, which biases toward G1/eS. U2OS cells are not only contact inhibited but also exhibit an intermediate amount of migration-induced DNA damage (Figure 2C). In two-dimensional sparse cultures, the fraction of 4N cells decays in ∼8 h toward the contact-inhibited state. When replated at high density above large pores of 8 μm, the cells migrate through to a low-density state and clearly reenter cell cycle by ∼8 h based on a greater fraction of 4N cells (Figure 4B). These results are consistent with release from the contact inhibition on Top, whereas 3-μm constricting pores effectively repress cell cycle, with far fewer 4N cells after 8 h. The result is consistent with transient repression of G2/M phases (Figure 4A, iii and iv).
Migration-induced changes in cell-cycle distribution should affect the average number of γH2AX foci per nucleus given that late cell-cycle phases show different numbers of foci than early cell-cycle phases (e.g., Figure 3Biii and Supplemental Figure S3Bi). However, the predicted change in foci number due to cell-cycle perturbation is small compared with the actual measured excess of DNA damage after constricted migration (Figure 5A). For example, for U251 cells, we predict a “Bottom”-to-“Top” γH2AX foci ratio of 1.01 due to cell-cycle perturbations alone, but the actual measured ratio is ∼1.3. Importantly, this result means that the increase in γH2AX foci after constricted migration is not trivially due to changes in the cell-cycle distribution.
FIGURE 5:

Cell-cycle perturbation does not explain constriction-induced increases in DNA damage. (A) For each cell type, and for each experimental condition (i.e., 3 µm/8 µm, top/bottom, two-dimensional low/med/high), the average number of γH2AX foci was calculated for every phase of the cell cycle (G1, eS, lS, G2, M), and then normalized to the the average number of γH2AX foci in G1. These normalized values were then averaged across all experimental conditions (Supplemental Figure S3Bi; ≥60 cells per condition, n = 2 experiments, error bars represent SEM). Based on these foci-per-phase averages (γphase), along with the cell-cycle distributions from Figure 4Aiii (%phase), the “predicted” number of γH2AX foci per nucleus was calculated for 3 and 8 µm top and bottom. This number is essentially a weighted average of γH2AX foci. Then, for both 3 and 8 µm, the measured (bottom/top) γH2AX foci ratio was plotted against the predicted foci ratio. Across all cell types, the 3 µm measured ratio is much larger than the predicted ratio, meaning that excess foci after constriction cannot be explained away as a consequence of perturbations to cell-cycle distribution. Note that the measured foci ratio for U2OS cells is not equal to the ratio reported in Figure 2C. The foci data in these two figures come from two different migration experiments; as shown below in Bi, there is some interexperiment variability in foci ratio, but there are always statistically more foci on bottom than top. (B) In eight separate U2OS Transwell migration experiments, cells were measured for γH2AX foci number and, based on total DNA content, classified as 2N or 4N. Plots show average values of (bottom/top) γH2AX foci ratio and foci per DNA ratio for these eight experiments. All experiments adhere to the trends reported here, with cells in early and late stages of the cell cycle accruing similar excesses of γH2AX foci during constricted migration. Of the eight experiments, the maximum 2N γH2AX foci ratio is indicated by a red dash; the corresponding 4N ratio for the same experiment is likewise indicated. Minimum 2N (cyan), maximum 4N (purple), and minimum 4N (green) ratios are also reported. The gray interval extends from the minimum to the maximum 2N ratio; this bar is repeated in all γH2AX foci ratio plots in subsequent figures. Averaging across all eight experiments, there is no significant difference in foci ratio between 2N and 4N cells for either 3 or 8 µm (p > 0.05 in every case) (≥60 cells per condition, n = 8 experiments, error bars represent SEM).
Across eight separate migration experiments, constricting pores always cause an excess of DNA damage in the 4N population even though they deplete this population (Figure 5B and Supplemental Figure S3A). Moreover, the excess DNA damage shows the same fold increase in 2N and 4N cells after constricted migration (Figure 5B). Larger pores do not cause an increase in DNA damage for either 2N or 4N cells. These findings suggest that migration-induced DNA damage occurs independent of cell phase and hence independent of replication. In support of this conclusion, BRCA1 is expressed in a cell-cycle-dependent way, with BRCA1 foci increasing strongly with replication in S phase (Feng et al., 2013), so we might expect to see large excesses of BRCA1 foci on “Bottom” if migration-induced damage were replication dependent. However, the measured increases in BRCA1 foci after constricted migration match the predicted increases when accounting for cell-cycle perturbations (Supplemental Figure S3Bii). Furthermore, topoisomerase (TOP2A) is one source of DNA breaks in replication, but while its partial knockdown decreases γH2AX foci counts on “Top” (before migration), the knockdown does not significantly affect γH2AX foci counts after constricted migration (Supplemental Figure S4A). Migration-induced DNA damage thus does not depend on topoisomerase activity, which is consistent with the above conclusion that the excess damage arises by some mechanism(s) other than replication stress.
Blocking DNA synthesis and mitosis with a CDK4/6 inhibitor (palbociclib [PD], 10 μM for 72 h [Bollard et al., 2017]) effectively “locks” cells in G1 or G2 (Supplemental Figure S5A) and unlike other cell-cycle inhibitors this drug does not directly damage DNA. Washout of PD prior to migration studies should allow cells to reenter S-phase and become EdU positive (Figure 6Ai). Constricted migration again delays entry into S phase, whereas migration through large pores has the opposite effect (Figure 6Aiii). The latter result is consistent with release from contact inhibition as G1 cells at high density migrate to low density (Supplemental Figure S5B). Importantly, the excess γH2AX foci after constricted migration of the PD-washout cells (Figure 6Aiv) agrees quantitatively with control cells (Figure 2C). Excess DNA damage in both early and late phases of cell cycle is also evident for small pores (Figure 6Av). The results thus suggest that the constriction-induced excess in DNA damage is independent of DNA replication.
FIGURE 6:

G1 and G2 cells migrate and incur similar migration-induced DNA damage. (A) U2OS cells were treated with 10 μM palbociclib (PD), a CDK4/6 inhibitor, for 72 h to “freeze” cells in either G1 or G2. The drug was then washed out, and the cells were migrated through 3- and 8-μm pores for 24 h. (ii) Nonmigrated cells (“Top”) and cells that migrated through small (3 μm “Bot”) or large (8 μm “Bot”) pores show similar cell-cycle distributions, suggesting that the pores do not select for cells in particular phases of the cell cycle. (iii) EdU staining indicates that G1-synchronized cells show reduced entry into S phase after migration through constricting pores. On the other hand, migration through larger 8-μm pores to a low-density environment causes release of contact inhibition and an increase in S phase cells. The gray interval indicates % EdU-positive on “Top.” (iv) PD wash-out cells exhibit excess γH2AX foci after 3-μm-pore migration (p < 1 × 10⁻⁴), similar to nontreated. There is also a very slight but still significant foci increase after 8-μm-pore migration (p = 0.03). Asterisks indicate significance. (v) The excess γH2AX foci occur in both 2N and 4N cells; there is no significant difference in foci ratio between 2N and 4N cells for either 3 or 8 µm. Given the low incidence of S phase cells due to PD treatment, the 2N and 4N populations are dominated in this case by G1 and G2 cells, respectively (≥130 cells per condition, n = 2 experiments, error bars represent SEM). (B) U2OS cells were treated with 10 μM PD for 72 h, and then migrated—with sustained drug—through 3- and 8-μm pores for 24 h. Measurements were made of cell-cycle distribution and percent EdU-positive cells, as described in A (≥75 cells per condition, n = 2 experiments, error bars represent SEM).
Maintaining PD during pore migration (Figure 6Bi) clarifies that G1 and G2 cells migrate at similar rates (Figure 6Bii). Replication is also uniformly blocked as expected (Figure 6Biii). Deficits of G2/M cells in constricted migration of cells not treated with any drug (Figure 4A, iii and iv) are therefore not due to selection for G1 cells. Likewise, increases in G2/M cells in large pore migration of cells not treated with any drug (Figure 4A, iii and iv) are not due to selection for G2 cells.
Testing the cell-cycle independence of excess DNA damage at the level of pathways
A direct assessment was needed to determine whether partial loss of multiple DNA repair factors—as occurs during constricted migration via both exclusion and rupture (Figures 1B and 2Ai)—can cause excess DNA damage in both 2N and 4N cells as seen during constricted migration (Figures 5Bi and 6Av). Partial knockdown of four key repair proteins KU80, BRCA1, BRCA2, and RPA1 (Figure 7A) that exhibit different activities throughout the cell cycle indeed causes a large increase in γH2AX foci even in nonmigrated (“Top”) cells (Figure 6B, i and ii). In both 2N and 4N cells, the excess DNA damage in the “si4” knockdown cells occurs equally on “Top” and “Bottom” (Figure 6Bii), perhaps because the high number of foci in si4 nuclei reflects a “maximum,” and cells with even more severe damage tend to apoptose and go undetected. The increase in γH2AX foci after migration is once again the same for 2N and 4N cells, whether nontreated, siCtrl, or si4 cells (Figure 6Biii). The experiment thus confirms that damage due to loss of repair factors arises throughout the cell cycle, not just in S phase.
FIGURE 7:

Partial knockdown of DNA repair causes excess DNA damage similarly in early and late phases of the cell cycle, while overexpression of a transcription factor that polarizes for migration illustrates “go, damage, and then grow.” (A) U2OS cells were treated with a single siRNA pool of BRCA1, BRCA2, RPA1, and KU80, leading to a >50% knockdown (KD) of these factors, as seen by Western blot (i) and immunofluorescence microscopy (ii). (B) (i) si4 KD cells, along with nontreated and siCtrl cells, were migrated through 3-μm pores for 24 h. (ii) Treating U2OS cells with single siRNAs leads to excess γH2AX foci among nonmigrated (“Top”) 2N and 4N cells. Constricted migration apparently does not cause a further increase in γH2AX foci among si4 cells, possibly because cells with even more severe damage tend to apoptose and go undetected. Asterisks indicate a significant difference (p < 0.005) in γH2AX foci between “Bottom” and “Top” cells; the difference is not significant for 4N siCtrl cells (p = 0.1). (iii) The fold increase in γH2AX foci after migration is the same for 2N and 4N si4 cells, just as it is for nontreated and siCtrl cells (p > 0.05 in every case). Note that the measured foci ratio for 2N siCtrl cells is not equal to the ratio for NT cells. This discrepancy seems more likely to be due to variability between experiments, as documented in Figure 5Bi, than to any effect of the siCtrl given that the siTOP2A experiment (Supplemental Figure S4A) shows siCtrl behavior that is much more similar to NT (≥35 cells per condition, error bars represent SEM). (C) (i) Compared to rounder cell types, cell types that have more elongated nuclei in sparse culture exhibit blebs at lower frequency after 3-μm-pore migration. The “spindle-shaped U2OS clone” has an elongated, stable MSC-like shape due to upregulation of the transcription factor GATA4, which mediates microtubule assembly (Rivera-Feliciano et al., 2009). Aspect ratio values were averaged across two-dimensional low-density and 3 μm bottom conditions. Asterisks indicate a significant difference in % bleb-positive (p = 0.01) and nuclear aspect ratio (p = 0.01) between U2OS bulk and U2OS spindle-shaped clone cells (≥150 cells per cell type, n = 2 experiments, error bars represent SEM). (ii) Schematic illustrating a round nucleus (upper) and a more elongated nucleus (lower) squeezing into a narrow pore. Since the nuclear envelope can support pressure gradients over hours-long timescales (Petrie et al., 2014), there should be no significant flow of fluid across the envelope during migration, and the nuclear volume—which is the same for the round and elongated nuclei—is conserved. When the migrating nucleus is spherical, any deformation that conserves the volume must increase the surface area of the nuclear envelope and lamina, constituting lamina dilation. Because the lower nucleus is already elongated prior to migration, the same initial area Ai has already grown to a slightly larger initial area Ai′. Thus, the change in area ∆A′ = Af - Ai′ is smaller than ∆A = Af - Ai, meaning perhaps less severe lamina dilation for the more elongated nucleus. (D) Plots refer to 3-μm-pore migration. (i) Like bulk U2OS cells, the spindle-shaped U2OS clone shows similar migration-induced excesses of γH2AX foci in early and late phases of the cell cycle. (ii) The clone migrates nearly twice as fast as U2OS bulk but exhibits the same % 4N after migration (≥120 cells per cell type, error bars represent SEM).
Finally, we took advantage of a U2OS clone that—via a chromosome gain—overexpresses by approximately twofold the transcription factor GATA4; GATA4 mediates microtubule assembly, and its up-regulation gives the clone an elongated shape similar to that of mesenchymal stem cells (MSCs) (Irianto et al., 2017). Compared to bulk U2OS cells, this spindle-shaped U2OS clone has a higher nuclear aspect ratio in sparse culture and also exhibits blebs with significantly lower frequency after 3-μm-pore migration (Figure 7Ci). Normal, primary MSCs also show a low tendency to bleb (∼15% [Irianto et al., 2017]), which supports the idea that an elongated nuclear shape minimizes lamina dilation and disruption upon constriction (Figure 7Cii). Like U2OS bulk cells, the spindle-shaped U2OS clone shows nonetheless an approximately 1.5-fold increase in γH2AX foci after migration through 3-μm pores, with the damage occurring at similar rates in both early and late phases of the cell cycle (Figure 7Di). After a 24-h-long migration period, the number of spindle-shaped clone cells on the bottom of a 3-μm-pore membrane is twice that observed for bulk U2OS; however, the clone shows the same (low) proportion of 4N cells (Figure 7Dii). Thus, the clone’s higher cell density on “3 μm bottom” is likely due to a migratory rather than a proliferative advantage, especially because these cells have the same doubling time as bulk U2OS in two-dimensional culture (Irianto et al., 2017). Spindle-shaped clone cells, like U2OS bulk cells, “go then grow,” with the noted delay in the “grow” phase after constriction.
DISCUSSION
Small pores (3 μm) squeeze the chromatin, dilate the lamina, and rupture nuclei unlike large pores (8 μm) (Figures 1 and 2, A and C). Related to these processes but not strictly coupled to nuclear blebbing, many key regulators of DNA, including repair factors, mislocalize (Figure 2, A and C); depletion of repair factors provides one possible mechanism for an excess of γH2AX foci observed only with small pores (Irianto et al., 2017). Importantly, such excess DNA damage occurs equally in early and late phases of cell cycle even in the absence of replication (Figures 5B, 6A, and 7B). Large pores and small pores also show opposite effects on cell cycle, with small pores always suppressing G2/M phases (Figures 4 and 6A) without selection (Figure 6B). By contrast, when contact-inhibited cells migrate through large pores from high-density to low-density environments, they are able to spread and reenter cell cycle as expected (Figure 4, 6A). The latter process might seem intuitive (Figure 1A), and yet the increased replication—which can increase the basal level of DNA damage in cells (Técher et al., 2017)—does not lead to significantly more DNA damage foci of γH2AX after migration through large pores (Figure 5A). Blocking replication in migration through both small pores and large pores yields the same results for DNA damage as with untreated cells. The results ultimately address what is probably the most important question about three-dimensional migration in showing that cell cycle and DNA replication do not explain the excess in DNA damage that results from constricted migration.
Migration through small rings has been described as somehow selecting for G1/eS cells (Panagiotakopoulou et al., 2016), but PD blockade (Figure 6) indicates no selection of G1 versus G2 cells in constricted migration through long pores. Without such blockade, cells need to repair DNA damage sufficiently to progress through cell cycle (Dasika et al., 1999), and indeed later phases of the cell cycle exhibit fewer damage foci per DNA even after constricted migration (Figure 3Biii and Supplemental Figure S2). Documentation of this expected trend—of decreasing DNA damage in later cell cycle—adds confidence to our classification of cell-cycle phases and to our counting of γH2AX foci. Adding DNA damage during S phase with the drug etoposide requires repair factors to fix the excess damage (Irianto et al., 2017) and thus affects cell cycle, but etoposide does not affect cell numbers that migrate through small pores, including both 2N and 4N cells (Supplemental Figure S4B).
Interestingly, the mesenchymal-like U251 cells exhibit migration-induced nuclear blebs at a similarly low frequency (∼15%) to primary MSCs (Irianto et al., 2017), which is far below the frequency of the epithelial-like A549 and U2OS cells (∼60–80%) (Figures 1Aiii and 2C). MSCs have a normal diploid genome unlike the cancer lines, and so differences in nuclear bleb frequency could be physical rather than cancer related. The percentage of bleb-positive nuclei seems to trend with the resting shapes of cells and their nuclei in sparse culture, with more elongated nuclei exhibiting a lower rate of bleb formation (Figure 7Ci). It is tempting to propose that lamin levels might explain the rate of bleb formation given that U251 cells are notably low in lamin-A (Swift et al., 2013), but MSCs have very high levels of lamin-A (Harada et al., 2014), and the spindle-shaped U2OS clone has wild-type levels, meaning that lamin abundance does not easily explain the percentage of blebbing. In contrast, a nuclear shape more elongated than those studied here could slip through a small pore unscathed—which probably applies to neutrophils (Irianto et al., 2017). Importantly, while nuclear blebs provide a relatively clear indication of nuclear envelope rupture, they might also underestimate processes of nuclear factor mislocalization. After constricted migration, all cancer lines exhibit a similar level of DNA repair factor mislocalization to cytoplasm as well as an excess of DNA damage (Figure 2C), and the latter was also observed for primary MSCs (Irianto et al., 2017).
Our findings are also relevant to the “go or grow” hypothesis that is long debated in cancer research and posits that proliferation and migration are spatiotemporally exclusive events (Giese et al., 1996; Garay et al., 2013). Our results for constricted migration indicate that additional mutation-relevant processes are involved in a “go, damage, and then grow” behavior: the spindle-shaped U2OS clone migrates twice as fast as U2OS bulk cells but shows the same DNA damage and repressed %4N after migration (Figure 7D). The surprising delay in growth would not be evident in two-dimensional or in soft three-dimensional environments but has implications for the invasive migration of cancer cells away from a tumor mass and into nearby stiff tissues or blood capillaries (Figure 1Ai).
Finally, cancer risk has been reported to correlate with DNA replication (via mutation errors) in tissue-resident stem cells (Tomasetti and Vogelstein, 2015). However, the correlation is weak (R2 = 0.6) which has suggested to us and others that additional mechanisms contribute to mutations (Nowak and Waclaw, 2017) (Supplemental Figure S1A, ii and iii). Genomic variation increases after migration of cancer cells through rigid constricting pores (Irianto et al., 2017), and the results here support such a cell-cycle-independent process in stiff tissue as an orthogonal mechanism of cancer risk.
MATERIALS AND METHODS
Cell culture
U2OS human osteosarcoma and U251 human glioblastoma cells were cultured in DMEM high-glucose medium (Life Technologies), supplemented with 10% fetal bovine serum (FBS) and 1% penicillin/streptomycin (MilliporeSigma). A549 human lung cancer epithelial cells were cultured in supplemented Ham’s F12 medium (Life Technologies). All of these cancer lines are hypotriploid, and neither the “2N”/”4N” nor the “2C”/”4C” nomenclature adequately describes the aneuploidy of these cell lines. A549 cells with endogenously GFP-tagged CTNNB1 and RFP-tagged LMNB1 were purchased from MilliporeSigma. The U2OS spindle-shaped clone was generated by 17 consecutive migrations of wild-type clonal U2OS cells through 3-μm Transwell pores, as described in Irianto et al. (2017). A k-means clustering analysis of mRNA levels—combined with functional analyses of the transcript changes by DAVID Bioinformatics 6.7 (Huang et al., 2009)—revealed the clone to be enriched for the microtubule cytoskeletal system, notably the transcription factor GATA4. For cell-cycle control experiments, 10 μM of the CDK4/6 inhibitor PD: palbociclib (Cayman Chemical) was added to two-dimensional cell culture for 72 h prior to Transwell migration (described below). For topoisomerase experiments, 10 μM of the topoisomerase II poison etoposide (MilliporeSigma) was maintained at the top and bottom of the Transwell membrane during migration.
Transfection
GFP-53BP1 was a gift from Roger Greenberg of the University of Pennsylvania (Cho et al., 2015). We used small interfering RNAs (siRNAs) purchased from Santa Cruz (siTOP2A, sc-36695) and Dharmacon (ON-TARGETplus SMARTpool siBRCA1, L-003461-00; siBRCA2, L-003462-00; siKu80, L-010491-00; siRPA1, L-015749-01; and nontargeting siRNA, D-001810-10). We transfected either siTOP2A (30 nM), pooled siRNA oligos (25 nM; four siRNAs/target), or GFP-53BP1 (0.5 ng/ml) with 1 μg/ml Lipofectamine 2000 (Invitrogen, Life Technologies) for 72 h (siRNA) or 24 h (GFP) in corresponding media, supplemented with 10% FBS. Knockdown efficiencies of siTOP2A and siBRCA1 were determined by immunofluorescence microscopy; knockdown efficiencies of siBRCA2, siKU80, and siRPA1 were determined by Western blot via standard methods.
Transwell migration
Migration assays used 24-well inserts with 3- or 8-μm-pore filters. Cells were first detached and then seeded on top of a Transwell membrane (Corning) at a density of 3 × 10⁵ cells/cm2. Medium supplemented with 10% FBS and 1% penicillin/streptomycin was added to the top and bottom of the membrane such that no nutrient gradient was established. After 24-h incubation (unless otherwise noted) at 37°C and 5% CO2, Transwell membranes were formaldehyde-fixed and stained as described below.
Immunostaining and imaging
Cells were 1) fixed in 4% formaldehyde (MilliporeSigma) for 15 min, 2) permeabilized by 0.25% Triton-X (MilliporeSigma) for 10 min, and 3) blocked with 5% bovine serum albumin (BSA) (MilliporeSigma) for 30 min, all at room temperature. Then cells were incubated in primary antibodies overnight at 4o. The antibodies used include lamin-A/C (Santa Cruz and Cell Signaling), lamin-B (Santa Cruz), KU80 (Cell Signaling), γH2AX (MilliporeSigma), 53BP1 (Abcam), phosphorylated S1981 ATM (Abcam), topoisomerase IIα (Santa Cruz), BRCA1 (Santa Cruz), BRCA2 (MilliporeSigma), and RPA1 (Santa Cruz). Finally, cells were incubated in secondary antibodies (Thermo Fisher) for 1.5 h, and their nuclei were stained with 8 µM Hoechst 33342 (Thermo Fisher) for 15 min, all at room temperature. Cells were mounted with Prolong Gold antifade reagent (Invitrogen, Life Technologies). Epifluorescence imaging was performed on an Olympus IX71—with a 40×/0.6 NA objective—and a digital electron-multiplying charge-coupled device (EMCCD) camera (Cascade, Photometrics). For confocal imaging, we used a Leica TCS SP8 system, equipped with either a 63×/1.4 NA oil-immersion or a 40×/1.2 NA water-immersion objective. Superresolution images were taken using a Leica TCS SP8 STED 3X system with a 100×/1.4 NA oil-immersion objective. ImageJ (Schneider et al., 2012) was used to quantify the resulting images.
EdU labeling and staining
EdU (10 µM, Abcam) was added to two-dimensional culture or Transwell membrane 1 h before fixation and permeabilization. After permeabilization, samples were stained with 100 mM Tris (pH 8.5) (MilliporeSigma), 1 mM CuSO4 (MilliporeSigma), 100 µM Cy5 azide dye (Cyandye), and 100 mM ascorbic acid (MilliporeSigma) for 30 min at room temperature. Samples were thoroughly washed and then underwent immunostaining as described above.
Micropipette aspiration
Prior to aspiration, gene-edited A549 RFP-LMNB1 cells were first detached using 0.05% trypsin-EDTA (Life Technologies) and then incubated in 0.2 µg/ml latrunculin-A (MilliporeSigma) and 8 µM Hoechst 33342 (Thermo Fisher) for 30 min at 37o, as described previously (Pajerowski et al., 2007). Finally, cells were resuspended in phosphate-buffered saline with 1% BSA and 0.2 μg/ml latrunculin-A. Aspiration experiments were imaged using a Nikon TE300 epifluorescence microscope—with a 60×/1.25 NA oil-immersion objective—and a digital EMCCD camera (Cascade, Photometrics). Images were later quantified in ImageJ (Schneider et al., 2012).
Theoretical model for curvature-driven dilational flow of lamin-B
In contrast to lamin-A monomers, lamin-B monomers include a farnesyl group that is hydrophobic and tethers the monomers to the hydrophobic part of the inner lipid membrane of the nuclear envelope (Hennekes and Nigg, 1994). Owing to these connections, lamin-B filaments follow the contour of the lipid membrane at monomer length scales; the filaments are forced to bend if distortions are imposed on the nuclear envelope, which may contribute significantly to the bending rigidity of the entire envelope. We hypothesize that the lamin-B filaments, although fairly stable, can locally slide across the bilayer and “flow” at sufficiently long times. This flow can result in a transfer of lamin-B from high-curvature regions to less curved ones to minimize the overall bending energy of the nuclear envelope. Micropipette aspiration is one example of an experimental technique that distorts the nucleus. The nucleus, which is approximately spherical with a uniform lamin-B concentration (measured by the fluorescence intensity of endogenously RFP-tagged lamin-B) when undeformed, is deformed to a shape similar to the one depicted in Supplemental Figure S1B (inset) during aspiration. This deformed shape can be roughly divided into three regions: 1) a nuclear region, which is a spherical section of radius Rn; 2) a cylindrical region with radius Rp (the radius of the pipette) and length L; and 3) a tip region, which is a spherical section with radius Rp. The shape of the nuclear envelope must change smoothly between the regions (to avoid the infinite bending energy associated with cusps); therefore, the different regions must be connected by relatively small transition regions where the bending energy may be higher than in the smooth regions that surround them. The distortions induced by aspiration promote redistribution of lamin-B from the tip region to the nuclear region through the cylinder and connective transition regions.
In what follows, we use a phenomenological model of the various energies involved to predict the time-dependent redistribution of lamin-B as a consequence of micropipette aspiration. High-resolution imaging of the lamina reveals a multilayered structure, with each layer having a thickness of ∼3.5 nm and a mesh size that spatially varies (Turgay et al., 2017). We coarse-grain the lamin B layer and model it as a continuous, viscoelastic gel layer that is locally isotropic (i.e., the bending energy per unit area is independent of the bending direction). To account for the inhomogeneity in the network mesh size (and, hence, in the lamin-B density), we define a local lamin-B concentration, denoted CB. Linear elasticity predicts the bending energy per unit area fB of a locally isotropic gel layer to be
(Landau et al., 1986), where MB is the bending modulus (units of energy) and R1,2 are the two local radii of curvature. Because we expect the bending modulus to be proportional to the number of filaments that are being deformed, we relate the bending modulus MB and CB by the phenomenological equation RB = αCB (α is a parameter related to the microscopic structure of the lamin-B network).
We denote the time-dependent lamin-B concentration in the nuclear, cylindrical, and tip regions of the aspirated nucleus by CB,n, CB,c, and CB,t, respectively. We assume that the local strain (change in area) due to aspiration is small, and therefore we take the initial values of the concentrations to be uniform and equal to CB,0. The bending energies per unit area of the lamin-B network in the nuclear, cylindrical, and tip regions are therefore initially 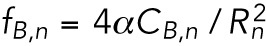 ,
, 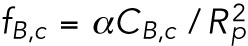 (in the cylinder, one of the radii of curvature is infinity), and
 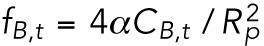 , respectively. Over sufficiently long timescales, the lamin-B monomers may associate and dissociate from the filament structure. In the cylindrical region, which has two different radii of curvature, such association/dissociation may cause local rearrangements of the lamin-B network such that the network’s local isotropy breaks down; the driving force for a nonisotropic rearrangement is the reorientation of the lamin-B filaments along the axis of the cylinder in a way that reduces the bending energy. However, fluorescence recovery after photobleaching (FRAP) experiments show that the turnover time of lamin-B is on the order of a day (Daigle et al., 2001), while the experiment duration is on the order of an hour, meaning that the effect of lamin-B association/dissociation can be disregarded.
In equilibrium, the distribution of the lamin-B filaments is set by the competition between the bending energy in each region and the entropy, as expressed by the factor of kBT in the Boltzmann factor. Thus, the lamin-B concentration in each region is proportional to the Boltzmann factor: CB∼ exp(−βEB), where 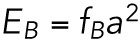 is the total bending energy of a filament (α is a molecular length scale related to the lamin B network structure) and
 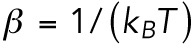 . The dynamical process that leads to the equilibrium configuration may be two-dimensional flow of lamin filaments from the tip to the nuclear region, or it may be detachment of lamin-B monomers from the network and bilayer, followed by three-dimensional diffusion and repolymerization and attachment in another region. FRAP studies indicate that the turnover timescale of lamin-B protein is on the order of a day (Daigle et al., 2001), so we assume that in the case of an hours-long micropipette aspiration experiment, the mechanism that governs lamin-B redistribution is two-dimensional flow and not lamin-B degradation or production.
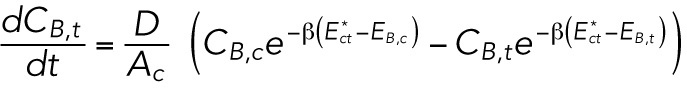
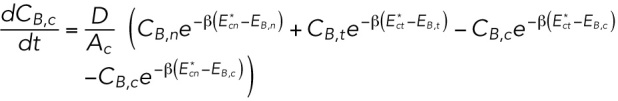
We now calculate the flow rate of lamin-B using a phenomenological master equation for the exchange of lamin-B between the nucleus, cylinder, and tip regions. The transition zones that connect these regions must be crossed by the flowing filaments, which have higher bending energies in the transition zones than in the regions around them. The transition zones thus provide kinetic energy barriers for the lamin-B flow, which thermodynamically goes “downhill” from the high-bending energy tip region to the low-bending energy nuclear region. We denote the bending energy of a filament in the cylinder-tip and cylinder-nuclear connection zone by  and
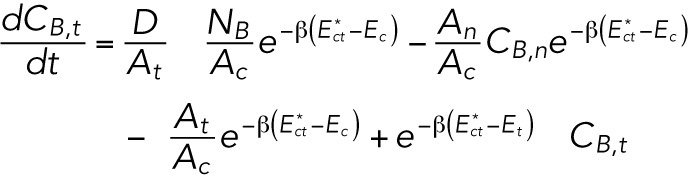
and  , respectively. The rate equations for the lamin-B flow can thus be written as
 |
 |
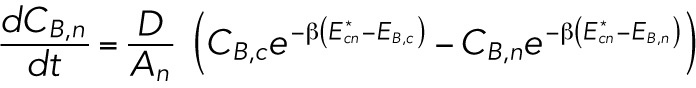 |
where D is an effective diffusion constant that mainly depends on the friction between the lamin-B monomers and the lipid bilayer and the A’s are the areas of the different regions. We note that in the specific geometry depicted in Supplemental Figure S1B (inset), no intermediate configuration of high bending energy is needed to flow from the tip to the cylinder region. This is a special case that results from the smooth transition between the two regimes, which naturally excludes “cusped” regions.
To solve this set of equations, we use conservation of lamin-B NB = CB,tAt + CB,nAn + CB,cAc (the amount of lamin B in the connection zones is negligible due to the very small dimensions of these zones). Therefore
 |
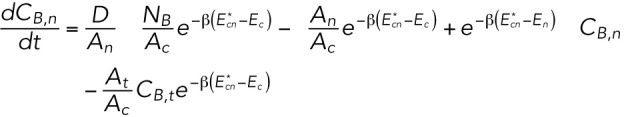 |
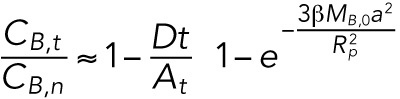
This is a set of two linear ordinary differential equations with constant coefficients and, therefore, is analytically solvable. However, we are interested only in the early time (relative to the timescale in which the system undergoes major reorganization to reach steady state, which can be estimated as ∼1 d according to FRAP studies) solution in which the dynamics are linear. For timescales, such as the approximately hour-long aspiration experiment, that are much smaller than the FRAP timescale (>1 d), the concentrations of the lamin-B can be replaced with the initial concentration CB,0 (together with  ). This substitution results in the approximate early-time solution for CB,t and CB,n:
 |
 |
These results are consistent with linear response theory: if the bending energy gradients are weak compared with the thermal energy, the exponents can be expanded to linear order. Expansion shows that the flow rate of the molecules between the tip and the cylinder regions is proportional to the energy difference Ec–Et, while the flow rate from the cylinder region to the nuclear region is proportional to Ec–En.
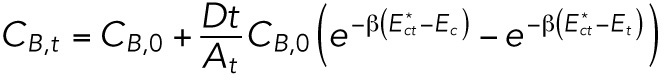
To test these predictions in a way that is robust to photobleaching of the RFP-lamin-B monomers, we derive an expression for the ratio of CB,t/CB,t, which can be measured experimentally. To linear order in time, the ratio CB,t/CBn is
 |
The two terms in the parentheses,
and
, account for the flow of lamin-B from the tip to the cylinder region and from the cylinder to the nuclear region. Since the area of the nuclear region is much greater than the area of the tip region, the relative increase in lamin-B concentration in the nuclear region due to the flow is small. However, the relative decrease in CB,t due to the flow into the cylinder can be significant. For that reason, the contribution to CB,t/CB,n of the flow toward the nuclear region can be neglected compared with the contribution of the flow away from the tip region. Furthermore, the transition from the tip region to the nuclear region is smooth; thus, the lamin filaments are not required to bend into an intermediate form with high bending energy to flow to the cylinder, which means that  . The expression for the ratio of the concentrations in the tip and the nucleus at early times can thus be written as
 |
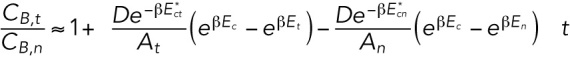
First-order expansion of the exponent for  and substitution of
  lead to the final form for the ratio of concentrations as a function of time:
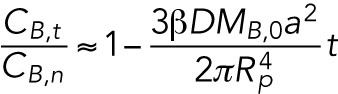 |
This form is accurate for early times, when the radius of the pipette  is much smaller than the radius of the nucleus but still greater than the size of a lamin-B filament
  .
.
We therefore suggest that the initial rate of the decreasing ratio of fluorescence intensities of the lamin-B in the tip and nuclear regions (which is equal to the ratio of the lamin concentrations in the two regions) scales with . This prediction is consistent with the experimental measurement as can be seen in Supplemental Figure S1B.
Supplementary Material
Acknowledgments
This work was supported by the National Cancer Institute of the National Institutes of Health under PSOC Award U54 CA193417. The content is solely the responsibility of the authors and does not necessarily represent the official views of the National Institutes of Health. Support from the National Science Foundation (DMR-1120901 to Penn’s Materials Research Science and Engineering Center) is also gratefully acknowledged.
Abbreviations used:
- 53BP1
p53 binding protein 1
- AR
aspect ratio
- ATM
ataxia telangiectasia mutated
- ATMi
ATM inhibitor
- ATR
ATM- and Rad3-related
- AU
arbitrary unit
- BRCA1
breast cancer 1
- BRCA2
breast cancer 2
- BSA
bovine serum albumin
- CDK4/6
cyclin-dependent kinase 4/6
- EdU
5-ethynyl-2′-deoxyuridine
- EMCCD
electron-multiplying charge-coupled device
- eS
early synthesis
- FBS
fetal bovine serum
- FRAP
fluorescence recovery after photobleaching
- G1
gap 1
- G2
gap 2
- GFP
green fluorescent protein
- gH2AX
phosphorylated histone H2AX
- hi
high
- KD
knockdown
- LMNB1
lamin-B1
- lo
low
- lS
late synthesis
- M
mitosis
- med
medium
- MSC
mesenchymal stem cell
- NLS
nuclear localization sequence
- NT
nontreated
- PD
palbociclib
- RFP
red fluorescent protein
- RPA1
replication protein A1
- S
synthesis
- si4
pool of siKU80, siBRCA1, siBRCA2, and siRPA1
- siCtrl
small interfering control
- siRNA
small interfering RNA
- TOP2A
topoisomerase IIa
Footnotes
This article was published online ahead of print in MBoC in Press (http://www.molbiolcell.org/cgi/doi/10.1091/mbc.E18-02-0079) on May 9, 2018.
REFERENCES
- Bollard J, Miguela V, de Galarreta MR, Venkatesh A, Bian CB, Roberto MP, Tovar V, Sia D, Molina-Sánchez P, Nguyen CB, et al. (2017). Palbociclib (PD-0332991), a selective CDK4/6 inhibitor, restricts tumour growth in preclinical models of hepatocellular carcinoma. Gut , 1286–1296. [DOI] [PMC free article] [PubMed] [Google Scholar]
- Burma S, Chen BP, Murphy M, Kurimasa A, Chen DJ. (2001). ATM phosphorylates histone H2AX in response to DNA double-strand breaks. J Biol Chem , 42462–42467. [DOI] [PubMed] [Google Scholar]
- Cho NW, Dilley RL, Lampson MA, Greenberg RA. (2015). Interchromosomal homology searches drive directional ALT telomere movement and synapsis. Cell , 108–121. [DOI] [PMC free article] [PubMed] [Google Scholar]
- D’Abrantes S, Gratton S, Reynolds P, Kriechbaumer V, Mckenna J, Barnard S, Clarke DT, Botchway SW. (2018). Super-resolution nanoscopy imaging applied to DNA double-strand breaks. Radiat Res , 19–31. [DOI] [PubMed] [Google Scholar]
- Daigle N, Beaudouin J, Hartnell L, Imreh G, Hallberg E, Lippincott-Schwartz J, Ellenberg J. (2001). Nuclear pore complexes form immobile networks and have a very low turnover in live mammalian cells. J Cell Biol , 71–84. [DOI] [PMC free article] [PubMed] [Google Scholar]
- Dasika GK, Lin S-CJ, Zhao S, Sung P, Tomkinson A, Lee EY-HP. (1999). DNA damage-induced cell cycle checkpoints and DNA strand break repair in development and tumorigenesis. Oncogene , 7883–7899. [DOI] [PubMed] [Google Scholar]
- Delarue M, Poterewicz G, Hoxha O, Choi J, Yoo W, Kayser J, Holt L, Hallatschek O. (2017). SCWISh network is essential for survival under mechanical pressure. Proc Natl Acad Sci USA , 13465–13470. [DOI] [PMC free article] [PubMed] [Google Scholar]
- Denais CM, Gilbert RM, Isermann P, Mcgregor AL, te Lindert M, Weigelin B, Davidson PM, Friedl P, Wolf K, Lammerding J. (2016). Nuclear envelope rupture and repair during cancer cell migration. Science , 353–358. [DOI] [PMC free article] [PubMed] [Google Scholar]
- Feng L, Fong K-W, Wang J, Wang W, Chen J. (2013). RIF1 counteracts BRCA1-mediated end resection during DNA repair. J Biol Chem , 11135–11143. [DOI] [PMC free article] [PubMed] [Google Scholar]
- Fuse T, Tanikawa M, Nakanishi M, Ikeda K, Tada T, Inagaki H, Asai K, Kato T, Yamada K. (2000). p27Kip1 expression by contact inhibition as a prognostic index of human glioma. J Neurochem , 1393–1399. [DOI] [PubMed] [Google Scholar]
- Garay T, Juhász É, Molnár E, Eisenbauer M, Czirók A, Dekan B, László V, Alireza Hoda M, Döme B, Tímár J, et al. (2013). Cell migration or cytokinesis and proliferation?—Revisiting the “go or grow” hypothesis in cancer cells in vitro. Exp Cell Res , 3094–3103. [DOI] [PubMed] [Google Scholar]
- Giese A, Loo MA, Tra N, Haskett D, Coons SW, Berens ME. (1996). Dichotomy of astrocytoma migration and proliferation. Int J Cancer , 275–282. [DOI] [PubMed] [Google Scholar]
- Harada T, Swift J, Irianto J, Shin JW, Spinler KR, Athirasala A, Diegmiller R, Dingal PCDP, Ivanovska IL, Discher DE. (2014). Nuclear lamin stiffness is a barrier to 3D migration, but softness can limit survival. J Cell Biol , 669–682. [DOI] [PMC free article] [PubMed] [Google Scholar]
- Hennekes H, Nigg EA. (1994). The role of isoprenylation in membrane attachment of nuclear lamins. J Cell Sci , 1019–1029. [DOI] [PubMed] [Google Scholar]
- Huang DW, Sherman BT, Lempicki RA. (2009). Systematic and integrative analysis of large gene lists using DAVID bioinformatics resources. Nat Protoc , 44–57. [DOI] [PubMed] [Google Scholar]
- Irianto J, Pfeifer CR, Bennett RR, Xia Y, Ivanovska IL, Liu AJ, Greenberg RA, Discher DE. (2016). Nuclear constriction segregates mobile nuclear proteins away from chromatin. Mol Biol Cell , 4011–4020. [DOI] [PMC free article] [PubMed] [Google Scholar]
- Irianto J, Xia Y, Pfeifer CR, Athirasala A, Ji J, Alvey C, Tewari M, Bennett RR, Harding SM, Liu AJ, et al. (2017). DNA damage follows repair factor depletion and portends genome variation in cancer cells after pore migration. Curr Biol , 210–223. [DOI] [PMC free article] [PubMed] [Google Scholar]
- Kumar A, Mazzanti M, Mistrik M, Kosar M, Beznoussenko GV, Mironov AA, Massimiliano G, Parazzoli D, Shivashankar GV, Scita G, et al. (2014). ATR mediates a checkpoint at the nuclear envelope in response to mechanical stress. Cell , 633–646. [DOI] [PMC free article] [PubMed] [Google Scholar]
- Landau LD, Pitaevskii LP, Kosevich AM, Lifshitz EM. (1986). Theory of Elasticity (Vol. 7 of A Course of Theoretical Physics), 3rd Ed., Oxford, UK: Butterworth-Heinemann Publishers. [Google Scholar]
- Morais MCC, Stuhl I, Sabino AU, Lautenschlager WW, Queiroga AS, Tortelli TC, Jr, Chammas R, Suhov Y, Ramos AF. (2017). Stochastic model of contact inhibition and the proliferation of melanoma in situ. Sci Rep , 8026. [DOI] [PMC free article] [PubMed] [Google Scholar]
- Nowak MA, Waclaw B. (2017). Genes, environment, and “bad luck.” Science , 1266–1267. [DOI] [PubMed] [Google Scholar]
- Pajerowski JD, Dahl KN, Zhong FL, Sammak PJ, Discher DE. (2007). Physical plasticity of the nucleus in stem cell differentiation. Proc Natl Acad Sci USA , 15619–15624. [DOI] [PMC free article] [PubMed] [Google Scholar]
- Panagiotakopoulou M, Bergert M, Taubenberger A, Guck J, Poulikakos D, Ferrari A. (2016). A nanoprinted model of interstitial cancer migration reveals a link between cell deformability and proliferation. ACS Nano , 6437–6448. [DOI] [PubMed] [Google Scholar]
- Petrie RJ, Koo H, Yamada KM. (2014). Generation of compartmentalized pressure by a nuclear piston governs cell motility in 3D matrix. Science , 1062–1065. [DOI] [PMC free article] [PubMed] [Google Scholar]
- Raab M, Gentili M, de Belly H, Thiam HR, Vargas P, Jimenez AJ, Lautenschlaeger F, Voituriez R, Lennon-Dumenil AM, Manel N, et al. (2016). ESCRT III repairs nuclear envelope ruptures during cell migration to limit DNA damage and cell death. Science , 359–362. [DOI] [PubMed] [Google Scholar]
- Rivera-Feliciano J, Lee K-H, Kong SW, Rajagopal S, Ma Q, Springer Z, Izumo S, Tabin CJ, Pu WT. (2009). Development of heart valves requires Gata4 expression in endothelial-derived cells. Development , 3607–3618. [DOI] [PMC free article] [PubMed] [Google Scholar]
- Salic A, Mitchison TJ. (2008). A chemical method for fast and sensitive detection of DNA synthesis in vivo. Proc Natl Acad Sci USA , 2415–2420. [DOI] [PMC free article] [PubMed] [Google Scholar]
- Sarveswaran K, Kurz V, Dong Z, Tanaka T, Penny S, Timp G. (2016). Synthetic capillaries to control microscopic blood flow. Sci Rep , 21885. [DOI] [PMC free article] [PubMed] [Google Scholar]
- Schneider CA, Rasband WS, Eliceiri KW. (2012). NIH Image to ImageJ: 25 years of image analysis. Nat Methods , 671–675. [DOI] [PMC free article] [PubMed] [Google Scholar]
- Swift J, Ivanovska IL, Buxboim A, Harada T, Dingal PCDP, Pinter J, Pajerowski JD, Spinler KR, Shin J, Tewari M, et al. (2013). Nuclear lamin-A scales with tissue stiffness and enhances matrix-directed differentiation. Science , 1240104. [DOI] [PMC free article] [PubMed] [Google Scholar]
- Técher H, Koundrioukoff S, Nicolas A, Debatisse M. (2017). The impact of replication stress on replication dynamics and DNA damage in vertebrate cells. Nat Rev Genet , 535–550. [DOI] [PubMed] [Google Scholar]
- Tomasetti C, Vogelstein B. (2015). Variation in cancer risk among tissues can be explained by the number of stem cell divisions. Science , 78–81. [DOI] [PMC free article] [PubMed] [Google Scholar]
- Turgay Y, Eibauer M, Goldman AE, Shimi T, Khayat M, Ben-Harush K, Dubrovsky-Gaupp A, Sapra KT, Goldman RD, Medalia O. (2017). The molecular architecture of lamins in somatic cells. Nature , 261–264. [DOI] [PMC free article] [PubMed] [Google Scholar]
- Wolf K, Alexander S, Schacht V, Coussens LM, von Andrian U, van Rheenen J, Deryugina E, Friedl P. (2009). Collagen-based cell migration models in vitro and in vivo. Semin Cell Dev Biol , 931–941. [DOI] [PMC free article] [PubMed] [Google Scholar]
Associated Data
This section collects any data citations, data availability statements, or supplementary materials included in this article.