

Abstract
With the evolution of technology, the fields of medicine and science have also witnessed numerous advancements. In medical emergencies, a few minutes can be the difference between life and death. The obstacles encountered while providing medical assistance can be eliminated by ensuring quicker care and accessible systems. To this effect, the proposed end-to-end system—automated emergency paramedical response system (AEPRS) is semi-autonomous and utilizes aerial distribution by drones, for providing medical supplies on site in cases of paramedical emergencies as well as for patients with a standing history of diseases. Security of confidential medical information is a major area of concern for patients. Confidentiality has been achieved by using decentralised distributed computing to ensure security for the users without involving third-party institutions. AEPRS focuses not only on urban areas but also on semi-urban and rural areas. In urban areas where access to internet is widely available, a healthcare chatbot caters to the individual users and provides a diagnosis based on the symptoms provided by the patients. In semi-urban and rural areas, community hospitals have the option of providing specialised healthcare in spite of the absence of a specialised doctor. Additionally, object recognition and face recognition by using the concept of edge AI enables deep neural networks to run on the edge, without the need for GPU or internet connectivity to connect to the cloud. AEPRS is an airborne emergency medical supply delivery system. It uses the data entered by the user to deduce the best possible solution, in case of an alerted emergency situation and responds to the user accordingly.
Keywords: AEPRS, GLCM, Neural computing stick, Healthcare chatbot, Edge AI, Drones, Stroke, Internet of medical things, Healthcare analytics, Deep learning in healthcare
Introduction
One of the driving motivations for AEPRS is to provide better and feasible solutions for existing problems that span the socio-economic strata.
The noteworthy technologies that have been incorporated into the AEPRS are blockchain technology and delivery by drones. Creating another secure system by formulating policies that require participation of a middleman or a third party authority for regulating or generating the security features is futile as the system will fail if the third party authority is compromised. Blockchain technology is a decentralised system that is more robust to failure and provides better security to the users, thus making it the ideal choice for AEPRS.
Usage of drones to carry out tasks that require speed and precision is gaining traction.
Fundamentally, there is a vast difference in the needs of urban areas and semi-rural and rural areas, in terms of medical care. In urban areas, especially in countries like India where there is no dedicated lane for ambulances, there is a pressing need for faster response to medical emergencies. In the semi-urban and rural areas, reachability is the main problem faced today. The idea of a drone-based paramedical response system is important because it can overcome the problems currently being faced in urban, semi-rural and rural areas.
The objectives of AEPRS includes providing reliable and accurate assistance to users during emergency medical situations through an intuitive interface that can be carried across all the devices in order to equip the community hospitals in semi-urban and rural areas with the means of providing specialised healthcare to patients and to facilitate the delivery of drugs that would be hard to obtain in rural areas. The express delivery of medicines to patients or hospitals during an emergency can suppress the criticality during a life-threatening disease by providing urgent medical support. Medical equipment and supplies comprise of the list of items that can be delivered urgently to areas where ground or traditional air transport is difficult owing to bad infrastructure during emergencies.
AEPRS facilitates the concept of home-based care as opposed to a hospital-based setting as medication and supplies are delivered quickly to patients. Blood tests taken at a patients’ home can be sent immediately using a drone to be tested. Medications, antibiotics, blood samples and organs required for the patient may be delivered to the hospital or home by AEPRS.
Literature review
Blockchain
Currently, most of the exchanges of confidential information are handled by third party allegedly trusted sources. However, an increasing number of cases regarding stolen identities, credit card frauds and other crimes that put our private information at risk are being reported. These systems also have a problem of secure accessibility. The technology of blockchain puts the power back into the hands of users by providing a decentralised network of distributed ledgers [1]. The power of distributed computing ensures that the failure of one system does not affect the entire mechanism, thus increasing the reliability of the system as shown in Fig. 1 [2].
Fig. 1.

Proposed blockchain versus traditional centralised banks
Every block has a unique cryptographic signature and a timestamp. This makes every transaction immutable and transparent thereby reducing fraud. Furthermore, members in the blockchain can only view those records which are relevant to them. When a transactions block is validated and confirmed, it is chained to the last existing block as shown in Fig. 2, giving it the name blockchain [3]. Tampering with the contents is deterred as any change to the cryptographic hash would immediately be discovered.
Fig. 2.

Blockchain—an overview
The benefits of Blockchain technology are [4]:
No one can tamper with the data because there are multiple copies of data.
The security provided by blockchain is of the highest degree as even if a single system is compromised, it will not affect the other computers in the system.
Each transaction is digitally signed for authenticity by using a private key.
Brain related concepts
Cerebrovascular diseases or strokes are mainly due to the lack of blood flow which is usually caused by the formation of a blood clot in the brain or leakage of blood caused by the bursting of an artery. The lack of blood flow is called Ischemia and causes the death of brain tissue, thus resulting in lasting brain damage or death. According to WHO estimates, 15 million individuals worldwide who suffer from stroke every year. The mortality rate is of 5 million, while 5 million suffer from a permanent disability [5]. The reason a large portion of the population suffers from stroke can be attributed to lack of awareness and delay in the detection of the blockage. This delay causes the disease to progress to an irreversible stage thus making it one of the second most leading causes of death worldwide. Ischemic strokes account for 80% of the strokes worldwide (Fig. 3) [6].
Fig. 3.

Basic brain structure [7]
The cerebrum and the cerebellum are symmetric in a normal brain. The septum pellucidum is used to detect the midline. The shift in the midline is an important parameter that is used by clinicians to assess the compression occurring in the brain due to various diseases of the brain. One of the main indications of abnormality is asymmetry.
Classifiers
KNN
K-nearest neighbors is one of the most basic classifiers. Any of the distance measures can be used for the KNN classifier. However, the Euclidean distance measure has been used for AEPRS. Using the distance measure, the k nearest neighbors are calculated and the vector is assigned to the cluster having the most number of vectors from the K nearest neighbors, based on the training vectors. For example, as shown in Fig. 4, it is clear that based on the distance measure selected that the data point X belongs to the cluster (i)2 as it has the most number of vectors from the nearest neighbours. For optimal values of k, the performance of the supervised nonparametric classifier is good. In the training dataset, the data points are labelled and classified whereas in the testing phase, unlabeled data is classified, based on the results from the training phase.
Fig. 4.

Example of a k-NN classifier
SVM
Support vector machines developed in 1982 by Vapnick is a supervised classifier. SVMs work on the principle of minimization of risk from statistical learning theory. The main goal is to maximize the difference between the classes and minimize the cost. An optimal hyperplane is found between vectors belonging to the class and the vectors not belonging to the class, in order to separate them in a dimensional space that is a level higher than the current dimension space. For example, in Fig. 5, the selected hyperplane maximizes the distance to the nearest data point of both the clusters [8].
Fig. 5.

Selecting a hyperplane for splitting in SVM
ANN
It consists of a network of processing elements organized into layers. It is a parallel distributed processor and processes new information based on experiential data. A single neuron in a neural network is called a perceptron. It takes several binary inputs (x1, x2, … xn) and produces one binary output as shown in Fig. 6.
Fig. 6.

Perceptron neuron
The output depends on whether the weighted sum is greater than or less than the threshold value t where wi is the weight of the ith input.
Using a combination of weights, the perceptron network can make complex decisions as shown in Fig. 7.
Fig. 7.

Perceptron network
The first layer is responsible for making simple decisions. As we go deeper into the layers, each layer makes decisions based on the outputs of the previous layers, thus making more complex and abstract decisions each time, finally culminating in a complex decision-making model [9].
Decision tree
A decision tree represents the classification of the data based on the attribute selection at each internal node of the tree where the node represents the test and the outgoing branch represents the results. The leaf nodes represent the classes. The decision tree classifier requires computation to determine which attribute to test and the level of accuracy. The starting point is the root node and based on the attribute tests the leaf node is reached thus classifying the data point to a particular class as illustrated in Fig. 8 [10].
Fig. 8.

Example of decision tree classifier
Quantitative analysis
Different metrics can be used for the quantitative analysis of the results which are obtained by the classifier. For understanding these metrics, it is required to understand a few concepts related to them. To understand these metrics, knowledge of a few related concepts is essential.
Let us take an example of a fruit being classified as a banana or not.
TP stands for true positive and in accordance with the above example, it would mean that all the bananas are actually classified as bananas.
TN stands for true negative which means that the number of fruits that are not bananas, are actually classified as fruits that are not bananas.
FP stands for false positive which would mean the number of fruits that are not bananas but are classified as bananas.
FN stands for false negative which would mean the number of bananas classified as fruits that are not bananas.
Some of the more popular metrics used are:
- Sensitivity A measure of how many positives are identified as positives or the true positive rate which is obtained by the formula given below.
- Specificity A measure of the true negatives identified correctly.
- Accuracy A measure of the positives identified as positives and negatives identified as negatives.
- Precision The values of positive prediction.
Segmentation
The steps followed for segmentation are:
Selection of k clusters and their respective centroids represented by
Using the centroids to segregate the data into different clusters. Each data point is segregated into a cluster based on the least distance to a cluster. Taking Euclidean distance as the distance parameter, the distance is where is the input data set.
-
Computing the matrix based on the cluster assignment:
- Based on the newly assigned members, the value of the centroid is recalculated using the formula:
- If the assignment of the cluster centroid doesn’t change from the previous assignment then stop the process otherwise keep on iterating till you get a cluster assignment that is the same as the previous assignment.
The sum of squares based objective function is optimised by the k-means clustering.
System description
The architecture and the use case diagram for AEPRS is illustrated in Figs. 9 and 10 respectively.
Fig. 9.

System architecture
Fig. 10.

Use case diagram
Blockchain for medical record
One of the distinguishing features of AEPRS is the usage of a private blockchain for patient data. In this blockchain, the interests of both the patients and the doctors are protected. Doctors may face problems because patients do not declare their medical history that requires doctors to take precautions (like TB, AIDS, etc.) and doctors could succumb to these diseases themselves. Availability of the patients’ complete medical history also enables doctors to take better medical decisions for the patients’ wellbeing. At the same time, only the doctors that the patients are associating with have the right to view the patients’ records. If the patients decide to move to a different doctor, the previous doctor will not have access to any of the records thus providing security for the patient’s confidential information (Fig. 11).
Fig. 11.

Structure of blockchain
The benefits of blockchain in AEPRS as shown in Fig. 12 are:
Patients can choose who has access to their confidential information.
Ease of use in updating and storing data.
Analysis and prediction of trends and medical threats are simplified due to storage of de-identified patient information.
Patients can join a network without relying on third-party individuals or paying a price premium for privacy and security.
Multiple healthcare entities can view and manage the patient if given access.
Patients are assured about their privacy and can control the records that are being passed on from one doctor or hospital to another.
Doctors can take the right decisions based on the patient’s history and the patients do not have to worry about storing each and every prescription or test reports received.
Fig. 12.

Blockchain to protect patient privacy
Drone for medical delivery
The current use cases where drones are primarily used includes the agricultural sector where drones are being used for planting of seeds, removal of weeds and monitoring the growth and quality of crops using AI [11]. Drones are also being used to monitor, maintain and control nutrient level, pesticide level and moisture level [12] in the soil. Drones are also gaining popularity in the entertainment industry for high-definition video capturing. Drone animation is becoming popular and commercially profitable. Drones are also being used for video surveillance in crowded places [13]. Drones can also be used in areas that are difficult for the humans to access and may help in disaster recovery. AEPRS uses drones in the healthcare sector. The quick delivery of medical supplies to the patient or hospitals is of utmost importance as it will ensure urgent medical support especially in case of a medical emergency. Medical supplies can be delivered quickly to remote areas where conventional modes of transportation are difficult owing to poor infrastructure. Medications, antibiotics, blood samples etc. required by the patient or partner hospitals could also be delivered to houses or hospitals by using drones [14]. Many organizations working in the healthcare sector are deploying innovative technologies to solve some of the problems in the healthcare industry today. It is highly likely that in the foreseeable future, drones and robots with the help of artificial intelligence will be trained to perform many tasks in healthcare that are presently performed by humans. This will lead to a reduction in variability, cost and error. The drone also has the power to detect objects using a deep neural network, thus making the drone safer and more accurate and greatly reducing failures. The complete flow of events in AEPRS related to the drone based delivery is shown in Fig. 13.
Fig. 13.

Overview of the delivery by the drone
Disease detection chatbot
Detection of the disease based on the symptoms provided by the patient and the follow-up questions asked by the chatbot are passed to the administrator who can approve or delete the request to supply the patient with the required medication. For the symptomatic analysis and eventual diagnostic results, AEPRS uses the Infermedica API which deals with information in JSON format. As it is stateless and doesn’t store any of the patient’s confidential data, the complete previous information has to be provided when making a request.
The response can be of two types. One response is when the diagnosis hasn’t been made yet in which case, the API call to diagnose will return a follow-up question to ask the user. The second is when the diagnosis is finally made and the possible list of symptoms is returned. The chatbot is redefined to use NLP processing techniques.
The complete overview of the working of the chatbot is given in detail in Fig. 16.
Fig. 16.

Face recognition flow
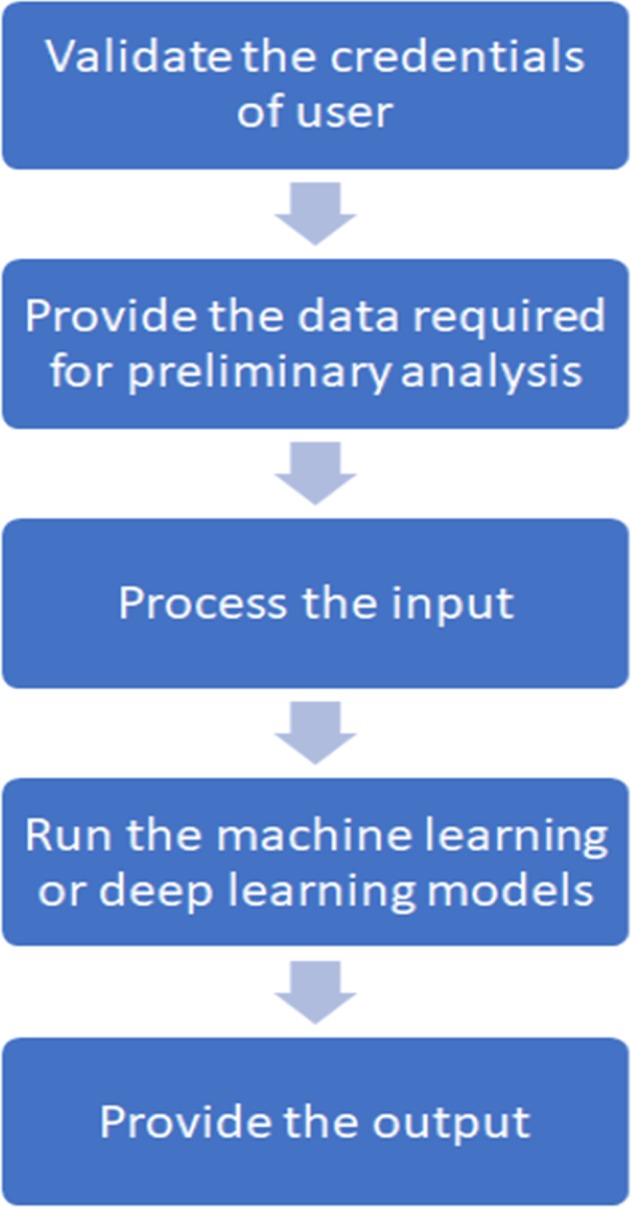
As shown in the Fig. 14, registration is mandatory. The user has to be an individual user to be able to harness the functionality of the healthbot. The first statement just activates the functionality of the bot for the case that a person was only testing the bot and didn’t want to actually start a diagnosis. The next two entries are of the sex and age of the person after which the patient enters the symptoms he/she is suffering from and the bot responds with the follow-up questions to provide a diagnosis.
Fig. 14.

Overview of the working of the chatbot
Stroke detection
This module focuses on providing low cost diagnosis of diseases that require medical expertise in semi-urban or rural areas. AEPRS focuses on the delivery of better healthcare facilities to users irrespective of their living conditions. Keeping in mind the problems faced by the users and their needs, the aim of AEPRS is to reduce the mortality rate by providing medical attention where the presence of a specialist is not possible. The first model under this umbrella consists of stroke detection using CT scans. The de-identified data that we have used for training and testing the model has been acquired from the radiology department of Holy Spirit Hospital, Mumbai.
A stroke can be classified as the difference between two halves of the brain as the human brain is, for the most part bilaterally symmetric. Hence the difference in the distribution of texture and density of tissue clearly outlines the stroke region. Gray Level Covariance matrix (GLCM) is the feature extraction algorithm used [15–17]. Based on the received values of the right and left side features of the brain, a binary classifier is trained to detect ischemic strokes. The pre-processing for early detection of the infarct signs early involves the removal the local noise but keeping the edges preserved.
The detailed description of the steps involved are mentioned in the below subsections:
Pre-processing
The requirement is to strip off the highly attenuated skull while keeping the cranial content. The main preprocessing is done with global thresholding. While it is a seemingly unsophisticated algorithm, due to the anatomical features of the brain, the algorithm proves to be accurate. In the CT scan, the skull is the only highly dense bony region while the largest dense connected region is the brain. The skull has to be removed because it will cause interference in the actual detection of the stroke. The skull is stripped off using global thresholding after which noise reduction is done using a 3 × 3 kernel and median filtering. Median filter has the feature of removing outliers while retaining the image sharpness. Noise reduction helps to increase the contrast between the area where the stroke has occurred and the rest of the brain. The reason why the comparison between the left and right half of the brain is done is because the brain density and the shape vary from person to person. Hence, comparison with a healthy brain might not give very accurate results.
Segmentation
The algorithm chosen for segmentation is k-means clustering algorithm because of the structure of the brain which makes it efficient [18, 19].
Midline tracing
The detection of abnormality of the brain hinges on the feature difference between the right and left side of the brain. In AEPRS, manual segmentation by the community hospital is performed.
Texture features from GLCM
A repeating pattern is called a texture. Of all the statistical methods, the one used in AEPRS for the analysis of texture is GLCM features. The statistics are measured pairwise and the co-occurrence matrices are calculated in this method by extracting second order statistical texture features. For a co-occurrence matrix , and are the grey values at a distance and angle . is the size of the matrix, and are the mean of and respectively and and are the respective standard deviations [20]. The features that we are going to extract are:
It measures homogeneity of an image. Homogenous images contain very few gray levels hence the angular second moment for such images will be high.
Contrast measures the local variations.
IDM (inverse difference moment) measures the homogeneity of an image, with higher values representing homogenous images.
Entropy measures the complexity of an image.
Identifies linear structure of images.
The identification of elements that differ from average value.
where is the ath entry of the marginal probability matrix achieved by summation of the rows of and by summing the columns. Difference entropy is an indicator of the similarity of the images. A higher value indicates more similar images.
Inertia indicates the gray level distribution in an image.
Cluster shade indicates the symmetric nature of images. When it is low images are symmetric.
Cluster prominence is also indicates the symmetricity of images. When it is high, images are asymmetric.
Energy illustrates the uniformity.
The proximity to the GLCM diagonal of the elements in the GLCM is measured using homogeneity. For heterogeneous images, the homogeneity is even while for homogenous images, the values of homogeneity is a combination of low and high.
The evenness is measured between two groups using dissimilarity.
The difference in variance is the summation of the difference between a particular central pixel and its neighbors.
Classifier
We used a number of classifiers and compared the results between them. Normal brain and abnormal brain (brain affected by Ischemic stroke are the two different classes that we have in AEPRS. The images represented by a vector are divided into normal and abnormal. The classifiers that we have chosen are: KNN, SVM, ANN, Decision tree.
Validation
The results are validated on the basis of three parameters of sensitivity, specificity and accuracy.
The results are given in Table 1.
Table 1.
Comparison of different classifiers
| Classifiers | Sensitivity (%) | Specificity (%) | Accuracy (%) |
|---|---|---|---|
| Decision tree | 92 | 90 | 93 |
| ANN | 97 | 89 | 97 |
| K-NN | 95 | 99 | 96 |
| SVM | 97 | 100 | 97 |
Table 2 shows the output for a normal brain sample with no ischemic stroke. Similarly, for all the sample images of normal and abnormal brains, the values for all these features are calculated. The values are then used as a labelled training data, which can be used to train the model to classify normal and abnormal brain based on the presence of stroke. A sample output of a brain with ischemic stroke can be seen in Table 3.
Table 2.
Sample output for a normal brain
| OUT LEFT 1 | OUT LEFT 2 | OUT RIGHT 1 | OUT RIGHT 2 | |
|---|---|---|---|---|
| Entropy | − 13,071 | − 13,071 | − 591,210 | − 591,210 |
| Solidity | 1 | 1 | 1 | 1 |
| Autocorrelation | 24 | 24 | 22 | 22 |
| Cluster prominence | 1071 | 1058 | 1003 | 989 |
| Cluster shade | − 2 | − 3 | 7 | 6 |
| Contrast | 1 | 1 | 1 | 1 |
| Correlation | 1 | 1 | 1 | 1 |
| Difference entropy | 1 | 1 | 1 | 1 |
| Difference variance | 1 | 1 | 1 | 1 |
| Dissimilarity | 0 | 1 | 0 | 1 |
| Energy | 0 | 0 | 0 | 0 |
| Entropy | 3 | 3 | 3 | 3 |
| Homogeneity | 1 | 1 | 1 | 1 |
| Information measure of correlation 1 | 0 | 0 | 0 | 0 |
| Information measure of correlation 2 | 1 | 1 | 1 | 1 |
| Inverse difference | 1 | 1 | 1 | 1 |
| Inverse difference moment normalized | 1 | 1 | 1 | 1 |
| Inverse difference normalized | 1 | 1 | 1 | 1 |
| Maximum probability | 0 | 0 | 0 | 0 |
| Sum average | 8 | 8 | 8 | 8 |
| Sum entropy | 2 | 2 | 2 | 2 |
| Sum of squares variance | 7 | 7 | 7 | 7 |
| Sum variance | 28 | 27 | 27 | 27 |
Table 3.
Sample output for a brain with Ischemic stroke
| OUT LEFT 1 | OUT LEFT 2 | OUT RIGHT 1 | OUT RIGHT 2 | |
|---|---|---|---|---|
| Entropy | − 10,149 | − 10,149 | − 600,720 | − 600,720 |
| Solidity | 1 | 1 | 0 | 0 |
| Autocorrelation | 21 | 21 | 13 | 13 |
| Cluster prominence | 762 | 756 | 217 | 214 |
| Cluster shade | − 8 | − 8 | − 8 | − 9 |
| Contrast | 0 | 1 | 0 | 0 |
| Correlation | 1 | 1 | 1 | 1 |
| Difference entropy | 1 | 1 | 1 | 1 |
| Difference variance | 0 | 0 | 0 | 0 |
| Dissimilarity | 0 | 0 | 0 | 0 |
| Energy | 0 | 0 | 0 | 0 |
| Entropy | 2 | 3 | 2 | 2 |
| Homogeneity | 1 | 1 | 1 | 1 |
| Information measure of correlation 1 | − 1 | − 1 | − 1 | − 1 |
| Information measure of correlation 2 | 1 | 1 | 1 | 1 |
| Inverse difference | 1 | 1 | 1 | 1 |
| Inverse difference moment normalized | 1 | 1 | 1 | 1 |
| Inverse difference normalized | 1 | 1 | 1 | 1 |
| Maximum probability | 0 | 0 | 0 | 0 |
| Sum average | 8 | 8 | 6 | 6 |
| Sum entropy | 2 | 2 | 2 | 2 |
| Sum of squares variance | 5 | 5 | 3 | 3 |
| Sum variance | 21 | 21 | 13 | 13 |
The working of the Stroke detection module as a part of a wider umbrella of diseases that require specialised care follows the general flow as shown in Fig. 15.
Fig. 15.
Flow diagram of the detection of diseases
The steps that take place in AEPRS are described below:
Only community hospitals can access the stroke detection feature.
When the user selects the option of detecting a stroke, the file navigator will open and the user can select the file to be uploaded.
The pre-processing of the image is done and the image is ready for the user to trace the midline.
The processing of the image is done with all the steps mentioned above.
The final result is presented to the user.
With the addition of newer modules, the user will be able to select from an umbrella of different options, based on the provisions at that particular hospital.
Face recognition using edge AI
To implement face recognition on the edge, AEPRS uses the Movidius Neural Compute Stick (NCS), which provides accelerated inferencing. NCS enables swift training, validation and deployment of deep neural networks even on devices with low computational power like Atom, Celeron or Raspberry Pi. NCS contains Vision Processing Units and voltage regulators for power delivery.
Face recognition is the task of recognizing a person from the facial image or from a video stream. In the last decade or so, face recognition algorithms have gained immense popularity. Face recognition algorithms have been there for a long time and date backs to 1980s. However, it is only recently that they have become extremely popular because of their several use cases.
Few of the face recognition algorithms include [21]:
Principal component algorithm It is derived from the Karhunen–Loeve’s transformation. Suppose, for each of the faces in the training set of images, there is an m-dimensional vector representation, PCA finds a subspace of n-dimensions whose basis corresponds to the highest variance direction. The subspace found by the PCA is of a lower dimensional, n < m [22].
Independent component analysis It minimizes the second and higher order dependencies in the data. ICA finds the basis vector along which the input image data are statistically independent [23].
Linear discriminant analysis LDA is one of the most popular face recognition algorithms. The basic principle followed by LDA in brief, is to find the vectors that can best separate the different classes [24].
Evolutionary pursuit EP is an adaptive approach based on the eigen-space to search for the most optimum set of projection axes, in order to maximize the function known as the fitness function, along with measuring the classification accuracy at the same time [25].
Support vector machine Support Vector machine finds an optimal hyperplane that separates the maximum number of points belonging to the same class on the same side of the hyperplane along with keeping the maximum distance from both the classes with the hyperplane. First, the principal component algorithm is used to extract the features from the facial images and then, SVM is used [26].
Apart from these algorithms, there are several other face recognition algorithms. Some of these algorithms are: Eigenfaces, Local Binary Patterns Histograms, Fisherfaces, Scale Invariant Feature Transform, Speed Up Robust Features (SURF), etc. In the last decade, there was an advent of many convolutional neural network (CNN) topology architectures that are being used for face recognition. Few of the CNN models for this purpose includes Pose-Aware CNN Models (PAMs) for Face Recognition published in a paper from CVPR 2016 conference, ResNet-101 deep neural network model, etc. [27–30].
Most of the face recognition algorithms use models that needs to be trained with the images of all the people who need to be recognized. This results in a situation such that for the addition of every new person for whom the face recognition algorithm needs to work, the model will need to be retrained. This is not feasible for our use case as training of the model requires a lot of time and resources. In addition, the algorithm will not be able to work for use cases where the model needs to be trained to recognize newly added customers or users on the fly. This is where the face recognition algorithm that we propose to use will be highly helpful. For our application, we need to send the picture of the patient or authenticated user to the system whenever there is a new order to be delivered. Thus, it is inefficient and not feasible to use traditional algorithms and keep training the model again and again every time a new user is added. The deep learning architecture for our use case application requires training of the model once and while running this model, a vector embedding is returned for of the face. During the initial training, the model is trained with triplet loss for each of the different faces or classes in the training dataset. For every new user added, their face will be added and sent to the face recognition module. Rather than training the entire model again, only the vector embedding of the newly added face is calculated and saved. All these vector embeddings can be saved as numpy arrays and now while the system is performing inference to recognize the face of the customer, all it needs to do is to compare the vector embeddings of the saved faces of the authenticated users with the target images processed from the video stream at the time of the delivery. This is done to ensure that the delivery is made to the authenticated users and to avoid misuse. The similarities and dissimilarities is captured by comparing the numpy arrays of the vector embeddings given by the model which results in clustering of the faces. Now, any classifier- Support Vector Machine for an example can be used to differentiate and classify the obtained vector embeddings from the faces, which by classifying results in recognition of the face. Thus, every time a new customer’s face is added, rather than training the entire model, only the new face needs to be added as a class and then just the final classifier (SVM) needs to be trained, which takes negligible time.
The flow diagram for face detection at the edge is shown in Fig. 16.
Conclusion
Presently the drone technology is scarcely utilized as an aid in the healthcare industry of India. AEPRS aims to introduce an inexpensive and highly promising technological answer to the field of paramedical emergency response. Airborne distribution not only reduces the response time in emergency situations which is usually caused by traffic, transportation conditions and victim location but it also aims to revolutionize healthcare services that can be offered such as pharmacy to door delivery of prescription medications along with offering patient confidentiality as well as secure transactions between the patient and the clinical entity. AEPRS also provides on-demand medical support for detection of diseases from identifying the symptoms from the conversation with the chatbot and also a tool for community hospitals to detect abnormalities, which will enable early detection in absence of specialised medical professions. AEPRS also solves the issue of keeping the medical record digitally recorded in a safe manner using blockchain.
When new technologies or solutions are developed, generally they target urban areas that can provide them with maximum revenue. We wanted to ensure that while we cater to people with access to the internet, we also make provisions to ensure the safety and wellbeing of people in semi-urban and rural areas. Which is why the community hospital module is such an important part of AEPRS. Not only is it scalable, but it also gives utmost priority to take care of the privacy of the patients and at the same time it leverages the newest technology to provide specialised care in the absence of specialized doctors and access to medicines that may not have been available before.
Future work
With the rapid growth in the field of machine learning, IoT and the advancement of technology in the field of healthcare, AEPRS has numerous functionalities yet to be explored. The future possibilities of AEPRS include the extension of modules in the community hospital to include different diseases that can be detected using the intelligent algorithms running on the cloud. Another future implementation can be to include automatic segmentation of the brain image as opposed to the manual segmentation currently used.
Footnotes
Publisher's Note
Springer Nature remains neutral with regard to jurisdictional claims in published maps and institutional affiliations.
Contributor Information
Mashrin Srivastava, Email: mashrin.msrivastava2014@vit.ac.in.
Saumya Suvarna, Email: suvarna.saumyacjyoti2014@vit.ac.in.
Apoorva Srivastava, Email: apoorva.srivastava2014@vit.ac.in.
S. Bharathiraja, Email: bharathiraja.s@vit.ac.in
References
- 1.Zyskind G, Nathan O. Decentralizing privacy: using blockchain to protect personal data. In: Alex ‘Sandy’ Pentland, security and privacy workshops (SPW), IEEE; 2015.
- 2.Cachin C. Architecture of the hyperledger blockchain fabric. Zurich: IBM Research; 2016. [Google Scholar]
- 3.Pilkington M. Blockchain technology: principles and applications. In: Research handbook on digital transformations. Social Science Research Network; 2016.
- 4.Thakur S, Kulkarni V. Blockchain and its applications: a detailed survey. Int J Comput Appl. 2017;180(3):29–35. [Google Scholar]
- 5.WHO, World Health Report . World health report 2002: reducing risks, promoting healthy life. Geneva: WHO; 2002. [DOI] [PubMed] [Google Scholar]
- 6.WHO . Global burden of disease. Geneva: WHO; 2000. [Google Scholar]
- 7.Chaurasia BD. Human anatomy; 2013.
- 8.Parker JR. Algorithms for image processing and computer vision. 2. Hoboken: Wiley Publishing; 2010. [Google Scholar]
- 9.Egmont-Petersen M, de Ridder D, Handels H. Image processing with neural networks—a review. Pattern Recogn. 2002;35(10):2279–2301. doi: 10.1016/S0031-3203(01)00178-9. [DOI] [Google Scholar]
- 10.Bezdek JC, Keller J, Krisnapuram R, Pal N. Fuzzy models and algorithms for pattern recognition and image processing. New York: Springer; 1999. [Google Scholar]
- 11.Ding G, Wu Q, Zhang L, Lin Y, Tsiftsis TA, Yao Y-D. An amateur drone surveillance system based on the cognitive. IEEE Commun Mag. 2018;56:29–35. doi: 10.1109/MCOM.2017.1700452. [DOI] [Google Scholar]
- 12.Kaleem Z, Rehmani MH, Ahmed E, Jamalipour A, Rodrigues JJ, Moustafa H, Guibene W. Amateur drone surveillance: applications, architectures, enabling technologies, and public safety issues. IEEE Commun Mag. 2018;56(1):14–15. doi: 10.1109/MCOM.2018.8255731. [DOI] [Google Scholar]
- 13.Garrett B, Anderson K. Drone methodologies: taking flight in human and physical geography. Trans Inst Br. 2018 doi: 10.1111/tran.12232. [DOI] [Google Scholar]
- 14.Jalali A. Broadband access to mobile platforms using drone/UAV background (Patent); 2018.
- 15.Ranjith Kumar V, Nathiya R. Performance analysis of different feature extraction algorithms. Int J Sci Prog Res (IJSPR) 2015;11:1. [Google Scholar]
- 16.Nanni L, Brahnam S, Ghidoni S, Menegatti E, Barrier T. Different approaches for extracting information from the co-occurrence matrix. PLoS ONE. 2013;8(12):e83554. doi: 10.1371/journal.pone.0083554. [DOI] [PMC free article] [PubMed] [Google Scholar]
- 17.Hong H, Zheng L, Pan S. Fast Computational technique for gray-level co-occurrence matrix based on graphics process unit in biomedical engineering applications. J Med Imaging Health Inform. 2018;8(2):309–312. doi: 10.1166/jmihi.2018.2316. [DOI] [Google Scholar]
- 18.Usinskas A, Dobrovolskis RA, Tomandl BF. Ischemic stroke segmentation on CT images using joint features. Informatica. 2004;15(2):283–290. [Google Scholar]
- 19.Fauzi MFA, Komiya R, Haw S-C. Unsupervised abnormalities extraction and brain segmentation. Int Conf Intell Syst Knowl Eng. 2008;1:1185–1190. [Google Scholar]
- 20.Haralick RM, Shanmugam K, Dinstein I. Textural features for image classification. IEEE Trans Syst Man Cybern. 1973;36:610–621. doi: 10.1109/TSMC.1973.4309314. [DOI] [Google Scholar]
- 21.Bhatia K, Lilhore UK, Agrawal N. Review of different face detection and recognition methods. Int J Sci Res Comput Sci Eng Inf Technol. 2(5); 2017.
- 22.Moon H, Phillips PJ. Computational and performance aspects of PCA-based face recognition algorithms. Perception. 2001;30:303–321. doi: 10.1068/p2896. [DOI] [PubMed] [Google Scholar]
- 23.Bartlett MS, Movellan JR, Sejnowski TJ. Face recognition by independent component analysis. IEEE Trans Neural Netw. 2002;13(6):1450–1464. doi: 10.1109/TNN.2002.804287. [DOI] [PMC free article] [PubMed] [Google Scholar]
- 24.Lu J, Plataniotis KN, Venetsanopoulos AN. Face recognition using LDA-based algorithms. IEEE Trans Neural Netw. 2003;14(1):195–200. doi: 10.1109/TNN.2002.806647. [DOI] [PubMed] [Google Scholar]
- 25.Liu C, Wechsler H. Evolutionary pursuit and its application to face recognition. IEEE Trans Pattern Anal Mach Intell. 2000;22(6):570–582. doi: 10.1109/34.862196. [DOI] [Google Scholar]
- 26.Heisele B, Ho P, Poggio T. Face recognition with support vector machines: global versus component-based approach. In: Proceedings of the eighth IEEE international conference on computer vision, ICCV 2001, vol 2, Vancouver, pp. 688–94; 2001.
- 27.Fukushima K. Neocognitron: a self-organizing neural network model for a mechanism of visual pattern recognition. Biol Cybern. 1980;36:193–202. doi: 10.1007/BF00344251. [DOI] [PubMed] [Google Scholar]
- 28.He W, Dong Y. Adaptive fuzzy neural network control for a constrained robot using impedance learning. IEEE Trans Neural Netw Learn Syst. 2018;29(4):1174–1186. doi: 10.1109/TNNLS.2017.2665581. [DOI] [PubMed] [Google Scholar]
- 29.Krogh A, Vedelsby J. Neural network ensembles, cross validation, and active learning. In: NIPS ‘94 proceedings of the 7th international conference on neural information processing systems, MIT Press, Cambridge, pp. 231–8; 1994.
- 30.Plaza A, Benediktsson JA, Boardman JW. Recent advances in techniques for hyperspectral image processing. Remote Sens Environ. 2009;113(1):S110–S122. doi: 10.1016/j.rse.2007.07.028. [DOI] [Google Scholar]