Abstract
The purpose of this study was to determine the influence of ultrasound intensity, pulse and temperature on extraction of caffeine, from Arabica coffee beans using water as solvent, and ultrasound frequency of 24 kHz. A central composite design was used, using ultrasound intensity (31.5–105 W cm−2), pulse (0.30–1) and extraction temperature of the extraction (30–60 °C) as independent factor. The caffeine recovery and caffeine diffusion coefficient were response variables. The ultrasound intensity and extraction temperature significantly influenced the caffeine recovery rate and the diffusion coefficient of caffeine. Activation energy of 48.95 kJ mol−1 for the caffeine diffusion coefficient in ultrasound assisted extraction was observed. The best results were obtained at 68.25–105 W cm−2 ultrasound intensity and 60 °C temperature, corresponding to caffeine recovery of 58.4–69.4% and diffusion coefficient of 8.92–10.57 × 10⁻¹¹ m2 s−1. The pulse effect was not significant in the range of the studied variables.
Keywords: Ultrasound, Caffeine extraction, Diffusivity, Fick’s law
Introduction
The decaffeination process of coffee beans traditionally uses extraction technology based on dichloromethane as solvent, associated with the use of water vapor to swell the grains and to eliminate the solvent (Farah 2012). Another extraction technology called “Secoffex” process uses hot water at temperatures between 70 and 90 °C, containing soluble solids in equilibrium with the soluble solids inside the coffee bean, which creates a favorable medium for only the diffusion of caffeine, preserving better soluble solids composition in the decaffeinated coffee bean (Chang and Ho 2014; Heilmann 2001). However, the use of high temperature modifies the polymeric matrix of coffee beans, which is mostly composed of polysaccharides (Farah 2012), consequently modifying the sensory attributes of decaffeinated coffee. Therefore, in order to improve the process using the advantages offered by the high intensity ultrasound technology in the extraction processes (Mulet et al. 2002), due to its ability to accelerate the mass transfer process in the cell walls of vegetables (Chemat et al. 2011), may also contribute to improve sensory attributes, once conducted at lower temperatures.
The sonication produces the cavitation phenomenon, which consists of the formation of bubbles in the liquid that collapse explosively, generating high localized pressure and elevation of the local temperature (Ghafoor et al. 2014). The mass transfer phenomenon can be enhanced by the asymmetric implosions of the cavitation bubbles in the vicinities of the solid–liquid interface generating micro-jets (Cárcel et al. 2012; Chemat et al. 2017). This cavitation phenomenon occurs in ultrasound frequencies in the range 20–1000 kHz (Cheeke 2012). Nevertheless, high intensity ultrasound (10–1000 W m−2) is applied at low frequencies (20–300 kHz) to obtain high acoustic power density (Mulet et al. 2002; Picó 2013).
Ultrasound assisted extraction (UAE) was investigated in the extraction of oils, proteins and bioactive compounds from plant and animal materials, resulting in higher yield of the extracted components, a higher extraction rate and a reduction in extraction time (Chemat et al. 2017; Picó 2013). However, to best of our knowledge no research publications were found on the caffeine extraction from coffee beans using ultrasound. The extraction of caffeine was investigated using ultrasound from other materials, such as from cacao seeds and chocolate (Peralta-Jiménez and Cañizares-Macías 2013), from green tea leaves (Jun 2009; Sereshti et al. 2013). Wang et al. (2011) applied ultrasound in the preparation of the coffee beverage from roasted and ground coffee, which results indicated strong influence of the extraction temperature (5–95 °C) and higher caffeine concentration at 28 kHz than at 40 kHz operating frequencies, under the same extraction conditions.
Thus, there is a need for scientific research on the ultrasound assisted of the decaffeination of green coffee beans using water as solvent in order to verify its influence on the process. The present study aimed to evaluate the effect of ultrasound intensity and pulse and of the extraction temperature on the transfer rate of caffeine from the coffee beans to the aqueous extract, on the diffusion coefficient and on the caffeine recovery.
Materials and methods
Materials
The green coffee beans, Arabica variety, 2011/2012 harvest, were supplied by a local producer in the municipality of Bálsamo, state of São Paulo from a regular agricultural production lot, without peel, with 11% moisture (wet basis), and average concentration of caffeine of 0.0119 ± 0.0002 g g−1 (dry basis), providing raw material for all the experiments conducted in the same year of harvesting.
Caffeine > 99% purity (Cat. No. 1.02584.1000) used as standard was purchased from Merck (São Paulo, Brazil) and methanol UV/HPLC (Code 2062) was supplied from Vetec (Rio de Janeiro, Brasil).
Ultrasound assisted extraction of caffeine from coffee beans in water
Before performing the caffeine extraction experiments, the coffee beans were hydrated based on the “Secoffex” procedure described by Heilmann (2001). Firstly, 200 g of coffee beans were placed in 1 l of distilled water, heated at 90 °C for 30 min, cooled and kept at room temperature for 12 h. After that time, the beans were discarded and the liquid aqueous extract was used to humidify 150 g of coffee beans at a temperature of 5 °C for 24 h in order to minimize the extraction of soluble solids and caffeine in the hydration step.
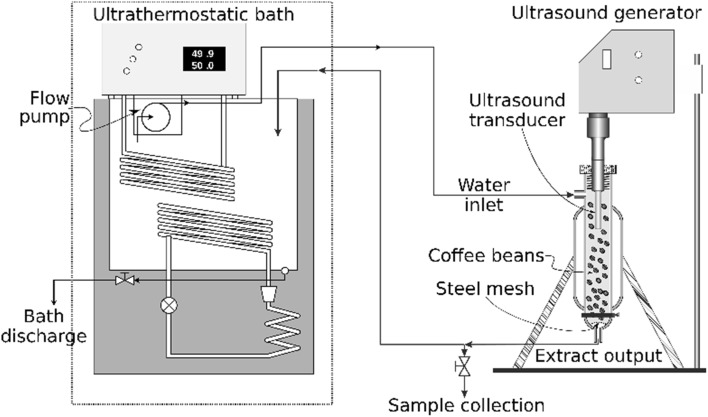
The system shown in Fig. 1 was used for the caffeine extraction process. The ultrasound device used was the UP400S model (400 W, 24 kHz) manufactured by Hielscher Ultrasonics (Teltow, Germany) coupled to a H14 transducer probe (14 mm diameter and 100 mm length) that provides a maximum nominal ultrasound intensity of 105 W cm−2, introduced into an extraction cell of 1 L capacity, loaded with ~ 120 g of green coffee beans for the ultrasound application, equipped with a system of liquid extract circulation through coffee grains (7 L min−1) and a jacket to keep constant temperature. An ultra-thermostatic bath (Nova Etica 521-2D, São Paulo, Brazil), filled with ~ 10 L of distilled water, was used to keep the liquid extract at a constant temperature flowing inside the extraction cell. The ultrasound intensity transmitted by the transducer was stablished by setting the percentage of power control amplitude (30–100%, corresponding to 31.5–105 W m−2 to ultrasound intensity, respectively).
Fig. 1.
Scheme of the system for the ultrasound assisted caffeine water extraction
The caffeine content in the coffee bean and in the liquid extract was determined based on the methodology described by ISO 20481:2008 (International Organization for Standardization 2008). In brief, HPLC analysis was performed at room temperature (25 °C), using C-18 column (Dionex C-18, 4.6 × 250 mm) and water/methanol (76:24, v/v) as the mobile phase in isocratic elution at 1 mL min−1 flow rate and the detector (Jasco UV-975) was set at 449 nm wavelength. For the quantification of caffeine in the extract, 100 mL of sample was placed in the Soxhlet extractor heated at 90 °C for 20 min in the presence of 1 g of magnesium oxide. The filtration and injection steps were the same as described for determining the caffeine in the coffee bean.
The moisture of the coffee beans at all stages was determined using the methodology described by ISO 6673:2003 (International Organization for Standardization 2003), at 105 °C until constant weight.
Experimental design
A central composite design was used with tree factors, five levels each (Table 1) and four repetitions at the central point, for the ultrasonic intensity application (31.5–105 W cm−2) and the pulse of ultrasound (0.3–1), defined as the time in seconds the acoustic irradiation is taking place per one second of device functioning, where 1 would be continuous, and temperature (30–60 °C). The factor levels (−1, 0, +1) were adjusted to the approximated controllable values in the configuration of the ultrasound equipment. A wide range of values was considered both for the intensity and for the ultrasonic pulse, considering the operational characteristics of the equipment. The temperature range was established for the operation above room temperature and lower than temperatures that might cause physical changes in the cellular structure of the coffee bean besides avoiding higher energy consumption. Response variables were the percentage of caffeine recovery and the diffusion coefficient of caffeine in the hydrated coffee beans.
Table 1.
Levels and factors for the central composite design
| Source of variation | Level | ||||
|---|---|---|---|---|---|
| −α | −1 | 0 | +1 | +α | |
| [x1] Intensity (W m−2)* | 31.5 | 47 | 68.25 | 89.5 | 105 |
| [x2] Pulse* | 0.3 | 0.45 | 0.65 | 0.85 | 1 |
| [x3] Temperature (°C) | 30 | 36 | 45 | 54 | 60 |
*The values of the levels at −1, 0 and +1 were adjusted to the approximated controllable values
The obtained results were statistically evaluated by the analysis of variance at 5% significance level and by applying the response surface methodology. In order to obtain the desirability profiles to maximize caffeine recovery and caffeine diffusion coefficient, data were fitted by the least square method using the STATISTICA (v. 10, StatSoft Inc. 2011) software, by assigning predicted values a score ranging from 0 (very undesirable) to 1 (very desirable).
Mathematical diffusion model to determine the diffusion coefficient
The diffusion coefficient of caffeine in coffee bean (D) was calculated from the analytical solution of Fick’s model for the hemisphere, considering the coffee bean having similarity to this geometry, shown in Eq. 1 (Bon et al. 1997; Huamaní-Meléndez and Darros-Barbosa 2018). Bessel roots and Legendre polynomials were numerically obtained.
| 1 |
where is the average dimensionless concentration, is the local mean concentration (kg m−3), c0 is the initial concentration (kg m−3), c∞ is the surface concentration (kg m−3), are the roots of Bessel function of the first kind and order, t is the time (s) and Bnm is expressed as Eq. 2 with u = cos (α).
| 2 |
where and are the Bessel functions of the first kind of and order respectively, is the Legendre polynomial of 2n + 1 order, r is the radial position and R is the characteristic dimension (equivalent hemispherical radius, R = 0.486 ± 0.025 cm) was obtained by equalizing the volume of wet coffee beans (57.30 ± 0.85% wet basis moisture) with the volume of the hemisphere.
For the experimental data, the Eq. 1 was solved using the “Evolutionary” algorithm from Excel software (Microsoft Office Professional Plus 2010), and the roots of the Bessel functions and Legendre polynomial were numerically calculated using the Maple software v. 14.00. The convergence criterion used for the hemisphere model was the tolerance, which is the ratio between the difference of the values of the iteration and the actual value expressed as dimensionless concentrations, , so the number of terms in the series varied between 20 and 200 terms.
Five experimental points were obtained by taking 100 mL of extract samples from three replicates at 0, 10, 25, 40 and 60 min, and the fitting was evaluated using the coefficient of determination, R2.
To further investigate the effect of temperature on the diffusion coefficient of caffeine during sonication, the data were fitted to a linearized Arrhenius type (Eq. 3).
| 3 |
where D is the effective diffusion coefficient, D0 is the initial diffusion coefficient, Ea is the energy of activation for diffusion, Rg is the universal gas constant [8.314 J (mol K)−1] and T is the absolute temperature.
Results and discussion
Table 2 shows the values of the percentage recovery of caffeine and caffeine diffusion coefficient.
Table 2.
Results for the composite central design
| Intensity (W m−2) | Pulse | Temperature (ºC) | Caffeine recovery (%) | Diffusion coefficient (m2 s−1) × 1011 | |
|---|---|---|---|---|---|
| D | R2 | ||||
| 47.00 | 0.45 | 36 | 21.95 | 2.011 | 0.962 |
| 47.00 | 0.45 | 54 | 43.12 | 6.180 | 0.971 |
| 47.00 | 0.85 | 36 | 25.93 | 2.452 | 0.962 |
| 47.00 | 0.85 | 54 | 45.54 | 5.977 | 0.969 |
| 89.50 | 0.45 | 36 | 24.00 | 2.291 | 0.926 |
| 89.50 | 0.45 | 54 | 53.94 | 7.300 | 0.992 |
| 89.50 | 0.85 | 36 | 23.47 | 2.747 | 0.964 |
| 89.50 | 0.85 | 54 | 52.03 | 7.260 | 0.923 |
| 31.50 | 0.65 | 45 | 25.19 | 2.983 | 0.863 |
| 105.00 | 0.65 | 45 | 38.01 | 4.419 | 0.976 |
| 68.25 | 0.30 | 45 | 31.92 | 3.461 | 0.954 |
| 68.25 | 1.00 | 45 | 33.01 | 3.712 | 0.955 |
| 68.25 | 0.65 | 30 | 16.75 | 1.449 | 0.902 |
| 68.25 | 0.65 | 60 | 56.06 | 8.671 | 0.977 |
| 68.25 | 0.65 | 45 | 30.13 | 3.188 | 0.954 |
| 68.25 | 0.65 | 45 | 33.64 | 3.513 | 0.988 |
| 68.25 | 0.65 | 45 | 34.73 | 3.837 | 0.967 |
| 68.25 | 0.65 | 45 | 33.94 | 3.615 | 0.985 |
The validity of fitted regression model equation for the uncoded variables was analyzed by performing ANOVA analysis. The significance of each factor effect was determined by the corresponding Fisher’s statistical test (F-test) at 0.05 level of significance.
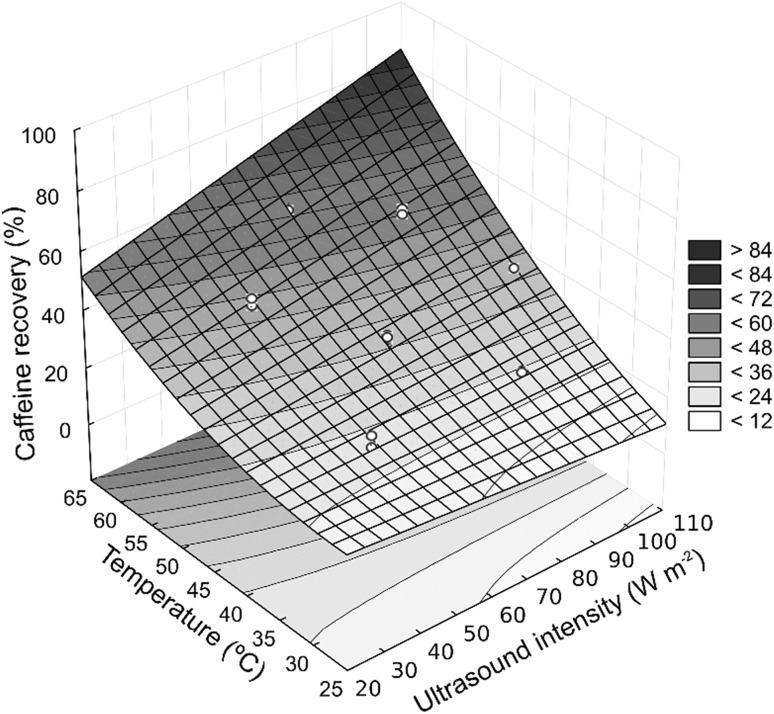
From ANOVA, the linear (P < 0.001) and quadratic (P = 0.033) effects of temperature, the linear effect of ultrasonic intensity (P = 0.002) and interaction between temperature and ultrasonic intensity (P = 0.031) significantly effected the percentage of caffeine recovery, with P = 0.365 for the Lack-of-Fit test, indicating that the model was appropriate. The effect of the pulse (P = 0.535) or its interactions were found to be non-significant in the studied range. Using the second-degree polynomial model reduced only the significant effects (Eq. 4, with R2 = 0.97), and the response surface is shown in Fig. 2. It can be seen that the temperature exerts great influence on caffeine recovery, similar to the ultrasound assisted caffeine extraction from coffee powder during preparation of coffee beverage (Wang et al. 2011). Temperature contributes to the extraction efficiency, because it strongly affects the properties of the solvent (decrease of both viscosity and surface tension, and induces an increase in the vapor pressure). Some authors report a beneficial effect of temperature rise from 20 to 70 °C compared to non-sonicated extractions, justified by an increase in the number of cavitation bubbles, enhancements of solvent diffusivity and increase in the contact area (Chemat et al. 2017; Esclapez et al. 2011; Shirsath et al. 2012). However, the effect of the ultrasound intensity was also significant in the present study. The extraction yield usually increases consistently with the power intensity applied (Esclapez et al. 2011); this was observed by some authors (Ji et al. 2006; Li et al. 2004; Wang et al. 2015; Zou et al. 2010)
| 4 |
Fig. 2.
Influence of ultrasonic intensity and temperature on caffeine recovery in the water extraction process assisted with ultrasound (R2 = 0.97)
The interaction effect of temperature and ultrasonic intensity was significant, which showed a synergistic effect of both. The effect of the ultrasound was especially noticeable at higher temperature, probably due to the most plastic deformability of the coffee bean favored by high temperature, facilitating the transmission of the sonic energy in the hydrated bean. At the lowest temperature the coffee bean structure tended to be more rigid, so the sonic energy may have not effectively transmitted in the solid matrix, resulting in less recovery of caffeine. Similar effects of temperature and ultrasound, on recovery of malic and tartaric acids from grapes using water as solvent were reported (Palma and Barroso 2002).
The pulse effect was found not significant in the investigated range. The influence of the ultrasound pulse in the extraction process was not sufficiently investigated. In some cases, the proper use of the pulse mode of ultrasound can replace continuous irradiation by ultrasound in order to reduce the electrical energy consumption (Esclapez et al. 2011; Hashemi et al. 2015; Sun et al. 2011).
The caffeine diffusion coefficient in coffee beans, showed correlation coefficient in the range of 0.86–0.99 (Table 2). From the experimental data for the caffeine diffusion coefficient, the analysis of variance showed that the temperature (linear and quadratic, P < 0.001) and ultrasound intensity (P = 0.001) significatively influenced the caffeine diffusion coefficient with P = 0.444 indicating that the model is appropriate to explain specify the correlation. The effect of the pulse (P = 0.351) or its interactions were not significant. The model for the uncoded variables reduced only for the significant effects is expressed by Eq. 5 with R2 = 0.98.
| 5 |
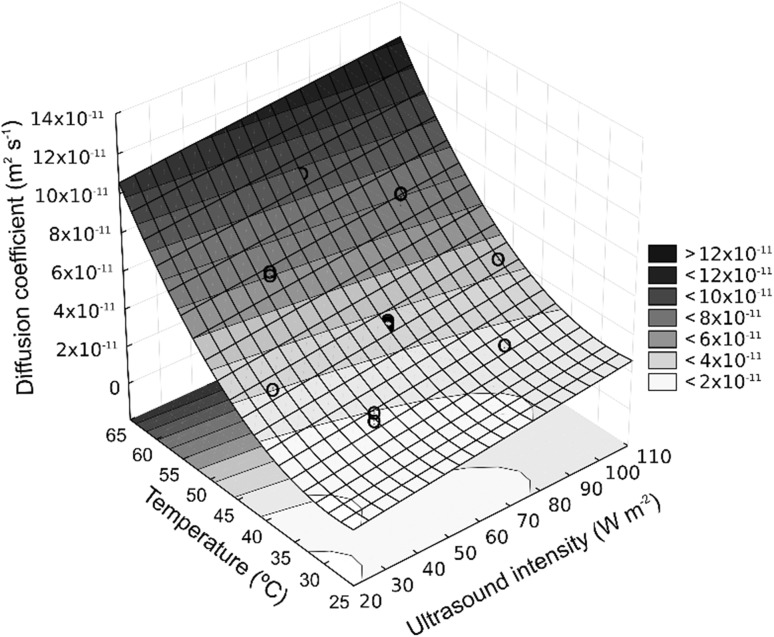
Figure 3 shows the effect of the ultrasound intensity and temperature in the diffusion coefficient without pulse level effect. The ultrasound mechanism may be explained by the implosion of bubbles produced favored by cavitation generating inter-collision turbulence at high speed and disturbing the particles of the microporous matrix and accelerating the diffusion mechanism in the liquid and in the solid phases (Boonkird et al. 2008; Chemat et al. 2008; de Castro and Capote 2007). Moreover, the cavitation at the solid–liquid interface promotes intense movement of the liquid through the cavities, causing clashes by micro-jets, resulting in the collapse and erosion of the particles at the surface. This effect produces the exposure of new surfaces further enhancing the mass transfer rate (Dolatowski and Stasiak 2011; Saleh et al. 2016).
Fig. 3.
Influence of ultrasonic intensity and temperature on the diffusion coefficient in the water extraction process assisted with ultrasound (R2 = 0.98)
The diffusion coefficient of caffeine in the coffee beans was improved as the temperature and ultrasound intensity increased. Similar results were obtained during the extraction of phenolic compounds from grape marc, under sonication from 20 to 50 °C, and acoustic energy density from 6.8 to 47.4 W L−1 by Tao et al. (2014).
Using Eq. 3, the energy of activation obtained was 48.95 kJ mol−1 (R2 = 0.94) for the extraction of caffeine from coffee beans in the water extraction process assisted with ultrasound. For the diffusion of caffeine into the coffee beans in an aqueous extraction process (no ultrasound), Chiang et al. (2018) and Huamaní-Meléndez and Darros-Barbosa (2018) found activation energy values of 57.2 and 59.93 kJ mol−1, respectively. The lowest value of activation energy in the ultrasonic assisted extraction of the present study is due to the synergistic effect between temperature and ultrasound. Spiro and Selwood (1984) obtained an activation energy of 32 kJ mol−1 for the caffeine diffusion coefficient in the aqueous extraction process from coffee powder (not the beans). The high magnitude of the activation energy for the caffeine diffusion in the ultrasound assisted extraction from coffee beans compared to the extraction from coffee powder can be attributed to the particle size and to the cracking due to the roasting and grinding coffee.
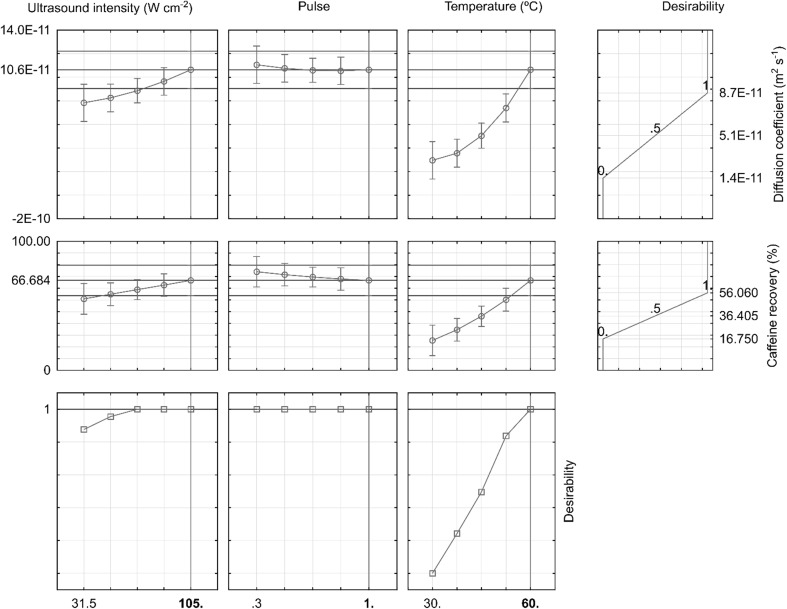
Figure 4 shows the desirability profiles for each process variable and response predicted at the best conditions. Desirability profiling shows the predicted values for both caffeine recovered and diffusion coefficient simultaneously at different combinations of levels of the independent variables (ultrasound intensity, pulse and temperature), below which the response was undesirable. Both caffeine recovery and caffeine diffusion coefficient was the highest at the highest temperature (60 °C) and ultrasound intensity between 68.25–105 W cm−2 range, (58.4–69.4% and 8.92–10.57 × 10⁻¹¹ m2 s−1). The pulse appears to have no significant influence, as has already been shown by the analysis of variance, both for caffeine recovery and for the caffeine diffusion coefficient value. Thus, the model is valid to predict both responses simultaneously within the studied range with 95% confidence level.
Fig. 4.
Profiles for predicted values and desirability profiles for the caffeine ultrasound extraction
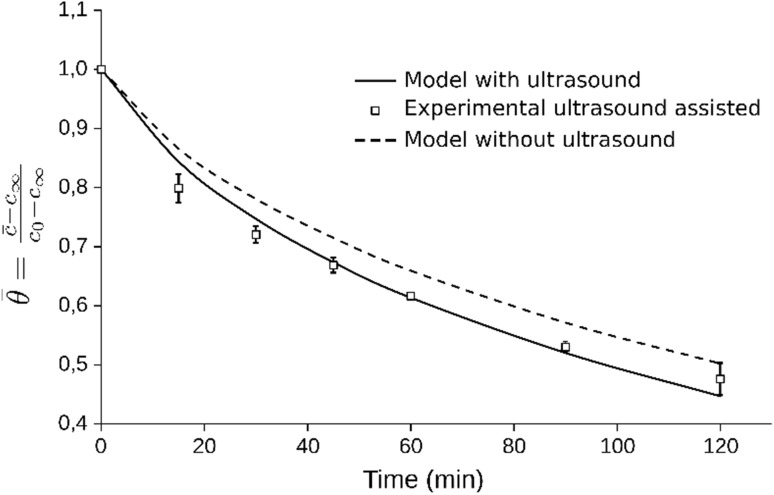
In order to observe the influence of ultrasound on the caffeine diffusion coefficient in the coffee beans, an experiment was carried out at 55 °C (value within the studied range and near the best), ultrasonic intensity of 89.25 W cm−2 (best range) and pulse of 0.7 (arbitrarily chosen since this effect was not significant) in order to compare to the aqueous extraction process without ultrasound at the same temperature (Fig. 5), using the values of the diffusion coefficient of caffeine in coffee beans considering to the hemispherical geometry. The diffusion coefficient of caffeine in coffee beans calculated for the process assisted with ultrasound was 7.436 × 10⁻¹¹ m2 s−1 (R2 = 0.988), and without ultrasound resulted in 6.126 × 10⁻¹¹ m2 s−1, showing an increase of 21% due to the ultrasound. Caffeine extraction with ultrasound, presents new opportunities for the industry, due to which the use of this technology can decrease the processing temperatures, avoiding major changes in the polymeric matrix of the coffee bean.
Fig. 5.
Comparison of the caffeine extraction processes without and with ultrasound at 55 °C, 89.25 W cm−2 ultrasonic intensity and 0.7 of ultrasonic pulse
As can be seen in Fig. 5, the mathematical model proposed in Eq. 1 resulted in higher values for the dimensionless concentration of caffeine in the bean for shorter extraction times (experimental data under the curve). This was also observed by Boonkird et al. (2008) in the capsaicinoids extraction process assisted with ultrasound of Capsicum frutescens (chilli pepper), on which the extraction rate was particularly intense in the beginning, and after about 5 min declined the intensity. In the present study this effect can be explained by considering that the caffeine present in the solution within the capillaries as part of the bean matrix were easily removed by the cavitation mechanism at the solid–liquid interphase (Cárcel et al. 2012). Moreover, in the first stages of the application of ultrasound, it produces rupture in the tissue of the superficial layers accelerating the extraction process and after this stage, the concentration gradient decreases.
Conclusion
The ultrasound intensity and the temperature influenced significantly the recovery of caffeine and the diffusion coefficient of caffeine. The low energy of activation (48.95 kJ mol−1) compared to the extraction without ultrasound, indicated the positive action of the ultrasound, showing synergistic effect with temperature. Using ultrasound intensity in the range of 68.25–105 W cm−2 at 60 ºC gave best values for both the recovery and caffeine diffusion coefficient. Ultrasound pulse (pulsed or continuous) did not show significant influence, which can be of commercial interest since pulse ultrasound may improve transducer probe shelf life and energy consumption. An increase 21.4% was observed in diffusion coefficient of caffeine assisted with high intensity ultrasound (89 W cm−2 ultrasound intensity and 0.7 pulse) at 55 °C temperature was observed. The proposed hemispherical mathematical model adjusted well (at R2 > 0.9) for most of the experimental data obtained from ultrasound assisted caffeine water extraction from coffee beans.
Contributor Information
Víctor J. Huamaní-Meléndez, Phone: +55 17 32155471, Email: vijuhmel@hotmail.com
Roger Darros-Barbosa, Email: roger@ibilce.unesp.br.
References
- Bon J, Simal S, Rosselló C, Mulet A. Drying characteristics of hemispherical solids. J Food Eng. 1997;34(2):109–122. doi: 10.1016/S0260-8774(97)00098-8. [DOI] [Google Scholar]
- Boonkird S, Phisalaphong C, Phisalaphong M. Ultrasound-assisted extraction of capsaicinoids from Capsicum frutescens on a lab-and pilot-plant scale. Ultrason Sonochem. 2008;15(6):1075–1079. doi: 10.1016/j.ultsonch.2008.04.010. [DOI] [PubMed] [Google Scholar]
- Cárcel JA, García-Pérez JV, Benedito J, Mulet A. Food process innovation through new technologies: use of ultrasound. J Food Eng. 2012;110(2):200–207. doi: 10.1016/j.jfoodeng.2011.05.038. [DOI] [Google Scholar]
- Chang KL, Ho PC. Gas chromatography time-of-flight mass spectrometry (GC-TOF-MS)-based metabolomics for comparison of caffeinated and decaffeinated coffee and its implications for Alzheimer’s disease. PLoS ONE. 2014;9(8):1–7. doi: 10.1371/journal.pone.0104621. [DOI] [PMC free article] [PubMed] [Google Scholar]
- Cheeke JDN. Fundamentals and applications of ultrasonic waves. Boca Raton: CRC Press; 2012. [Google Scholar]
- Chemat F, Tomao V, Virot M. Ultrasound-assisted extraction in food analysis. In: Ötleş S, editor. Handbook of food analysis instruments. Boca Raton: CRC Press; 2008. pp. 85–103. [Google Scholar]
- Chemat F, e-Huma Z, Khan MK. Applications of ultrasound in food technology: processing, preservation and extraction. Ultrason Sonochem. 2011;18(4):813–835. doi: 10.1016/j.ultsonch.2010.11.023. [DOI] [PubMed] [Google Scholar]
- Chemat F, Rombaut N, Sicaire A-G, Meullemiestre A, Fabiano-Tixier A-S, Abert-Vian M. Ultrasound assisted extraction of food and natural products: mechanisms, techniques, combinations, protocols and applications—a review. Ultrason Sonochem. 2017;34:540–560. doi: 10.1016/j.ultsonch.2016.06.035. [DOI] [PubMed] [Google Scholar]
- Chiang D, Lin CY, Hu CT, Lee S. Caffeine extraction from raw and roasted coffee beans. J Food Sci. 2018;83(4):975–983. doi: 10.1111/1750-3841.14060. [DOI] [PubMed] [Google Scholar]
- de Castro L, Capote FP. Analytical applications of ultrasound. Amsterdam: Elsevier; 2007. [Google Scholar]
- Dolatowski ZJ, Stasiak DM. Ultrasonically assisted diffusion processes. In: Lebovka F, Vorobiev N, Chemat E, editors. Enhancing extraction processes in the food industry. Amsterdam: CRC Press; 2011. pp. 123–144. [Google Scholar]
- Esclapez MD, García-Pérez JV, Mulet A, Cárcel JA. Ultrasound-assisted extraction of natural products. Food Eng Rev. 2011;3(2):108. doi: 10.1007/s12393-011-9036-6. [DOI] [Google Scholar]
- Farah A. Coffee constituents. In: Chu Y-F, editor. Coffee: emerging health effects and disease prevention. London: Wiley; 2012. pp. 21–58. [Google Scholar]
- Ghafoor M, Misra NN, Mahadevan K, Tiwari BK. Ultrasound assisted hydration of navy beans (Phaseolus vulgaris) Ultrason Sonochem. 2014;21(1):409–414. doi: 10.1016/j.ultsonch.2013.05.016. [DOI] [PubMed] [Google Scholar]
- Hashemi SMB, Michiels J, Yousefabad SHA, Hosseini M. Kolkhoung (Pistacia khinjuk) kernel oil quality is affected by different parameters in pulsed ultrasound-assisted solvent extraction. Ind Crops Prod. 2015;70:28–33. doi: 10.1016/j.indcrop.2015.03.023. [DOI] [Google Scholar]
- Heilmann W. Technology II: decaffeination of coffee. In: Clarke RJ, Vitzthum OG, editors. Coffee: recent Developments. London: Blackwell; 2001. pp. 108–124. [Google Scholar]
- Huamaní-Meléndez Víctor J., Darros-Barbosa Roger. Diffusion of water and caffeine in coffee beans using the hemispherical geometry approach. Journal of Food Process Engineering. 2018;41(6):e12809. doi: 10.1111/jfpe.12809. [DOI] [Google Scholar]
- International Organization for Standardization (2003) Green coffee:determination of loss in mass at 105 degrees C (ISO/TC Standard No. 6673:2003). Retrieved from https://www.iso.org/standard/38375.html
- International Organization for Standardization (2008) Coffee and coffee products: determination of the caffeine content using high performance liquid chromatography (HPLC)—reference method (ISO/TC Standard No. 20481:2008). Retrieved from https://www.iso.org/standard/34185.html
- Ji J-B, Lu X-H, Cai M-Q, Xu Z-C. Improvement of leaching process of Geniposide with ultrasound. Ultrason Sonochem. 2006;13(5):455–462. doi: 10.1016/j.ultsonch.2005.08.003. [DOI] [PubMed] [Google Scholar]
- Jun X. Caffeine extraction from green tea leaves assisted by high pressure processing. J Food Eng. 2009;94(1):105–109. doi: 10.1016/j.jfoodeng.2009.03.003. [DOI] [Google Scholar]
- Li H, Pordesimo L, Weiss J. High intensity ultrasound-assisted extraction of oil from soybeans. Food Res Int. 2004;37(7):731–738. doi: 10.1016/j.foodres.2004.02.016. [DOI] [Google Scholar]
- Mulet A, Cárcel J, Benedito J, Roselló C, Simal S. Ultrasonic mass transfer enhancement in food processing. In: Welti-Chanes J, Vélez-Ruiz JF, editors. Transport phenomena in food processing. Boca Raton: CRC Press; 2002. [Google Scholar]
- Palma M, Barroso CG. Ultrasound-assisted extraction and determination of tartaric and malic acids from grapes and winemaking by-products. Anal Chim Acta. 2002;458(1):119–130. doi: 10.1016/S0003-2670(01)01527-6. [DOI] [Google Scholar]
- Peralta-Jiménez L, Cañizares-Macías MP. Ultrasound-assisted method for extraction of theobromine and caffeine from cacao seeds and chocolate products. Food Bioprocess Technol. 2013;6(12):3522–3529. doi: 10.1007/s11947-012-1014-3. [DOI] [Google Scholar]
- Picó Y. Ultrasound-assisted extraction for food and environmental samples. TrAC Trends Anal Chem. 2013;43:84–99. doi: 10.1016/j.trac.2012.12.005. [DOI] [Google Scholar]
- Saleh IA, Vinatoru M, Mason TJ, Abdel-Azim NS, Aboutabl EA, Hammouda FM. A possible general mechanism for ultrasound-assisted extraction (UAE) suggested from the results of UAE of chlorogenic acid from Cynara scolymus L. (artichoke) leaves. Ultrason Sonochem. 2016;31:330–336. doi: 10.1016/j.ultsonch.2016.01.002. [DOI] [PubMed] [Google Scholar]
- Sereshti H, Samadi S, Jalali-Heravi M. Determination of volatile components of green, black, oolong and white tea by optimized ultrasound-assisted extraction-dispersive liquid–liquid microextraction coupled with gas chromatography. J Chromatogr A. 2013;1280:1–8. doi: 10.1016/j.chroma.2013.01.029. [DOI] [PubMed] [Google Scholar]
- Shirsath SR, Sonawane SH, Gogate PR. Intensification of extraction of natural products using ultrasonic irradiations: a review of current status. Chem Eng Process. 2012;53:10–23. doi: 10.1016/j.cep.2012.01.003. [DOI] [Google Scholar]
- Spiro M, Selwood RM. The kinetics and mechanism of caffeine infusion from coffee: the effect of particle size. J Sci Food Agric. 1984;35(8):915–924. doi: 10.1002/jsfa.2740350817. [DOI] [Google Scholar]
- Sun Y, Liu D, Chen J, Ye X, Yu D. Effects of different factors of ultrasound treatment on the extraction yield of the all-trans-β-carotene from citrus peels. Ultrason Sonochem. 2011;18(1):243–249. doi: 10.1016/j.ultsonch.2010.05.014. [DOI] [PubMed] [Google Scholar]
- Tao Y, Zhang Z, Sun D-W. Kinetic modeling of ultrasound-assisted extraction of phenolic compounds from grape marc: influence of acoustic energy density and temperature. Ultrason Sonochem. 2014;21(4):1461–1469. doi: 10.1016/j.ultsonch.2014.01.029. [DOI] [PubMed] [Google Scholar]
- Wang C, Sheu S, Chou Y-Y, Jang M-J, Yang L-C. A novel optimized energy-saving extraction process on coffee. 2011;15(11):53–59. doi: 10.2298/TSCI11S1053W. [DOI] [Google Scholar]
- Wang W, et al. Ultrasound-assisted heating extraction of pectin from grapefruit peel: optimization and comparison with the conventional method. Food Chem. 2015;178:106–114. doi: 10.1016/j.foodchem.2015.01.080. [DOI] [PubMed] [Google Scholar]
- Zou Y, Xie C, Fan G, Gu Z, Han Y. Optimization of ultrasound-assisted extraction of melanin from Auricularia auricula fruit bodies. Innov Food Sci Emerg Technol. 2010;11(4):611–615. doi: 10.1016/j.ifset.2010.07.002. [DOI] [Google Scholar]


