

Abstract
An optimization and multivariate accelerated shelf-life testing (MASLT) was demonstrated to develop a low glycemic (GI) whole jamun (Syzygium cumini L.) confection (WJC) with soft texture and fruity hedonics targeted for diabetic strata. The hydrocolloids viz., agar (1–3 g), pectin (1–3 g), and polydextrose (24–28 g) were optimized [mixture design (MD)] to obtain hydrocolloid mix (HM) with a soft texture. Next, whole jamun ingredients viz, jamun pulp (JP) (20–30 g), seed powder (JSP) (1–5 g), and HM (25–35 g) were optimized (MD + PCA) for satisfactory texture, total polyphenolic content (TPC), and fruity hedonics. The optimized WJC was assayed for GI and modelled by univariate kinetics and MASLT (10–45 °C/75% humidity/120 days). Using MASLT, the collated effects of quality attributes (anthocyanin content, TPC, moisture, hardness, and total color change) were extracted as principal components to estimate new stability parameters viz, multivariate rate constants (km), acceleration factors (), activation energy (Eam), and cut-off criterion. The optimized WJC contains 2.3 g agar, 1.9 g pectin, 27.2 g polydextrose, 26.4 g JP, and 2 g JSP and had satisfactory hardness (1007 g), TPC (2.8 mg gallic acid equivalents/g), and low GI value (48.6). The zero-order kinetic fitting of univariate versus MASLT resulted in , Ea, and shelf life (10 °C) of 7.8 versus 6.2, 43.81 versus 39.22 kJ/mol and 175 versus 186 days, respectively. MASLT simplified the kinetic interpretations to a single variable by collating the useful information from critical quality parameters and predicted shelf life precisely than univariate kinetics.
Electronic supplementary material
The online version of this article (10.1007/s13197-018-3423-4) contains supplementary material, which is available to authorized users.
Keywords: Jamun, Syzygium cumini L., Confectionary, Mixture design, Multivariate accelerated shelf life testing, Glycemic index
Introduction
Jamun (Syzygium cumini L.) is a purplish black color berry-bearing tree found mainly in tropical and sub-tropical regions of the world. Jamun berry is a seasonal and highly perishable sweet fruit with slight notes of sourness and astringency. It is highly prized for its well-documented health beneficial effects viz, antidiabetic, anticancerous, antimicrobial, antioxidant, hypolipidemic, hepatoprotective, and radioprotective (Sehwag and Das 2014; Singh et al. 2016). The distinctive color, taste, and therapeutic effectuates of whole jamun fruit (including pulp, skin, and seed) envisages the concept of formulating a functional food product. The existing literature on fruit based functional confections documented either confection with no added sugars (devoid of health claims) or functional confections with added sugar (Bali 2007; Savant 2010). With increasing health awareness of consumers, the demand for reduced-calorie food is growing at an unprecedented rate. Lately, a segment of confectionary research is converging on the idea of satisfying the sweet appetite of target consumers (obese and diabetic) while regulating their calories intake. An exciting and uncharted approach is to integrate the functional benefits of whole fruit (jamun) and its natural flavor to develop a soft functional confectionery. Jamun fruit is under-explored in the confection domain and could establish its mark as a source of clean label ingredient. It is acknowledged that antidiabetic confections market would surpass its competitors soon.
It is well known that a quantum of food additives viz, gelling, bulking, and preservative agents are needed to tailor the macroscopic properties of confections namely structure, stability, and hedonics. A mix of hydrocolloid ingredients (e.g. agar, pectin, and polydextrose) and jamun ingredients can be leveraged to design a tailored structure and functionality of confection. However, it is critical to optimize the levels of these ingredients which can significantly maximize the quality of products. The multistep approach to ingredient’s optimization using a mix of experimental designs is a useful strategy to realize their cascaded optimization. It gives a better insight into the functionality and interaction between individual ingredients as they are added in subsequent stages of product development. Some well-known examples are D-optimal mixture design (MD) which is a useful tool to optimize the formulation ingredients (Karasu et al. 2014). Besides, principal component analysis (PCA) is pivotal in multi-response optimizations to eliminate the redundancy arising from correlated responses (Upadhyay and Mishra 2015a).
For the stability testing of a new product, three important aspects are required to be known namely critical quality attributes, cut-off criteria, and storage conditions. The information about first two aspects could be known basis prior experience and from literature. However, defining the cut-off criterion is a complicated task which is often regulated by legislation and local market needs. When multiple variables are investigated, the matter becomes more complex as each variable has its cut-off criterion and ambiguity arises how to define the shelf life and validity of the product. Nevertheless, the interaction between the quality attributes is important to realize the real-time performance of products on market shelves. The accelerated studies are often conducted for a quick estimate of shelf life and temperature acceleration factor which provides a correlation between different storage. A multivariate tool such as principal component analysis (PCA) is widely used to extract useful information from multivariable shelf life studies (Upadhyay and Mishra 2016). Conventionally, PCA aims to find a new set of axes in multivariate space that better describe the shelf life data. Beyond contemporary way, the information from PCA can amend the quality parameters selection in shelf-life testing (Pedro and Ferreira 2006). The score values of principal components can be related to storage time to estimate the multivariate kinetic parameters to adjudge the cumulative effect of storage conditions (temperature and time) to product’s shelf life and validity.
We intended to put forward an alternative aspect to food product design to achieve tailored functionality. Taking up the case study of whole jamun confection (WJC), a step-wise optimization and multivariate accelerated shelf-life testing (MASLT) were first time deployed for product development and stability assessment. The objectives were framed as (1) step-wise optimization to fix the levels of WJC’s ingredients viz, hydrocolloid mix (HM) (agar, pectin, and polydextrose) and jamun ingredients (JIs) (jamun pulp (JP) and seed powder (JSP)). This step would bring about tailored structure (soft) and functionality (high phenolics, low glycemic index) to WJCs. (2) Assessing the quality changes in WJC during accelerated shelf life testing by univariate kinetics and MASLT. It is anticipated that the presented approach could be resourceful to researchers and food product developers.
Materials and methods
Materials
Fresh jamun berries were procured in peak growing season (May–July) from local market of Kharagpur (India). The fruits were thoroughly washed to remove surface dirt and later blotted. Pulps with adhering skin were manually separated from seeds and packaged in low-density polyethylene (LDPE) pouches (− 20 °C). Dried seeds were ground (120 μm) using rotary mill (Model Pulverisette 14, Fritsch, Germany). Food grade additives viz., agar (E-406), LM-pectin (E-440), polydextrose (E-1200), calcium chloride (E-509), and citric acid (E-330) were procured from Calpro Foods Private Limited (Delhi, India), and Brenntag Ingredients Private Limited (Mumbai, India), respectively. Other reagents were purchased from HiMedia (Mumbai, India).
Experimental designs
A sequence of experiments was designed to cascade down the effect of step-wise optimizations to develop WJC (supplementary material, Fig. 1). At each stage, the correlations between the responses were examined to avoid redundant data entering the optimization. PCA was applied to minimize the redundancy and data from correlated responses were extracted into principal component(s) (PC) which acted as a new response(s) (Upadhyay and Mishra 2015a).
Optimization of HM ratio (stage 1)
The individual hydrocolloids viz, agar, LM-pectin, and polydextrose were combined (MD, Table 1) to optimize and fix their ratio in HM base. The primary intent was to understand the interaction between the hydrocolloids and leverage their synergistic ability to develop an overall confection texture. The levels of agar (X1), LM-pectin (X2), and polydextrose (X3) varied between 1 ≤ X1 ≤ 3 g, 1 ≤ X2 ≤ 3 g, and 24 ≤ X3 ≤ 28 g, respectively, to reach 30 g in HM base (X1 + X2 + X3 = 30 g). The textural attributes viz, hardness (Y1), springiness (Y2), and cohesiveness (Y3) were considered as response variables.
Table 1.
D-optimal mixture design to optimize the hydrocolloid mix
| Runs | Independent variables | Response variablesa | ||||
|---|---|---|---|---|---|---|
| Agar (X1, g) | Pectin (X2, g) | Polydextrose (X3, g) | Hardness (Y1, g) | Springiness (Y2) | Cohesiveness (Y3) | |
| 1 | 1.00 | 1.87 | 27.13 | 207.71 ± 3.1b | 0.99 ± 0.01e | 0.35 ± 0.01bc |
| 2 | 2.91 | 1.00 | 26.09 | 753.12 ± 26.4e | 0.89 ± 0.01c | 0.32 ± 0.01ab |
| 3 | 1.04 | 3.00 | 25.96 | 202.05 ± 11.2b | 0.85 ± 0.02b | 0.42 ± 0.01de |
| 4 | 2.42 | 3.00 | 24.58 | 1203.41 ± 19.9gh | 0.81 ± 0.01a | 0.40 ± 0.02d |
| 5 | 1.86 | 1.87 | 26.27 | 751.42 ± 23.8e | 0.83 ± 0.01a | 0.40 ± 0.03d |
| 6 | 1.87 | 1.00 | 27.13 | 726.11 ± 16.8e | 0.96 ± 0.01d | 0.31 ± 0.01a |
| 7 | 3.00 | 2.28 | 24.72 | 1091.16 ± 21.4g | 0.90 ± 0.02c | 0.34 ± 0.01b |
| 8 | 1.00 | 1.00 | 28.00 | 79.52 ± 5.5a | 0.92 ± 0.01c | 0.41 ± 0.01e |
| 9 | 2.91 | 1.00 | 26.09 | 1028.41 ± 15.2f | 0.86 ± 0.02b | 0.29 ± 0.02ac |
| 10 | 2.18 | 2.39 | 25.42 | 224.47 ± 10.8c | 0.84 ± 0.01ab | 0.35 ± 0.04bc |
| 11 | 2.42 | 3.00 | 24.58 | 934.02 ± 13.1f | 0.83 ± 0.05a | 0.41 ± 0.03e |
| 12 | 3.00 | 2.28 | 24.72 | 1274.61 ± 16.7h | 0.84 ± 0.02ab | 0.39 ± 0.04cd |
| 13 | 1.00 | 1.00 | 28.00 | 497.33 ± 17.7d | 0.90 ± 0.01c | 0.35 ± 0.01b |
| 14 | 1.74 | 3.00 | 25.26 | 234.91 ± 8.5c | 0.91 ± 0.03c | 0.38 ± 0.02c |
| 15 | 2.94 | 1.66 | 25.41 | 1064.81 ± 18.2fg | 0.88 ± 0.08bc | 0.37 ± 0.03c |
| 16 | 1.04 | 3.00 | 25.96 | 205.06 ± 7.4b | 0.85 ± 0.02b | 0.42 ± 0.05e |
aExperimental values of responses were reported as mean ± SD (n = 5). Mean values with different superscript alphabets were significantly different (p < 0.05)
Optimization of confection formulation (stage 2)
In this step, the levels of HM (X4, 25 ≤ X4 ≤ 35 g), previously optimized to fix the ratio of individual hydrocolloids, and JIs viz, JP (X5, 20 ≤ X5 ≤ 30 g) and JSP (X6, 1 ≤ X6 ≤ 5 g) were optimized using MD to obtain WJC (X4 + X5 + X6 = 60 g) (Table 2). JP and JSP, being a rich source of polyphenols and anthocyanins, were added to introduce the fruit like hedonics and functionality to the confection. The textural attributes viz, hardness (Y4), springiness (Y5), and cohesiveness (Y6), total phenolic content (TPC) (Y7), and sensory attributes viz, appearance (Y8), taste (Y9), flavor (Y10), mouthfeel (Y11), and overall acceptability (Y12) were considered as response variables.
Table 2.
D-optimal mixture design to optimize the confection formulation
| Runs | Independent variables | Response variables | PC1 scores | ||||||||||
|---|---|---|---|---|---|---|---|---|---|---|---|---|---|
| HM (X4, g) | JP (X5, g) | JSP (X6, g) | Texture* | TPC#@ (Y7, mg GAE/100 g) | Sensory attributesǂ | ||||||||
| Hardness (Y4, g) | Springiness (Y5) | Cohesiveness (Y6) | Appearance (Y8) | Taste (Y9) | Flavor (Y10) | Mouthfeel (Y11) | Overall Acceptability (Y12) | ||||||
| 1 | 27.24 | 27.76 | 5.00 | 325.75 ± 10.22a | 0.91 ± 0.02d | 0.66 ± 0.01a | 140 ± 0.01d | 5.96 ± 0.07b | 6.44 ± 0.21ef | 5.76 ± 0.06c | 5.68 ± 0.04b | 5.96 ± 0.11c | − 1.59d |
| 2 | 26.91 | 30.00 | 3.09 | 586.10 ± 11.13d | 0.89 ± 0.01d | 0.66 ± 0.01a | 130 ± 0.01c | 6.88 ± 0.01e | 6.80 ± 0.07f | 6.12 ± 0.11d | 6.60 ± 0.03e | 6.44 ± 0.02de | 0.32f |
| 3 | 28.77 | 30.00 | 1.23 | 561.80 ± 14.05d | 0.84 ± 0.01bc | 0.73 ± 0.01c | 106 ± 0.00a | 7.28 ± 0.02f | 7.32 ± 0.03gh | 6.64 ± 0.17f | 6.92 ± 0.03f | 7.16 ± 0.06h | 1.91g |
| 4 | 35.00 | 23.20 | 1.80 | 760.58 ± 16.12g | 0.82 ± 0.01b | 0.71 ± 0.01b | 140 ± 0.02d | 7.08 ± 0.06ef | 6.68 ± 0.01f | 6.24 ± 0.14e | 6.32 ± 0.11d | 6.48 ± 0.05e | 0.30f |
| 5 | 26.91 | 30.00 | 3.09 | 686.10 ± 11.34e | 0.86 ± 0.03c | 0.69 ± 0.01b | 219 ± 0.01f | 6.28 ± 0.08cd | 7.48 ± 0.04h | 6.79 ± 0.07f | 6.86 ± 0.09f | 6.86 ± 0.05g | 1.26g |
| 6 | 35.00 | 20.00 | 5.00 | 595.70 ± 19.71d | 0.82 ± 0.01b | 0.68 ± 0.01ab | 159 ± 0.02e | 5.84 ± 0.04b | 4.68 ± 0.07a | 5.16 ± 0.02a | 5.92 ± 0.11c | 5.48 ± 0.13a | − 3.10a |
| 7 | 35.00 | 23.20 | 1.80 | 760.58 ± 20.20g | 0.80 ± 0.01a | 0.71 ± 0.01b | 113 ± 0.00b | 7.08 ± 0.14e | 6.68 ± 0.11f | 6.24 ± 0.04e | 6.32 ± 0.10d | 6.48 ± 0.04e | 0.30f |
| 8 | 28.77 | 30.00 | 1.23 | 561.80 ± 8.04d | 0.88 ± 0.02cd | 0.73 ± 0.01c | 131 ± 0.00c | 7.28 ± 0.19f | 7.32 ± 0.18gh | 6.64 ± 0.02f | 6.92 ± 0.04f | 7.16 ± 0.07h | 1.91g |
| 9 | 32.81 | 22.72 | 4.48 | 424.75 ± 6.36c | 0.78 ± 0.01a | 0.64 ± 0.00a | 321 ± 0.02i | 6.04 ± 0.21c | 4.96 ± 0.04b | 5.48 ± 0.08b | 5.84 ± 0.02c | 5.80 ± 0.01b | − 2.44c |
| 10 | 35.00 | 20.00 | 5.00 | 695.70 ± 11.22f | 0.80 ± 0.00b | 0.70 ± 0.01b | 133 ± 0.01c | 5.93 ± 0.07b | 5.48 ± 0.07c | 5.86 ± 0.01c | 6.22 ± 0.02d | 5.98 ± 0.02c | − 1.61d |
| 11 | 30.11 | 24.89 | 5.00 | 349.88 ± 10.52b | 0.87 ± 0.02c | 0.69 ± 0.00b | 321 ± 0.03i | 5.16 ± 0.04a | 6.16 ± 0.06e | 5.52 ± 0.02b | 5.36 ± 0.06a | 5.92 ± 0.05c | − 2.58b |
| 12 | 29.47 | 27.43 | 3.10 | 658.75 ± 12.40e | 0.83 ± 0.01b | 0.66 ± 0.00a | 229 ± 0.01g | 6.48 ± 0.08d | 6.68 ± 0.16f | 6.04 ± 0.05d | 6.96 ± 0.21f | 6.60 ± 0.18f | 0.35f |
| 13 | 25.00 | 30.00 | 5.00 | 330.75 ± 7.11a | 0.87 ± 0.00c | 0.66 ± 0.01a | 391 ± 0.01j | 6.36 ± 0.11d | 5.68 ± 0.19d | 6.08 ± 0.11d | 5.84 ± 0.07c | 6.32 ± 0.03d | − 1.12e |
| 14 | 32.10 | 24.90 | 3.00 | 750.00 ± 7.84g | 0.81 ± 0.01ab | 0.66 ± 0.01a | 242 ± 0.01h | 7.52 ± 0.16g | 7.16 ± 0.14g | 7.32 ± 0.06g | 7.44 ± 0.06g | 7.32 ± 0.02i | 2.91h |
| 15 | 32.19 | 26.81 | 1.00 | 1017.90 ± 9.01h | 0.87 ± 0.00c | 0.71 ± 0.01b | 127 ± 0.00c | 8.24 ± 0.19h | 7.72 ± 0.06i | 7.68 ± 0.14h | 7.64 ± 0.0h | 7.76 ± 0.07j | 4.29i |
| 16 | 25.00 | 30.00 | 5.00 | 330.75 ± 4.74a | 0.90 ± 0.01d | 0.66 ± 0.01a | 497 ± 0.04k | 6.36 ± 0.06d | 5.68 ± 0.09d | 6.08 ± 0.12d | 5.84 ± 0.0c | 6.32 ± 0.11d | − 1.12e |
Experimental values of responses were reported as mean ± SD (*n = 5, #n = 3, ǂn = 25). Mean values with different superscript alphabets were significantly different (p < 0.05)
Preparation and storage of confection
HM base
The agar, LM-pectin, and polydextrose (30 g mix) were dispersed in ca. 70 g Milli-Q water (Millipore, Bedford, USA) assisted by brief heating (ca. 80 °C) to allow adequate dispersion (Table 1). The mix was casted into molders (9 cells × 8 mL) preloaded with a CaCl2 solution (200 μL, 5% w/v) with continuous stirring (supplementary material, Fig. S2) and allowed to set at room temperature followed by overnight refrigeration (4 °C). The solid HM bases were packaged in transparent cling film (Optima Novel Packaging Technologies, Hyderabad, India) and LDPE pouches as primary and secondary packaging, respectively. The pouches were refrigerated (4 °C) until analyzed.
Confection formulation
For confection preparation, the known amounts of HM (Table 2) were dissolved in heated distilled water (ca. 39.86 g) followed by the addition of JIs viz, JP and JSP with constant stirring to reach homogeneity. At this stage, the confection formulation was added with sucralose powder (0.06%) and citric acid (0.08%), as taste adjuncts, and reheated (ca. 1 min) before casting to molders. Later, the benzoic (0.02%) and sorbic acid (0.09%) were added as preservatives to prolong the shelf life of WJC.
Storage plan
The prepared WJCs were pillowed pouched (9 × 4 cm) in metalized BOPP laminates (18 µm BOPP/18 µm metalized BOPP) having water–vapor (38 °C, 90% relative humidity) and oxygen transmission rate (25 °C) of 0.7 g−2 day−1 and 108 cm3 m−2 day−1, respectively. The packaged WJCs were stored at four different temperatures (10, 25, 35 and 45 °C) under constant accelerated relative humidity (75%) conditions for 120 days. The samples were periodically withdrawn (15 days) and analyzed for selected quality attributes namely anthocyanin content (AC) (mg malvidin-3-glucosides (M3G)/100 g), total phenolic content (TPC) (mg gallic acid equivalents (GAE)/100 g), moisture content (MC) (%), hardness (g-force), and total color change (ΔE).
Quality parameters
Physicochemical analyses
The texture profile analyses of HM bases and confection formulations were done using texture analyzer (CT3-100, Brookfield Engineering Lab, Massachusetts, USA). The instrument was set for two-cycle compression with 20% deformation at 25 kg load cell using a cylindrical probe (P20) of 20 mm diameter at 0.5 mm/s of test speed to record hardness (HD), springiness (SG), and cohesiveness (CS) of confection (Mitchell 2003). The pH and MC (%) of confections were measured using pH papers (1–4 range, 0.5 gradients) (Merck, Germany) and AOAC (2012) method. The color of confections was measured by a colorimeter (CM-5, Konica Minolta Sensing Americas, Inc., NJ, USA) in L* (lightness), a* (redness), and b* (yellowness) scale and total color change (ΔE) were calculated using Eq. (1):
| 1 |
where the subscript 0 and t represents the values at day 0 and time t, respectively.
TPC and AC of confections were determined by modified Folin–Ciocalteu assay and pH differential method, as described elsewhere (Sehwag and Das 2016a).
Sensory analysis
The sensory attributes namely appearance, taste, flavor, mouthfeel, and overall acceptability of confection formulations were evaluated using 9-point hedonic scale (1 = disliked extremely, 5 = neither liked nor disliked, and 9 = liked extremely). Twenty-five semi-trained panelists (non-smokers) comprising research scholars and faculties of Indian Institute of Technology Kharagpur (India) were selected through personal communication, interest, and willingness to participate. WJCs were coded with three-digit numbers and presented in random order to panelist in well-ventilated and lightened rooms. The panelists were presented with four samples per sitting to avoid the development of sensory fatigue.
Functional attributes
Dried and defatted WJCs were analyzed for total dietary fiber content (TDFC) using K-TDFR megazyme dietary fiber kit (Megazyme Inc., Chicago, USA) following manufacturer’s protocol. Glycemic index (GI) was determined by in vivo (rat model system) and in vitro (enzymatic digestion) assays (supplementary material, Fig. 2). For anti-diabetic effects of WJC, the α-amylase inhibition assay and glucose diffusion test were conducted to evaluate the post-prandial hyperglycemic effects and glucose dialysis retardation index (GDRI), respectively (supplementary material, Fig. 3).
Kinetic modeling
Univariate kinetics
The univariate kinetics of quality attributes were determined using the methodology proposed by Upadhyay and Mishra (2015b). The kinetic models of the quality attributes were obtained by regressing the quality attributes against storage time and fitting the experimental data. The same procedure was applied to the multivariate kinetic, except that the score values of first time-related PCs were regressed, as proposed by Pedro and Ferreira (2006). Arrhenius equation was used to examine the temperature dependence of kinetic rate constant (k) and to calculate the activation energy (Ea) and temperature acceleration factor (αT). The equation parameters (slope and intercept) of the regression lines generated by plotting ln (k) versus 1/T were calculated per Eq. (2):
| 2 |
where A and R are frequency factor and molar gas constant (8.314 J/mol K), respectively.
Multivariate kinetics
The average data from repeated measurements of quality attributes (AC, TPC, MC, HD, and ΔE; 5 variables) at different storage temperatures (10, 25, 35, and 45 °C; 4 observations) obtained over time (0–120 days; 9 observations) were sequentially arranged in a matrix (36 observations × 5 variables) and PCA was performed. It was assumed that the variations in quality attributes are the main sources of data variability under different storage conditions. The first set of time-related PCs which best described the major factors of deterioration were extracted. By plotting the scores of first PCs versus time, the multivariate kinetics was adjusted to estimate temperature-dependent multivariate reaction rate constant (km) and multivariate acceleration factor () which is analogous to Q10 coefficients (Pedro and Ferreira 2006). Using Arrhenius model, the temperature dependence of km was examined, and multivariate activation energy (Eam) was estimated. A multivariate cut-off criterion (tcm) was calculated for each PCs which corresponds to the matrix product of the specification vector (containing cut-off values of each quality attribute basis 15% reduction in original value) and the loadings matrix of each time-related PCs (Pedro and Ferreira 2006). Lastly, the shelf life was estimated basis tcm by regressing scores of PCs versus storage time.
Statistical analyses
All the experiments were triplicated unless specified. Mean values with standard deviations were reported and compared using paired t test, one-way analysis of variance (ANOVA), and least significant difference (LSD). The experimental designs and numerical optimizations were performed using Design Expert v8.0.0 (Stat-Ease Inc., Minneapolis, USA). PCA was performed using OriginPro v9.0 (OriginLab Corporation, Northampton, MA, USA). The optimized results were validated by percentage absolute residual error (%ARE).
Results and discussions
Effect of ingredients on responses
HD
In HM optimization (MD, Table 1), the HD of HM base varied from 79 g (run 8) to 1274.6 g (run 12) whereas, it varied from 325.8 g (run 1) to 1017.9 g (run 15) after the incorporation of JIs during confection optimization (MD, Table 2). The HD of HM base and confections was significantly different (p < 0.05), the former being higher than latter indicated that addition of JIs leads to decrease in the HD of confection. The response surface plots were used to compare the effects of ingredients on responses under the experimental domain. The HD of HM increased proportionally with agar content and vice versa for polydextrose, whereas pectin did not affect the HD to a significant extent [Fig. 1A(a)]. This trend was evidently in model equations for HD where a significant positive coefficient of agar indicates its direct effect on the HD (supplementary material, Table 1). The agar exhibits a positive effect on gel strength of the agar-gelatin system, as reported by Somboon et al. (2014). For LM pectin, the gelation occurs due to the bridging of calcium ions between neighboring pectin chains by ionic interactions. The agar and LM-pectin acted synergistically to texturize the HM base of confection, a finding that supports their reported synergistic properties (Somboon et al. 2014). Upon addition of JIs to optimized HM base formulation, an increase and decrease in HD were noted with JP and JSP, respectively [Fig. 1B(d)]. The piepel’s plot showed that the JP and HM covered the maximum area of deviation than JSP and hence positively impacted the HD of confection. Being hygroscopic, JSP would have imbibed the free moisture during confection formulation which reduced the hydrogen bonding between agar chains and hence, negatively impacted the confection’s hardness. It was observed that HM–JP had a positive effect on HD whereas JSP–JP and JSP–HM had a negative effect (p < 0.05) [Fig. 1B(d)].
Fig. 1.
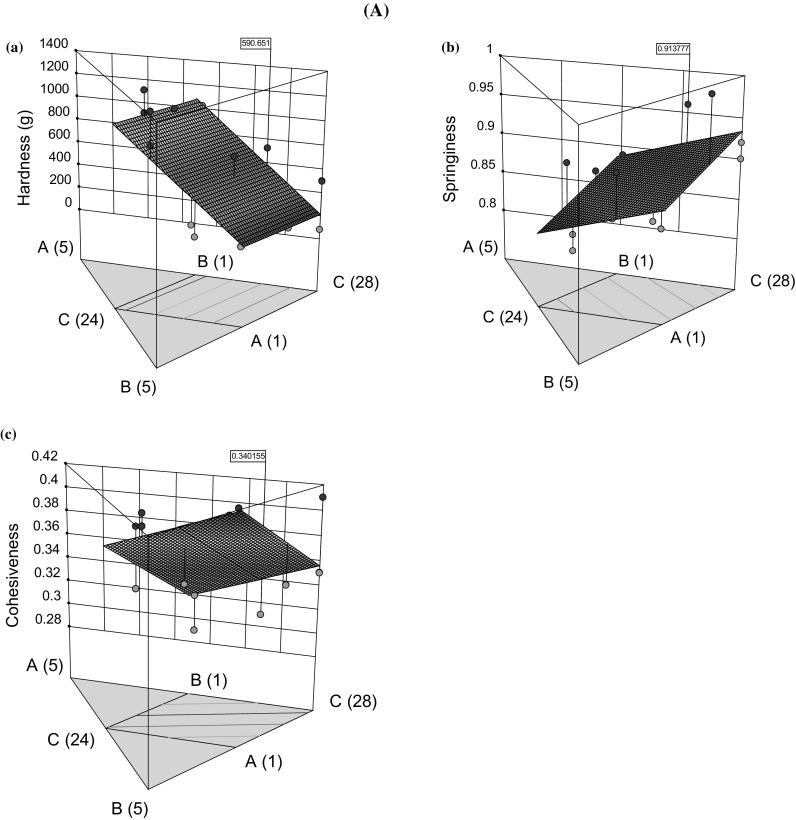
Response surface plots to illustrate A effect of hydrocolloids (A: agar, B: pectin, C: polydextrose) on (a) hardness, (b) springiness, and (c) cohesiveness of hydrocolloid mix base. B Effect of formulation ingredients (A: hydrocolloid mix, B: jamun pulp, C: jamun seed powder) on (d) hardness, (e) springiness, (f) cohesiveness, (g) total phenolic content, and (h) PC1 scores of confections
SG
SG of HM base varied between 0.81 (run 4) to 0.99 (run 1) (MD, Table 1), whereas it ranged from 0.78 (run 9) to 0.91 (run 1) after the incorporation of JIs in confection formulation optimization (MD, Table 2). The combined effect of JIs with HM was non-significant on SG of confection (p > 0.05). However, the individual effects were significant as explained by regression models (supplementary material, Table 1). The response surface plots indicated that SG was positively influenced by non-gelling component (polydextrose) and JIs for HM base [Fig. 1A(b)] and confection [Fig. 1B(e)], respectively. The polydextrose behaves as bulking agent and forms a continuous phase which contributes to chewiness and SG after being entrapped in three-dimensional networks of agar and LM-pectin (Raju and Pal 2011). Among JIs, JP had a greater effect on SG of confection than JSP.
CS
CS of HM base varied between 0.29 (run 9) to 0.42 (run 3) (MD, Table 1), whereas it ranged from 0.64 (run 9) to 0.73 (run 3) after the incorporation of JIs in confection formulation optimization (MD, Table 2). A significant increase in CS was noted after adding JIs to HM base (p < 0.05). In HM base, the CS was mainly attributed to LM-pectin than agar and polydextrose [Fig. 1A(c)]. In confections, the response plot showed the gradual positive effect of all ingredients except JSP which steeply increased [Fig. 1B(f)]. Besides, the polydextrose had more impact on the CS of confection than agar (p < 0.05). In the present case, the HM base is purely polysaccharide in nature, and hence, the effect of polysaccharides interaction on texture was considered. The mathematical models revealed the adverse effects of JP–JSP and HM–JSP on CS of the confection (p < 0.05) (supplementary material, Table 1).
TPC
During confection optimization, the TPC varied between 1.06 and 4.97 mg GAE/g confection dry basis (db). JP and JSP positively impacted TPC, whereas negative effect noted with HM. JP and JSP are polyphenols rich and contributed to increasing the TPC of confections [Fig. 1B(g), supplementary material, Table 1]. It is worth mentioning that higher TPC of plant materials is mostly responsible for their greater degree of antioxidant activity (Singh et al. 2018; Sehwag and Das 2016b; Upadhyay et al. 2015).
Correlation between responses
A close examination of responses measured during optimization stages 1 and 2 revealed interesting correlations among them (supplementary material, Table 3). In stage 1, a weak correlation was noted among textural responses (r < 0.45), whereas good correlation (r > 0.75) was noted between sensory parameters in stage 2. Therefore, PCA was applied to reduce the redundancy in sensory data due to correlated responses, and PCs were extracted. The score values of PCs can be regarded as new response subjected to its satisfactory correlation with original responses (Upadhyay and Mishra 2015a). PC1 explained the maximum variability in sensory data set (88.1%) and exhibited a good correlation with original responses (> 0.90) (supplementary material, Table 3). Therefore, PC1 was chosen as a new response along with HD, SG, and CS to optimize the composition of optimized functional confection (OFC).
PC1
All formulation ingredients (HM, JP, and JSP) significantly impacted the quality attributes of the confections [Fig. 1B(h)] which varied between − 3.10 and 4.29 for PC1. JSP negatively affected the overall PC1 scores whereas it was improved with the addition of HM and JP. Interestingly, the binary interaction of JSP with JP and HM served to improve the PC1 scores whereas their tertiary interaction was detrimental to it (supplementary material, Table 1). The response surface plots provided useful insights into the individual and interactive effect of formulation ingredients on an overall sensory quality of confection as PC1 scores.
Optimization of formulation ingredients
The sequential optimization was arrived by setting up the desired goal of tailored textural attributes, desired hedonics as PC1, and high TPC of WJC. It is worth mentioning that the levels of ingredients were followed as per good manufacturing practices. The numerical optimization was used to arrive at the combination of ingredients while considering the goal set for response variables and maximizing the desirability function.
The levels of hydrocolloids in HM were optimized with a goal set to maximize the textural responses (Y1, Y2, and Y3) which were given an equal ‘weightage’ (1) and ‘importance’ (+++) criteria while keeping the hydrocolloids levels under defined experimental range (Table 1). Two different optimized combinations of HM were obtained viz., set 1 (2.19 g agar, 1.81 g pectin, and 26.01 g polydextrose) and set 2 (2.04 g agar, 1.00 g pectin, and 26.97 g polydextrose) with the desirability of 0.50 and 0.46, respectively. The set 1 with better desirability than set 2 was selected as an optimized HM base to develop confection formulation. The experimental and predicted values of responses were in close agreement with each other, as indicated by ARE (< 10%) (supplementary material, Table 2).
The optimized proportion of HM was cascaded to the next step of optimizing the confection formulation comprising HM, JP, and JSP as independent variables. This step yielded three optimized combinations with a targeted goal to achieve soft textural features (Y4, Y5, and Y6), high TPC (Y7) and PC1 scores (Y8) within the experimental domain of independent variables (Table 2). The optimized combination consisted of 31.63, 26.38, and 2.00 g of HM, JP, and JSP, respectively (totaling 60 g/100 g confection) with the desirability of 0.60 and closed allianced experimental and predicted the value of responses (supplementary material, Table 2). The final optimized WJC (no added sugar) (100 g basis) consisted of HM (2.29 g agar, 1.89 g pectin, and 27.24 g 330 polydextrose) and JIs (26.38 g JP and 2 g JSP) supplemented with preservatives (0.02 g benzoic acid and 0.09 g sorbic acid) and taste adjuncts (0.06 and 0.08 g of sucralose and citric acid, respectively) (ARE < 10%) (supplementary material, Table 2).
Functional attributes
TDFC of WJC was estimated as 7.07% (wb) which constitutes 62.74 and 37.26% of soluble and insoluble fractions, respectively. GI of WJC was calculated as 48.55 and 49.17 by in vitro and in vivo assays, respectively, thus suitably placing it among low GI foods (Howlader and Biswas 2009). It could be attributed to high TDFC and α-amylase inhibitory activity (IC50 = 185.87 mg/ml) of WJCs which slowed down the digestion of carbohydrates to glucose units and hence, regulated post-prandial hyperglycemia (supplementary material, Table 4) (Chung et al. 2006). Chethan et al. (2008) reported the non-competitive inhibition of α-amylase by polyphenols and hence, the high TPC would have contributed to reduced α-amylase activity.
The glucose dialysis results revealed the ability of WJC to inhibit the diffusion of glucose via a semi-permeable membrane. GDRI is conventionally used as a scale to measure the effect of a compound/product to delay the glucose dialysis in the gut (López et al. 1996). Higher GDRI indicates lower glucose diffusion and hence better antidiabetic potential. The GDRI of WJC was estimated to be 3.97, 9.71, 11.84, 12.13, and 20.89 when measured for 1.5 h with an interval of 15 min. Dietary fibers can also contribute towards GDRI by (1) absorbing the glucose molecules and reducing the rate of diffusion (Chau et al. 2004) and (2) physically entrapping the glucose molecules and forming a complex network (Ahmed and Urooj 2010). López et al. (1996) reported that insoluble fraction of TDFC is more effective than soluble in delaying the glucose diffusion. WJC was high insoluble dietary fibers (37.3%) which contributed to its high GDRI. Overall, WJC was found to be low a GI food with high TDFC and could act as preferred snack food choice among diabetic population.
Shelf life testing
Univariate kinetics
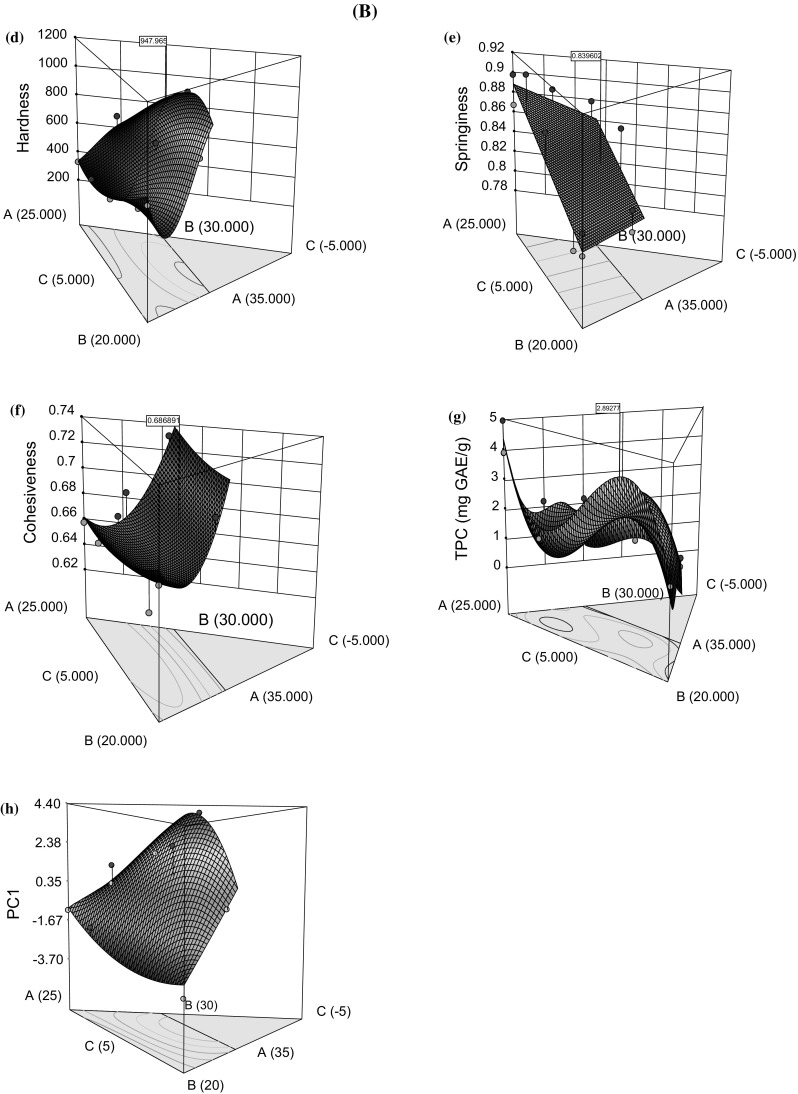
The time–temperature related changes in the quality parameters are presented in Fig. 2(a–e). An overall decrease was noted in all the measured parameters except for ΔE which throughout increased. The time–temperature related quality changes were best fitted to zero order reaction kinetics, and k were calculated at each storage temperature (0.76 < R2 < 0.90) (Table 3). The temperature dependence of k was predominately noted for WJCs stored at warmer temperatures (≥ 25 °C) which fasten the rate of quality changes. For an instance, at 45 °C approximately 84, 7, 2, 62, and 45% change from initial values was observed for AC (125.07–20.34 mg M3G/100 g), TPC (424–396.07 mg GAE/100 g), MC (55.57–54.33%), HD (1195.9–451.2 g-force), and ΔE (15.19–22.06), respectively. The effect of increasing storage temperatures on accelerated changes in quality parameter was satisfactorily explained by αT (Table 3). A relatively higher degree of changes in αT values was noted when storage transitioned beyond 10 °C. Using Arrhenius equation, lnk was plotted against 1/T to estimate the Ea which significantly varied among the measured quality parameters and directly related to variations in k values (p < 0.05). Based on reaching the cut-off limit for each quality attribute (basis 15% reduction in initial values), the shelf life was calculated at each storage temperature (Table 3). There was considerable variability in the estimated shelf life of WJC basis each quality attribute at each of the storage condition. Often, the selection of quality parameter for setting product’s stability cut-off criterion is based on legal requirements or developer’s experience which might be subjective. Therefore, the multivariate effects of quality parameters are critical to adjudge the legitimate shelf life of WJC and MASLT approach was tested.
Fig. 2.
Variations in a anthocyanin content (AC), b total phenolic content (TPC), c moisture content (MC), d hardness (HD), and e total color change (ΔE) during storage
Table 3.
Kinetic rate constants and shelf-life of confection predicted by univariate and multivariate analysis
| Quality attributes | Storage temperature (°C) | K * | αT (T,10) | Shelf life (days) | Ea (kJ/mol) | R 2 |
|---|---|---|---|---|---|---|
| AC (mg M3G/100 g) | 10 | 1.20 × 10⁻¹a | 1a | 175.31c | 43.81b | 0.90 |
| 25 | 6.63 × 10⁻¹b | 5.5b | 37.56b | |||
| 35 | 8.92 × 10⁻¹c | 7.4c | 24.93ab | |||
| 45 | 9.37 × 10⁻¹c | 7.8c | 15.15a | |||
| TPC (mg GAE/100 g) | 10 | 9.00 × 10⁻⁴a | 1a | 70,644.16d | 118.48e | 0.86 |
| 25 | 5.94 × 10⁻²b | 66b | 1069.52c | |||
| 35 | 1.66 × 10⁻¹c | 184c | 391.94b | |||
| 45 | 2.32 × 10⁻¹c | 258d | 287.04a | |||
| MC (%) | 10 | 6.90 × 10⁻³b | 1a | 1177.43c | 11.48a | 0.85 |
| 25 | 9.90 × 10⁻³a | 1.4ab | 837.00b | |||
| 35 | 1.22 × 10⁻²c | 1.8b | 681.17a | |||
| 45 | 1.14 × 10⁻²c | 1.7b | 707.83ab | |||
| HD (g-force) | 10 | 6.18 × 10⁻¹b | 1.0a | 258.12b | 53.45c | 0.89 |
| 25 | 3.66 × 10⁻¹a | 5.9b | 50.68ab | |||
| 35 | 7.21 × 10⁻¹c | 11.7c | 25.71a | |||
| 45 | 7.09 × 10⁻¹bc | 11.5c | 20.54a | |||
| ΔE | 10 | 4.00 × 10⁻³a | 1a | 3746.18b | 70.79d | 0.76 |
| 25 | 9.49 × 10⁻²b | 24b | 153.47a | |||
| 35 | 1.11 × 10⁻¹c | 28b | 133.18a | |||
| 45 | 1.16 × 10⁻¹c | 29b | 113.55a | |||
| PC1 scores | 10 | 4.50 × 10⁻³a | 1a | 185.46c | 39.22b | 0.90 |
| 25 | 1.70 × 10⁻²b | 3.8b | 56.97b | |||
| 35 | 2.59 × 10⁻²c | 5.8bc | 37.76ab | |||
| 45 | 2.77 × 10⁻²c | 6.2c | 27.56a |
Mean values were reported with coefficient of variation < 5%. Mean values with different superscript alphabets were significantly different (p < 0.05)
k, Kinetic rate constant; αT, temperature acceleration factor; AC, anthocyanin content; TPC, total phenolic content; MC, moisture content; HD, hardness; ΔE, total color change; Ea, activation energy; R2, coefficient of determination
*Measured in ([units]/day) for univariate analysis (zero order); PC1 score/day for multivariate analysis (zero order)
MASLT
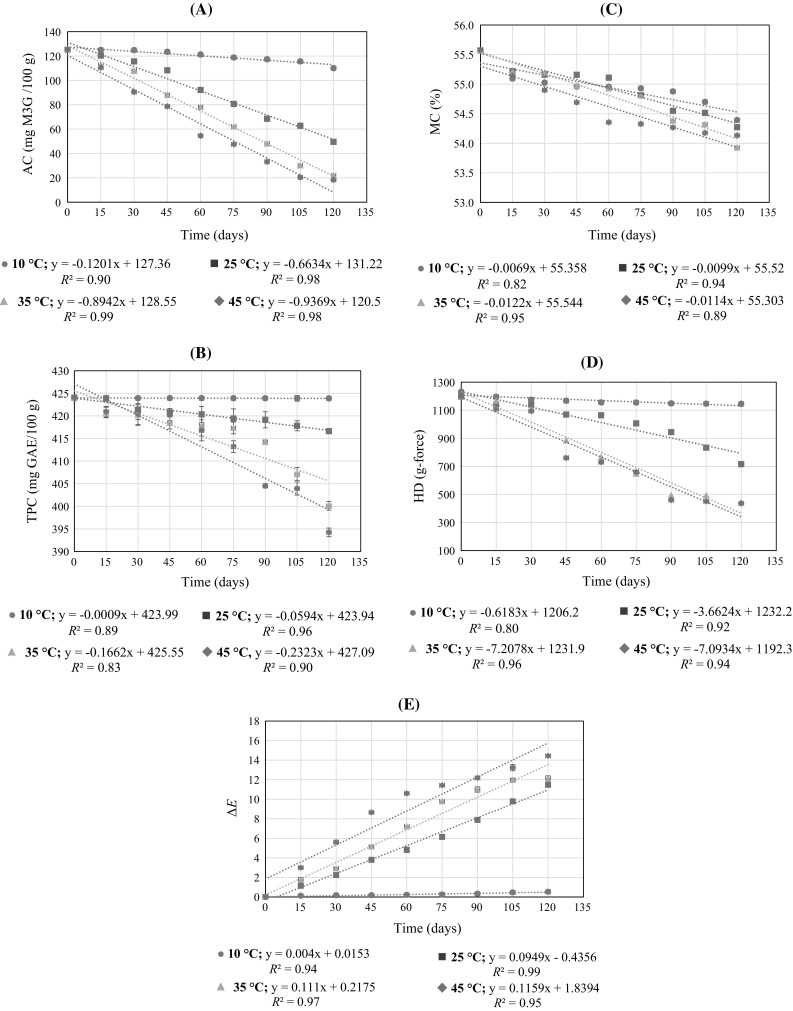
The data matrix containing the quality attributes at all the storage conditions (10, 25, 35, and 45 °C) were simultaneously analyzed using PCA. The biplot chart revealed the relative spread of quality parameters and storage samples along the extracted PCs (Fig. 3A). Two PCs (PC1 and PC2) cumulatively explained 96% of the variability in the original multivariable data which is a reasonable considering the intrinsic variability in the quality parameters (Table 3). Throughout storage, WJCs kept at 10 (A), and 25 °C (B) were mostly positioned near the positive quadrant along PC1 which indicates their higher values for MC, AC, TPC, and HD than counterparts stored at 35 (C) and 45 °C (D). In the later stages of storage, most of the WJC samples were negatively loaded along PC1 owing to their decreasing trend of quality parameters. A negative correlation was noted between AC and ΔE which indicates that degradation of anthocyanins leads to overall increase in ΔE which is an undesirable trait. HD was related to MC which shows the importance of moisture loss to the overall loss in soft texture of WJCs. All the samples, except A, which were stored over 60 days were located along PC2 and had higher values for ΔE while lower values for MC, AC, HD, and TPC which suggest the greater degree of time–temperature related degradation in the latter set of attributes. These trends were entirely allianced with those noted in univariate kinetics.
Fig. 3.
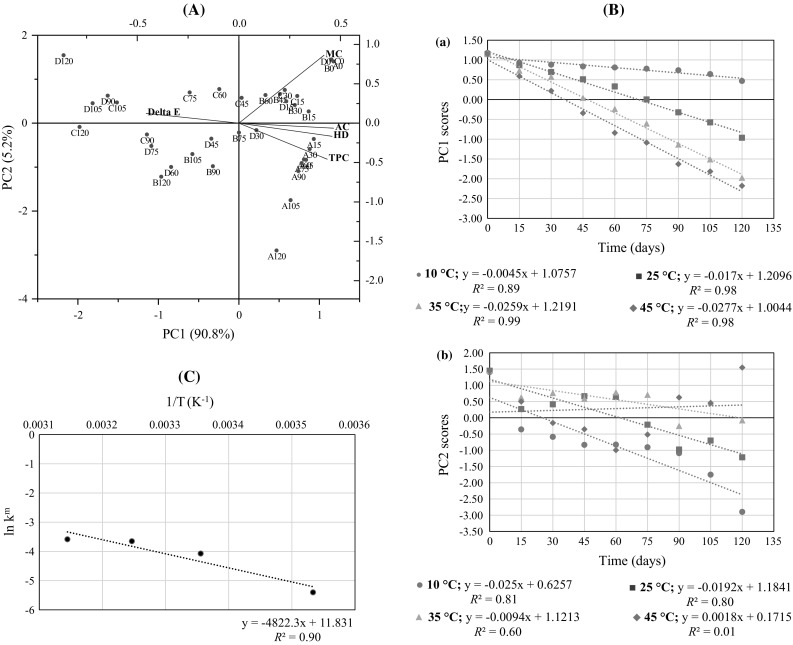
A Biplot showing the correlation between quality attributes of confection as a function of time and temperature. Samples at 10, 25, 35, and 45 °C were denoted by A, B, C, and D, respectively, and numerical values (e.g. A0) represented storage time (days). B Behavior of (a) PC1 and (b) PC2 as a function of time and temperature
Using PCA the score values of first two PCs (PC1 and PC2) were extracted for all four storage conditions (10, 25, 35, and 45 °C) and plotted against time [Fig. 3B(a, b)]. Only PC1 was found to be better structured against time (R2 > 0.85) and hence considered most suitable PC to estimate the kinetic parameters and shelf life of WJCs. As shown in Fig. 3B(a), the PC1 scores versus time were fitted to zero order kinetics with reasonable adjustments which were better than univariate kinetics (R2 = 0.90 vs. R2 ≤ 0.90). The slope of the fitted linear regression equations corresponded to km for each temperature (Table 3). The temperature dependence of km was reflected in values which progressively increased with temperature (p < 0.05) indicating the accelerated decrease in PC1 scores. The increasing trends in km and were better represented in MASLT than univariate kinetics showing the accuracy in predicting the shelf life by former than latter (Table 3). Using Arrhenius equation (Eq. 2), the Eam was estimated as 39.22 kJ/mol which could be regarded as a characteristic value considering the interactive effects of quality parameters for the stability assessment of WJCs (Fig. 3C). The multivariate cut-off criteria (tcm) was estimated by matrix multiplication of the specification vector (containing standardized cut-off values of each quality attribute basis 15% reduction in initial values) and loadings matrix of PC1. A critical PC1 score value of 0.24 was obtained as a new tcm for WJCs. Using linear regressions between PC1 scores and time (Fig. 3B(a)), a shelf life of 185, 57, 38, and 28 days were calculated at 10, 25, 35, and 45 °C, respectively, which were more reliable than univariate kinetics which suffered inconsistency in shelf lives due to large variations in the pattern of quality attributes. Considering the worst-case criteria in univariate kinetics, the AC was limiting factor affecting the stability of WJC with estimated shelf life of 175 days at 10 °C (Table 3). Although MASLT closely matched the shelf life determined by univariate kinetics, the latter may suffer under and (or) over-estimation of shelf life due to higher and (or) lower values of k and αT values. On the other hand, MASLT considered the weighing of all the quality attributes in multivariate space which gave a more realistic estimation of the shelf life of WJC.
Once the kinetic parameters were calculated for the measured quality parameters, it is important to select the appropriate αT value to estimate the shelf-life of WJCs under different market conditions. There are several approaches to tackling to understand this. For instance, the lower αT value can be taken to conduct the stability study for a longer duration. However, this approach is labor and resource intensive and leads to lag time before commercializing the product. Another approach would be to consider the highest αT value and conduct the stability study for a shorter duration. This approach could be tricky to identify which quality parameter to follow and which cut-off criteria to consider. In this study, 28 days of shelf life at 45 °C corresponds to ca. 6-months shelf-life for WJC when stored at 10 °C. Since, the overall degradation reaction followed zero-order kinetics for WJCs, the (45:10) was determined to be ca. 6 (Table 3). Therefore, to achieve a targeted shelf-life of 6 months for WJC, the future MASLT should be conducted for 1 month. The higher temperatures (> 45 °C) could be used to accelerate the stability studies, but a new would has to be determined.
Conclusion
We deployed an alternative approach to new product development (WJC) and its stability assessment guided by univariate and MASLT. WJC ingredients were guided to step-wise optimization by PCA–RSM for tailored functionalities. The optimization of HM leads to a desired template structure which mimicked the structural functionality of added sugars in sugar rich confections. The optimized quantum of JIs (JP and JSP) played the major role in furnishing the tailored hedonics and functionality (high TPC, TDFC, low GI, and anti-diabetic effects) to WJC. MASLT simplified the kinetic interpretations to a single variable (PC) by summating the valuable information from critical quality parameters affecting the WJCs degradation. It predicted the shelf life with better accuracy than univariate kinetics. It is envisaged that presented approach could be useful to product developers who struggle to define cut-off criterion for critical quality attributes by using the consolidated and tcm.
Electronic supplementary material
Below is the link to the electronic supplementary material.
Acknowledgments
The authors acknowledge the financial support from Department of Biotechnology, Government of India (Grant No. BT/FNS/01/05/2008). The in vivo GI studies carried out by Food Chemistry and Nutrition Laboratory, Defense Food Research Laboratory (Mysore), India is highly acknowledged. The authors declare no conflict of interest.
List of abbreviations
- a*
Redness
- Ea
Activation energy
- AC
Anthocyanin content
- b*
Yellownes
- CS
Cohesiveness
- db
Dry basis
- GAE
Gallic acid equivalents
- GDRI
Glucose dialysis retardation index
- GI
Glycemic
- HD
Hardness
- HM
Hydrocolloid mix
- JP
Jamun pulp
- JSP
Jamun seed powder
- k
Kinetic rate constant
- L*
Lightness
- LSD
Least significant difference
- LDPE
Low-density polyethylene
- MD
Mixture design
- MC
Moisture content
- MASLT
Multivariate accelerated shelf-life testing
Multivariate acceleration factors
- Eam
Multivariate activation energy
- tcm
Multivariate cut-off criterion
- km
Multivariate rate constants
- ANOVA
One-way analysis of variance
- PCA
Principal component analysis
- SG
Springiness
- αT
Temperature acceleration factor
- ΔE
Total color change
- TDFC
Total dietary fiber content
- TPC
Total polyphenolic content
- WJC
Whole jamun confection
References
- Ahmed F, Urooj A. Effect of Ficus racemosa stem bark on the activities of carbohydrate hydrolyzing enzymes: an in vitro study. Pharm Biol. 2010;48:518–523. doi: 10.3109/13880200903190993. [DOI] [PubMed] [Google Scholar]
- AOAC . Official methods of analysis. 19. Washington, DC: Association of Official Analytical Chemists; 2012. [Google Scholar]
- Bali S (2007) A process for the manufacture of herbal candy. Indian Patent Application No. 210,880
- Chau CF, Chen CH, Lin CY. Insoluble fiber-rich fractions derived from Averrhoa carambola: hypoglycemic effects determined by in vitro methods. LWT-Food Sci Technol. 2004;37:331–335. doi: 10.1016/j.lwt.2003.10.001. [DOI] [Google Scholar]
- Chethan S, Sreerama YN, Malleshi NG. Mode of inhibition of finger millet malt amylases by the millet phenolics. Food Chem. 2008;111:187–191. doi: 10.1016/j.foodchem.2008.03.063. [DOI] [Google Scholar]
- Chung HJ, Lim HS, Lim ST. Effect of partial gelatinization and retrogradation on the enzymatic digestion of waxy rice starch. J Cereal Sci. 2006;43:353–359. doi: 10.1016/j.jcs.2005.12.001. [DOI] [Google Scholar]
- Howlader MZH, Biswas SK. Screening for nutritionally rich and low glycemic index Bangladeshi rice varieties. Final Report CF. 2009;6:1–34. [Google Scholar]
- Karasu S, Doğan M, Toker ÖS, Caniyilmaz E. Modeling of rheological properties of mellorine mix including different oil and gum types by combined design, ANN, and ANFIS models. Turkish J Agric For. 2014;38:745–757. doi: 10.3906/tar-1312-9. [DOI] [Google Scholar]
- López G, Ros G, Rincón F, Periago MJ, Martinez MC, Ortuno J. Relationship between physical and hydration properties of soluble and insoluble fiber of artichoke. J Agric Food Chem. 1996;44:2773–2778. doi: 10.1021/jf9507699. [DOI] [Google Scholar]
- Mitchell J. Food texture and viscosity: concept and measurement. Int J Food Sci Technol. 2003;38:839–840. doi: 10.1046/j.1365-2621.2003.00667.x. [DOI] [Google Scholar]
- Pedro AM, Ferreira M. Multivariate accelerated shelf-life testing: a novel approach for determining the shelf-life of foods. J Chemometr. 2006;20:76–83. doi: 10.1002/cem.995. [DOI] [Google Scholar]
- Raju PN, Pal D. Effect of bulking agents on the quality of artificially sweetened misti dahi (caramel colored sweetened yoghurt) prepared from reduced fat buffalo milk. LWT-Food Sci Technol. 2011;44:1835–1843. doi: 10.1016/j.lwt.2011.03.010. [DOI] [Google Scholar]
- Savant VD (2010) Jelly confectionery products having a stabilizer/fiber blend. U.S. Patent Application No. 13/989, 106
- Sehwag S, Das M. Nutritive, therapeutic and processing aspects of Jamun, Syzygium cumini (L.) Skeels: an overview. Ind J Nat Prod Resour. 2014;5:295–307. [Google Scholar]
- Sehwag S, Das M. Composition and functionality of whole jamun based functional confection. J Food Sci Technol. 2016;53:2569–2579. doi: 10.1007/s13197-016-2219-7. [DOI] [PMC free article] [PubMed] [Google Scholar]
- Sehwag S, Das M. Composition and antioxidant potential of jamun (Syzygium cumini L.) from eastern India. Asian J Biochem Pharm Res. 2016;6:106–121. [Google Scholar]
- Singh JP, Kaur A, Singh N, Nim L, Shevkani K, Kaur H, Arora DS. In vitro antioxidant and antimicrobial properties of jambolan (Syzygium cumini) fruit polyphenols. LWT-Food Sci Technol. 2016;65:1025–1030. doi: 10.1016/j.lwt.2015.09.038. [DOI] [Google Scholar]
- Singh B, Singh JP, Kaur A, Singh N. Phenolic compounds as beneficial phytochemicals in pomegranate (Punica granatum L.) peel: a review. Food Chem. 2018;261:75–86. doi: 10.1016/j.foodchem.2018.04.039. [DOI] [PubMed] [Google Scholar]
- Somboon N, Karrila TT, Kaewmanee T, Karrila SJ. Properties of gels from mixed agar and fish gelatin. Int Food Res J. 2014;21:485–492. [Google Scholar]
- Upadhyay R, Mishra HN. A multivariate approach to optimise the synergistic blend of oleoresin rosemary and ascorbyl palmitate added into sunflower oil. Int J Food Sci Technol. 2015;50:974–981. doi: 10.1111/ijfs.12738. [DOI] [Google Scholar]
- Upadhyay R, Mishra HN. Multivariate analysis for kinetic modeling of oxidative stability and shelf life estimation of sunflower oil blended with sage extract under Rancimat conditions. Food Bioprocess Tech. 2015;8:801–810. doi: 10.1007/s11947-014-1446-z. [DOI] [Google Scholar]
- Upadhyay R, Mishra HN. Multivariate optimization of a synergistic blend of oleoresin sage and ascorbyl palmitate to stabilize sunflower oil. J Food Sci Technol. 2016;53:1919–1928. doi: 10.1007/s13197-015-2157-9. [DOI] [PMC free article] [PubMed] [Google Scholar]
- Upadhyay R, Nachiappan G, Mishra HN. Ultrasound-assisted extraction of flavonoids and phenolic compounds from Ocimum tenuiflorum leaves. Food Sci Biotechnol. 2015;24:1951–1958. doi: 10.1007/s10068-015-0257-y. [DOI] [Google Scholar]
Associated Data
This section collects any data citations, data availability statements, or supplementary materials included in this article.