Abstract
Background
In proteomics studies, liquid chromatography tandem mass spectrometry data (LC-MS/MS) is quantified by spectral counts or by some measure of ion abundance. Downstream comparative analysis of protein content (e.g. Venn diagrams and network analysis) typically does not include this quantitative data and critical information is often lost. To avoid loss of spectral count data in comparative proteomic analyses, it is critical to implement a tool that can rapidly retrieve this information.
Results
We developed ProSave, a free and user-friendly Java-based program that retrieves spectral count data from a curated list of proteins in a large proteomics dataset. ProSave allows for the management of LC-MS/MS datasets and rapidly retrieves spectral count information for a desired list of proteins.
Conclusions
ProSave is open source and freely available at https://github.com/MahajanLab/ProSave. The user manual, implementation notes, and description of methodology and examples are available on the site.
Keywords: ProSave, Proteomics, Java, Precision medicine
Background
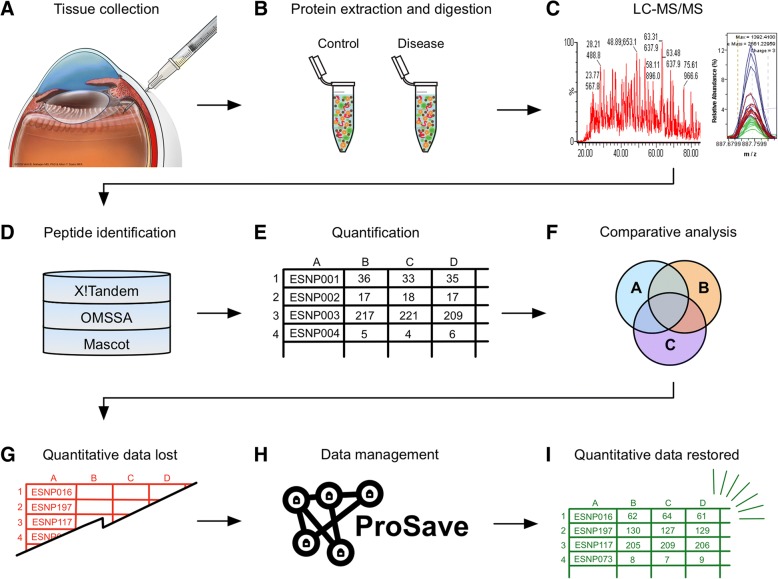
Shotgun proteomic analysis is frequently used in translational biomedical research [1–5]. Mass spectrometry-based experiments generate large amounts of data, and the complexity and volume of this data is increasing with time. One promising application of shotgun proteomics is the molecular characterization of diseased tissue samples to identify biomarkers or drug targets [6]. We have applied this method to numerous vitreoretinal diseases where there are few therapeutic options [7, 8]. Liquid biopsies (e.g. vitreous or aqueous humor) can be taken at the time of surgery (Fig. 1a) [8–10]. These liquid biopsies can then be processed and analyzed using liquid chromatography-tandem mass spectrometry (LC-MS/MS) to evaluate protein content (Fig. 1b–c) [11]. Highly-advanced algorithms can match protein IDs to the thousands of peptide mass-spectral data obtained during the experiment (Fig. 1d) [12–15]. This quantitative data is typically represented in terms of spectral counts or ion abundance (Fig. 1e). Downstream analysis, organization, and meaningful interpretation of this LC-MS/MS data remains a challenge for researchers. Identified proteins can be further categorized using Venn diagrams, gene ontology (GO) categorization, clustering analysis, molecular pathway representation, and protein interaction network analysis (Fig. 1f) [1, 16, 17]. However, these analyses frequently make use of only the protein ID lists and the quantitative data (e.g. label-free spectral counts) is often ignored (Fig. 1g). This can create issues for investigators attempting to make meaningful interpretations of these results, especially if they are unfamiliar with shell scripting or lack access to expensive bioinformatics suites (e.g. Ingenuity or Partek). To overcome this barrier, we created ProSave, a Java-based application that restores quantitative data to manipulated lists of protein IDs from larger shotgun proteomics datasets (Fig. 1h–i). ProSave is different from other currently-available bioinformatic tools: it is free, open-source, and user-friendly (as opposed to R/Bioconductor).
Fig. 1.
Informatics workflow for shotgun proteomics studies: a Liquid biopsies taken at time of surgery. b Liquid biopsies are processed for proteomic analysis. c Liquid chromatography-tandem mass-spectrometry used to analyze protein content. d Protein IDs are matched to peptide mass-spectral data. e Protein IDs and mass-spectra data are organized. f Samples (control vs. disease, etc.) are compared based on protein contents. g Quantitative data is lost during comparative analysis. h ProSave inputs original data and bare protein IDs, then outputs (i) restored protein-data pairs for trend analysis
Implementation
ProSave was developed using Java and was successfully tested on Microsoft Windows 10 and Mac OS Sierra ver.10.12.6. It was written to maintain quantitative protein data (e.g. spectral counts, protein intensity, etc.) that was otherwise lost when protein ID lists were compared between tissue samples during proteomic analysis, which excludes all numerical protein data and focuses solely on the protein IDs derived from the liquid biopsies. ProSave solves this problem and restores critical protein information lost during analysis by processing original protein data before it is manipulated by downstream comparative analysis, such as Venn diagrams or gene ontology (GO) and network analysis. ProSave is a tool that is useful beyond proteomics research. It was designed to work with any large-scale gene or protein expression analysis. Further, ProSave works with protein expression data from a variety of methods, including data obtained through data-dependent and data-independent acquisition (DDA and DIA) as well as labeled methods like iTRAQ (isobaric tag for relative and absolute quantification) and SILAC (stable isotope labeling with amino acids in cell culture).
Developer documentation
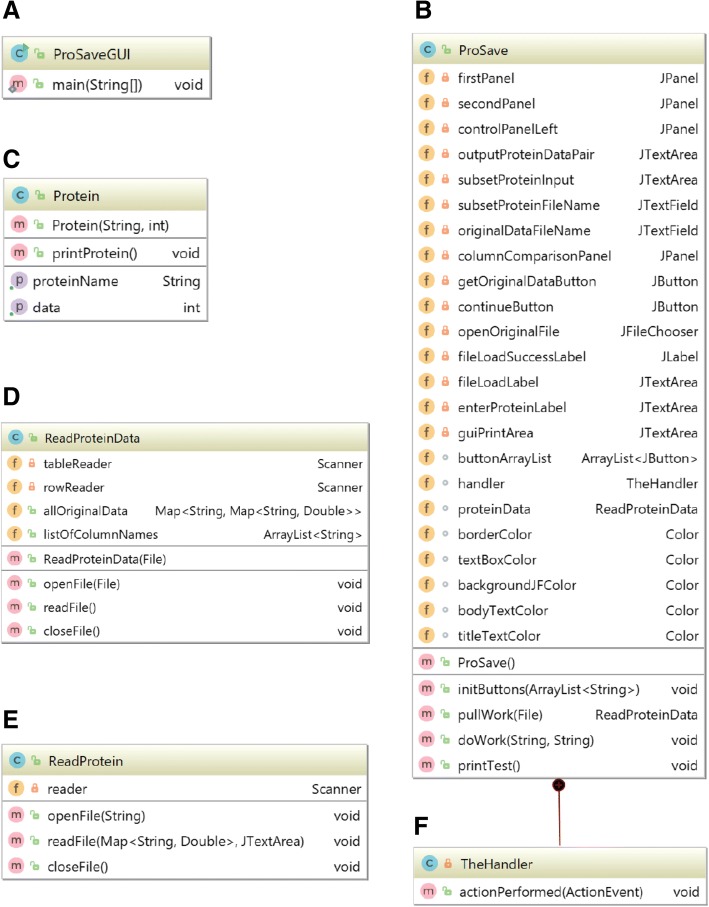
ProSave is a free, open source software available at https://github.com/MahajanLab/ProSave/. Additionally, java class files can be extracted from the ProSave.jar file for modification. The ProSaveGUI class creates the ProSave object and sets some graphical user interface (GUI) parameters (Fig. 2a). The ProSave class creates the framework and manages layout of the GUI (Fig. 2b). The Protein class is used to handle different types or amounts of data relating to each individual protein (Fig. 2c). The program processes the original data file by inserting data into a nested HashMap structure, executed by the ReadProteinData class (Fig. 2d). The ReadProtein class (Fig. 2e) uses the hashing structure for rapid data lookup. All GUI layout and interface parameters are specified in the ProSave class (Fig. 2b), which also has an internal class for event handling (Fig. 2f).
Fig. 2.
ProSave Java Class Diagram: a ProSaveGUI class creates the ProSave object and sets some GUI parameters. b The ProSave class creates the framework and manages layout of the GUI. c The Protein class stores data for a specific protein. d ReadProteinData organizes and stores original data from the file input. e The ReadProtein class organizes input proteins and retrieves data paired with each protein. f TheHandler manages actions of programs in response to user events on GUI
User documentation
ProSave has been designed to be applied as a tool for any large-scale gene or protein expression investigation. Below are steps on how to use ProSave on any compatible data set:
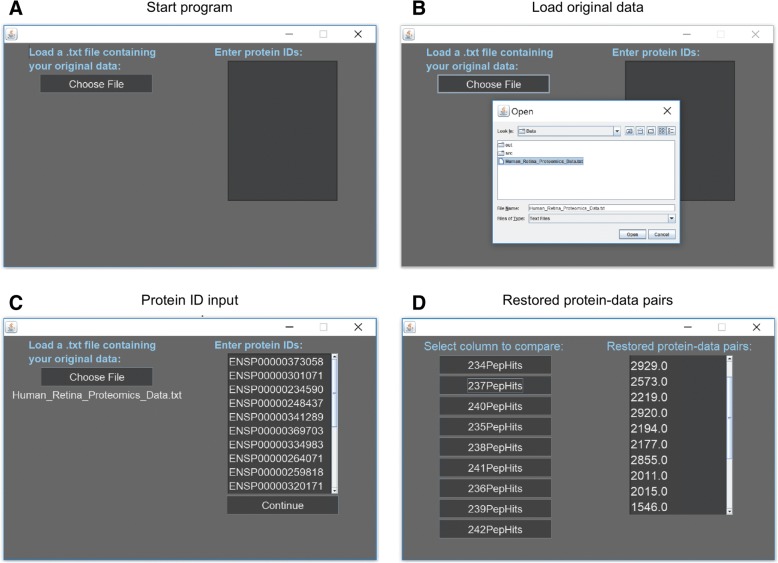
Step 1: Download ProSave.jar from https://github.com/MahajanLab/ProSave/ and run ProSave by opening the downloaded file (Fig. 3a). Additionally, download Java if it is not already downloaded.
Step 2: Make a .txt with the original data. To do this from Excel go to File>Export>Change File Type>Text>Save. Once ProSave opens, click ‘Choose File’ to add the .txt file of the original data. For proper function, insure all columns have one-word names and text begins on first row of the .txt file (Fig. 3b).
Step 3: Enter a list of protein IDs in the textbox labeled ‘Enter protein IDs’, then click ‘Continue’ (Fig. 3c).
Step 4: Click the button labels with the name of the column of data corresponding to the tissue for comparison.
Step 5: Get restored data from the text box labeled ‘Restored protein-data pairs’ (Fig. 3d).
Fig. 3.
User documentation: a ProSave upon starting program. b Load original data by clicking ‘Choose File’ and selecting the file by browsing the file explorer. c Input of proteins which need data restored. d On left, tissues for comparison from original data, and on right, restored protein data from specified tissue in order of protein ID input
Results
Case study
We tested ProSave on a comparative proteomics dataset of anatomical regions of the human retina: the peripheral retina, juxta-macular, and foveomacular regions [18]. LC-MS/MS was performed on retinal punch biopsies using an LTQ Velos and data were acquired using the DDA acquisition method as previously described. [18, 19] We identified 1,779 ± 51 individual proteins in the peripheral retina, 1,999 ± 46 individual proteins juxta-macular region, and 1,974 ± 92 individual proteins in the foveomacular region. Data were organized and analyzed using comparative analyses (e.g. Venn diagrams, differential protein expression, pathway representation, etc.). Protein ID lists from each tissue sample were compared using Venn diagrams to identify shared and unique proteins among the different regions of the retina. This analysis identified 1,354 proteins shared among the three retinal regions. After this comparison, however, only protein IDs remained, and the protein expression levels were not available for interpretation. Using ProSave, spectral count data was restored to this list of 1,354 proteins and we were able to ascertain the most abundant proteins shared among the three groups: alpha- and gamma-enolase, tubulin, pyruvate kinase, creatine kinase b-type, vimentin, glyceraldehyde-3-phosphate dehydrogenase, and histone H2B (types 1-D and G) [18]. A similar approach was used to gather information on the most abundant proteins unique to each anatomical region [18].
Without protein abundance data, insights into significant similarities or differences in retinal tissue protein expression are ambiguous. To avoid such data loss, one could attempt the tedious and time-consuming task of interrogating the original dataset to restore quantitative data for each protein of interest. Instead, ProSave accomplishes the same task in a matter of seconds instead of hours or days. We applied ProSave to our shared and unique protein lists to restore spectral count data. This gave us insight into which proteins were most and least abundant, thus allowing us to increase our understanding of targeted tissues.
Conclusions
In conclusion, ProSave is a free and user-friendly tool to restore quantitative data to manipulated subsets of protein IDs during analysis of proteomic data. It speeds up the workflow for proteomic bioinformatics and makes for meaningful interpretation of comparative data. We anticipate that ProSave will be a useful tool to simplify processing and analysis of translational proteomics data. Such a program could even be applied to other gene/protein expression platforms where comparative analyses make use of only gene/protein IDs (e.g. RNA-seq, microarrays, ELISA).
Availability and requirements
Project name: ProSave
Project home page: https://github.com/MahajanLab/ProSave
Operating system(s): Platform independent
Programming language: Java
Other requirements: None
License: GNU
Any restrictions to use by non-academics: None
Acknowledgements
None.
Funding
VBM and AGB are supported by NIH grants [R01EY026682, R01EY024665, R01EY025225, R01EY024698, R21AG050437, and P30EY026877], VBM is also supported by the Doris Duke Charitable Foundation Grant #2013103, and Research to Prevent Blindness (RPB), New York, NY. GV is supported by NIH grants [F30EYE027986 and T32GM007337].
Availability of data and materials
The datasets generated during and/or analyzed during the current study are available from the corresponding author on reasonable request.
Financial Disclosure
None
Abbreviations
- DDA
Data-dependent acquisition
- DIA
Data-independent acquisition
- GO
Gene ontology
- GUI
Graphical user interface
- iTRAQ
Isobaric tag for relative and absolute quantification
- LC-MS/MS
Liquid chromatography-tandem mass spectrometry
- SILAC
Stable isotope labeling with amino acids in cell culture
Authors’ contributions
Dr. VBM had full access to all the data in the study and takes responsibility for the integrity of the data and the accuracy of the data analysis. DAM, GV, AGB, and VBM initiated the idea of the tool and conceived the project. DAM and GV designed the tool and analyzed the data. DAM and GV tested the tool. DAM, GV, AGB, and VBM wrote the paper. All authors read and approved the final manuscript. VBM and AGB obtained funding. VBM provided administrative, technical, and material support.
Ethics approval and consent to participate
Not applicable.
Consent for publication
Not applicable.
Competing interests
The authors declare that they have no competing interests.
Publisher’s Note
Springer Nature remains neutral with regard to jurisdictional claims in published maps and institutional affiliations.
Contributor Information
Daniel A. Machlab, Email: daniel@hadlim.com
Gabriel Velez, Email: velez.gabriel1@gmail.com.
Alexander G. Bassuk, Email: abassuk@gmail.com
Vinit B. Mahajan, Phone: 650.723.6995, Email: vinit.mahajan@stanford.edu
References
- 1.Mahajan VB, Skeie JM. Translational vitreous proteomics. Proteomics Clin Appl. 2014;8(3–4):204–208. doi: 10.1002/prca.201300062. [DOI] [PMC free article] [PubMed] [Google Scholar]
- 2.Duarte TT, Spencer CT. Personalized proteomics: the future of precision medicine. Proteomes. 2016;4(4):29. doi: 10.3390/proteomes4040029. [DOI] [PMC free article] [PubMed] [Google Scholar]
- 3.Skeie JM, Roybal CN, Mahajan VB. Proteomic insight into the molecular function of the vitreous. PLoS One. 2015;10(5):e0127567. doi: 10.1371/journal.pone.0127567. [DOI] [PMC free article] [PubMed] [Google Scholar]
- 4.Skeie JM, Mahajan VB. Proteomic landscape of the human choroid-retinal pigment epithelial complex. JAMA Ophthalmol. 2014;132(11):1271–1281. doi: 10.1001/jamaophthalmol.2014.2065. [DOI] [PubMed] [Google Scholar]
- 5.Skeie JM, Mahajan VB. Proteomic interactions in the mouse vitreous-retina complex. PLoS One. 2013;8(11):e82140. doi: 10.1371/journal.pone.0082140. [DOI] [PMC free article] [PubMed] [Google Scholar]
- 6.Velez G, Tang PH, Cabral T, Cho GY, Machlab DA, Tsang SH, Bassuk AG, Mahajan VB. Personalized proteomics for precision health: identifying biomarkers of vitreoretinal disease. Trans Vis Sci Tech. 2018;7(5):12. doi: 10.1167/tvst.7.5.12. [DOI] [PMC free article] [PubMed] [Google Scholar]
- 7.Velez G, Bassuk AG, Colgan D, Tsang SH, Mahajan VB. Therapeutic drug repositioning using personalized proteomics of liquid biopsies. JCI Insight. 2017;2(24):e97818. doi: 10.1172/jci.insight.97818. [DOI] [PMC free article] [PubMed] [Google Scholar]
- 8.Velez G, Roybal CN, Colgan D, Tsang SH, Bassuk AG, Mahajan VB. Precision medicine: personalized proteomics for the diagnosis and treatment of idiopathic inflammatory disease. JAMA Ophthalmol. 2016;134(4):444–448. doi: 10.1001/jamaophthalmol.2015.5934. [DOI] [PMC free article] [PubMed] [Google Scholar]
- 9.Velez G, Roybal CN, Binkley E, Bassuk AG, Tsang SH, Mahajan VB. Proteomic analysis of elevated intraocular pressure with retinal detachment. Am J Ophthalmol Case Rep. 2017;5:107–110. doi: 10.1016/j.ajoc.2016.12.023. [DOI] [PMC free article] [PubMed] [Google Scholar]
- 10.Skeie JM, Brown EN, Martinez HD, Russell SR, Birkholz ES, Folk JC, Boldt HC, Gehrs KM, Stone EM, Wright ME, et al. Proteomic analysis of vitreous biopsy techniques. Retina. 2012;32(10):2141–2149. doi: 10.1097/IAE.0b013e3182562017. [DOI] [PMC free article] [PubMed] [Google Scholar]
- 11.Skeie JM, Tsang SH, Zande RV, Fickbohm MM, Shah SS, Vallone JG, Mahajan VB. A biorepository for ophthalmic surgical specimens. Proteomics Clin Appl. 2014;8(3–4):209–217. doi: 10.1002/prca.201300043. [DOI] [PMC free article] [PubMed] [Google Scholar]
- 12.Geer LY, Markey SP, Kowalak JA, Wagner L, Xu M, Maynard DM, Yang X, Shi W, Bryant SH. Open mass spectrometry search algorithm. J Proteome Res. 2004;3(5):958–964. doi: 10.1021/pr0499491. [DOI] [PubMed] [Google Scholar]
- 13.Bjornson RD, Carriero NJ, Colangelo C, Shifman M, Cheung KH, Miller PL, Williams K. X!!Tandem, an improved method for running X!Tandem in parallel on collections of commodity computers. J Proteome Res. 2008;7(1):293–299. doi: 10.1021/pr0701198. [DOI] [PMC free article] [PubMed] [Google Scholar]
- 14.Yen CY, Meyer-Arendt K, Eichelberger B, Sun S, Houel S, Old WM, Knight R, Ahn NG, Hunter LE, Resing KA. A simulated MS/MS library for spectrum-to-spectrum searching in large scale identification of proteins. Mol Cell Proteomics. 2009;8(4):857–869. doi: 10.1074/mcp.M800384-MCP200. [DOI] [PMC free article] [PubMed] [Google Scholar]
- 15.Perkins DN, Pappin DJ, Creasy DM, Cottrell JS. Probability-based protein identification by searching sequence databases using mass spectrometry data. Electrophoresis. 1999;20(18):3551–3567. doi: 10.1002/(SICI)1522-2683(19991201)20:18<3551::AID-ELPS3551>3.0.CO;2-2. [DOI] [PubMed] [Google Scholar]
- 16.Thomas PD, Campbell MJ, Kejariwal A, Mi H, Karlak B, Daverman R, Diemer K, Muruganujan A, Narechania A. PANTHER: a library of protein families and subfamilies indexed by function. Genome Res. 2003;13(9):2129–2141. doi: 10.1101/gr.772403. [DOI] [PMC free article] [PubMed] [Google Scholar]
- 17.Szklarczyk D, Morris JH, Cook H, Kuhn M, Wyder S, Simonovic M, Santos A, Doncheva NT, Roth A, Bork P, et al. The STRING database in 2017: quality-controlled protein-protein association networks, made broadly accessible. Nucleic Acids Res. 2017;45(D1):D362–D368. doi: 10.1093/nar/gkw937. [DOI] [PMC free article] [PubMed] [Google Scholar]
- 18.Velez G, Machlab DA, Tang PH, Sun Y, Tsang SH, Bassuk AG, Mahajan VB. Proteomic analysis of the human retina reveals region-specific susceptibilities to metabolic- and oxidative stress-related diseases. PLoS One. 2018;13(2):e0193250. doi: 10.1371/journal.pone.0193250. [DOI] [PMC free article] [PubMed] [Google Scholar]
- 19.Cabral T, Toral MA, Velez G, DiCarlo JE, Gore AM, Mahajan M, Tsang SH, Bassuk AG, Mahajan VB. Dissection of human retina and RPE-choroid for proteomic analysis. J Vis Exp. 2017;(129). 10.3791/56203. [DOI] [PMC free article] [PubMed]
Associated Data
This section collects any data citations, data availability statements, or supplementary materials included in this article.
Data Availability Statement
The datasets generated during and/or analyzed during the current study are available from the corresponding author on reasonable request.


