

Abstract
The global epidemic of drug resistant tuberculosis is a catastrophic example of how antimicrobial resistance is undermining the public health gains made possible by combination drug therapy. Recent evidence points to unappreciated bacterial factors that accelerate the emergence of drug resistance. In a genome-wide association study of Mycobacterium tuberculosis isolates from China, we find mutations in the transcription factor prpR enriched in drug resistant strains. PrpR mutations confer conditional drug tolerance to three of the most effective classes of antibiotics by altering propionyl-CoA metabolism. PrpR-mediated drug tolerance is carbon-source dependent, and while readily detectible during infection of human macrophages, is not captured by standard susceptibility testing. These data define a previously unrecognized and clinically prevalent class of M. tuberculosis variants that undermine antibiotic efficacy and drive drug resistance.
Introduction
The incidence of multidrug resistant tuberculosis (MDR-TB, a term that denotes combined resistance to the potent first-line drugs, isoniazid and rifampin) has increased to an estimated 490,000 cases annually even though the multi-drug regimens used to treat tuberculosis are specifically designed to suppress the emergence of drug resistance1. The recognized risk factors for acquired drug resistance and treatment failure more generally are the use of inappropriate antibiotic regimens2 and patient non-adherence3,4. However, even when patients are treated in clinical trial settings, with carefully administered antibiotic regimens that reflect the best available phenotypic and genotypic predictions of drug susceptibility, failures still occur in 5–10% of tuberculosis cases5–7.
In most bacterial pathogens, including Mycobacterium tuberculosis, antibiotic resistance is defined through growth-based resistance assays or their genetic proxies. However, these assays fail to capture more complex alterations in drug susceptibility that may contribute to the emergence of de novo drug resistance and treatment failure even in the absence of resistance as it is conventionally measured. Recent in vitro evolution studies in E. coli have identified mutations that slow bacterial killing during antibiotic treatment without an increase in the minimum inhibitory concentration (MIC) 8,9. Alterations in bacterial killing can be broadly placed into two categories that can be distinguished by their kill kinetics: population-wide tolerance, where all cells are more refractory to killing, or increased production of rare, highly tolerant persister cells, where the bulk of the population remains fully susceptible10. Persister cells are thought to be protected from killing by decreased dependence on antibiotic targets essential for growth-related processes11.
Clinical isolates of the pathogens Pseudomonas aeruginosa and Candida albicans with increased production of persister cells have been identified, suggesting that this phenotype can emerge during treatment12,13. In M. tuberculosis persister cells have been postulated to contribute to the long duration of antibiotic therapy required to treat infection14,15. In vitro studies in M. tuberculosis and other prokaryotes have also identified forms of drug tolerance including blunted drug efficacy due to population-wide slow growth states in specific conditions16,17, and conditional drug efflux18. Furthermore, bacterial mutants have been isolated in laboratory studies that are specifically drug tolerant in vivo but drug susceptible in vitro; however, the mechanism(s) of in vivo drug tolerance has not been defined19. Importantly, studies in E. coli have shown that persistence and tolerance mutations can accelerate the subsequent emergence of drug resistance20,21.
In an effort to identify variants altering antibiotic susceptibility in natural populations of M. tuberculosis, we undertook a genome wide association study of clinical isolates, correlating mutations with drug resistance. We identify several loci associated with resistance and demonstrate that variants in the bacterial transcription factor prpR confer conditional multi-drug tolerance.
Results
Genetic variants associated with drug resistant tuberculosis in China
To identify clinically-relevant bacterial variants altering antibiotic efficacy in M. tuberculosis, we performed a bacterial genome-wide association analysis in strains isolated from tuberculosis patients. Antibiotic tolerance is not measured clinically but may serve as a stepping-stone to the evolution of resistance21. We therefore reasoned that associations with drug resistance should also capture tolerance mutations that increase the probability a strain will subsequently develop resistance. To perform this analysis, we leveraged a strain collection assembled during the 2007 national survey of drug-resistant TB in China22. In this study, ~4000 strains were collected from across China and resistance was measured for six first and second line antibiotics. A subset of 549 strains was selected for whole genome sequencing including all isoniazid resistant and MDR strains and a geographically matched set of drug susceptible strains (Figure 1A, Supplementary Table 1).
Figure 1.
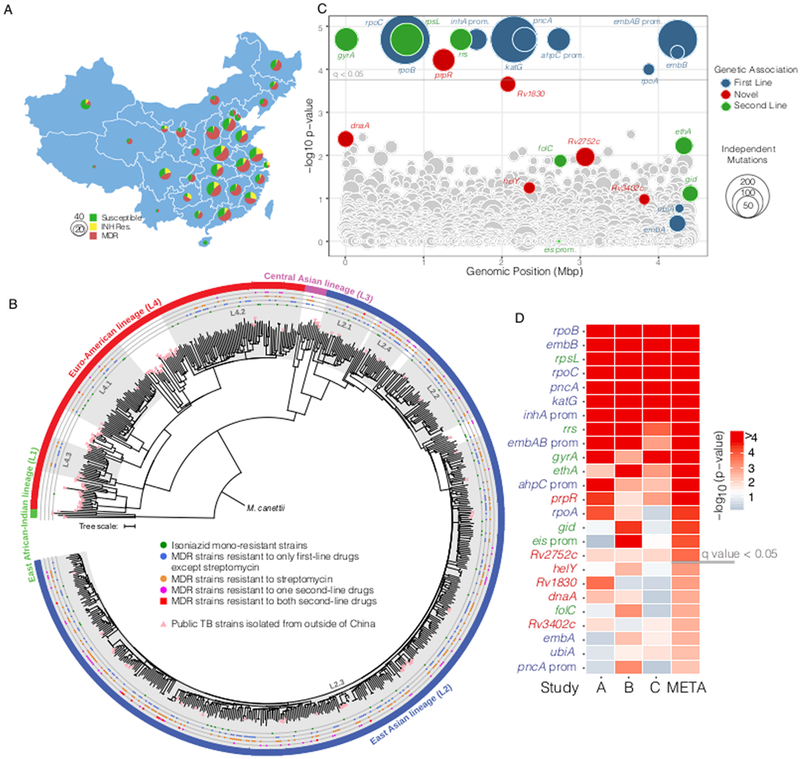
Genetic associations with isoniazid resistance (A) Geographic distribution of sequenced TB strains. (B) Maximum-likelihood tree of 679 M. tuberculosis isolates based on 59,367 genome-wide SNP sites. A strain of M. canetti was used as the outgroup. Known lineages are marked outside of the tree. Sub-lineages of China strains within L2 and L4 are highlighted with background shadows (names followed as previously described by Zhang et al.) (C) Genetic associations with isoniazid resistance among 549 strains from China. Each circle represents a gene or intergenic-region in the M. tuberculosis genome. The y-axis represents uncorrected phyOverlap p-values; genes above the gray line are genome-wide significant with q < 0.05 after correction with the Benjamini-Hochberg procedure. Colors denote loci known to contribute to resistance and sizes correspond to the number of times mutations were acquired across the dataset based on parsimony. (D) Comparison of genes identified in our sequence collection (Study A, 549 strains) with those identified using the same method on strain collections from Walker et al. (Study B, 784 strains) and Zhang et al. (Study C, 161 strains). Genes are sorted by significance after performing a meta-analysis of the phyOverlap p-values using Fisher’s method and correction with the Benjamini-Hochberg procedure. Genes above the gray line are genome-wide significant in the meta-analysis with q < 0.05.
To define the phylogenetic structure of M. tuberculosis in China, we performed whole-genome sequencing and identified SNPs by comparing each strain with the lab strain H37Rv (Supplementary Table 1). The phylogenetic structure of M. tuberculosis in our cohort is broadly consistent with published phylogenies23,24 (Figure 1B, Supplementary Figure 1). As expected, drug resistant M. tuberculosis in China is dominated by lineage 2 strains accounting for 81% of drug resistant isolates, the majority of which are part of sub-lineage L2.3 (also known as “modern” Beijing). Chinese lineage 4 strains comprise 18% of drug resistant isolates and form three distinct groups, which are generally private to China as assessed by the distribution of publicly available M. tuberculosis genomes from other geographic locations (Figure 1B, Supplementary Table 2). A genetic distance-based cluster analysis demonstrated that ~90% of isoniazid resistant isolates in this sample reflect independent acquisitions of drug resistance (Supplementary Figure 2). Because the existing collections of sequenced drug resistant M. tuberculosis are frequently dominated by epidemic clones25,26, this is a uniquely robust cohort for the identification of bacterial factors driving the acquisition of drug resistance.
To detect genetic associations in the context of the completely clonal M. tuberculosis population structure, we identified mutations occurring in isoniazid resistant isolates more often than would be expected by chance based on phylogenetic convergence at a gene-wide level27, using an algorithm which we termed phyOverlap. Isoniazid resistance typically arises first in the progression to MDR28 and second line drugs are only used in the context of preexisting MDR, leading to programmatic linkage among drug resistance phenotypes (Supplementary Table 3). Thus, by performing an association with isoniazid resistance, we expected to capture mutations altering the efficacy of multiple clinically utilized antibiotics.
From this analysis, we identified 13 genes and inter-genic regions that are significantly (q<0.05) associated with isoniazid resistance (Figure 1C, Supplementary Table 4). The associations with the highest significance included the well-established isoniazid resistance determining genes and regulatory regions (katG, inhA promoter, and ahpC promoter mutations). As expected, known resistance determining and compensatory mutations for other first and second line antibiotics are also significantly associated with isoniazid resistance, reflecting the multiple resistances present in many MDR isolates. Among these high-confidence associations, an association was identified with prpR or Rv1129c (q=0.018) for which there is no known mechanistic basis for the coincidence of mutations and drug resistance.
Convergence-based phyOverlap analysis of two additional publicly available datasets from a Chinese cohort29 and mixed UK/African cohort30 (Supplementary Tables 5,6), as well as a meta-analysis of all three datasets, independently supported the association between prpR and isoniazid resistance (Figure 1D). The meta-analysis also identified several additional known DR-associated loci, including ethA, gid, and the eis promoter. The most significant association in this analysis for which a mechanistic basis is unknown is Rv2752c, encoding a potentially bifunctional protein which has been demonstrated to have both RNase J-like activity as well as beta-lactamase activity31,32, and which frequently contains non-sense or INDEL mutations presumably abolishing function. Four additional genes were identified which failed to meet the corrected genome-wide significance threshold, however they were nested within four known resistance-associated loci (Figure 1D). These genes include helY (Rv2092c) and dnaA, both implicated in DNA replication and repair; Rv3402c, which encodes a conserved hypothetical protein; and Rv1830, which encodes another putative transcription factor (Figure 1D).
The distribution of prpR mutations in global MTB populations
Although prpR mutants are strongly associated with drug resistance in our analysis, only a single previous genomic study, also performed using Chinese isolates, has implicated prpR with resistance29. To gain a broader context for the incidence of prpR mutation among clinical isolates, we assessed the frequency of prpR mutants within the three datasets included in Figure 1D as well as in three additional large genomic datasets from other regions of the world33–35. In these three additional global datasets, we additionally performed targeted genetic analysis to measure the association between prpR mutations and mutations in katG and the inhA promoter regions as a proxy for isoniazid resistance (Table 1). Overall the occurrence of prpR mutants in samples derived from outside China is markedly lower, representing just 2–3% of isolates overall as compared with 8–10% in Chinese isolates. In all datasets except for Casali et al34 from Russia, the uncorrected frequency of prpR mutations is higher in the drug resistant isolates than drug susceptible isolates. After correcting for phylogenetic structure as described above, prpR mutations are significantly associated with drug resistance in all datasets except the Malawian cohort, which has relatively little drug resistance overall. The discrepancies in the Russian and Malawian cohorts likely reflect the effects of clonal drug resistant outbreaks, which strongly skew the frequency estimates.
Table 1.
The frequency of prpR mutants among publicly available datasets and their association with isoniazid resistance
| Location | Sample Size |
Resistant | Sensitive | Total prpR mutants |
% prpR mutation |
% R - prpR mutation uncorrected |
% S - prpR mutation uncorrected |
phyOverlap p- value |
|
|---|---|---|---|---|---|---|---|---|---|
| Current Study | China | 549 | 349 | 200 | 55 | 10 | 12.9 | 5 | 0.00004 |
| Zhang29 | China | 161 | 117 | 44 | 13 | 8.1 | 11.1 | 0 | 0.0012 |
| Walker30 | Africa/UK | 784 | 415 | 396 | 16 | 2 | 3.1 | 0.8 | 0.015 |
| Casali34 | Russia | 1253 | 756* | 497* | 28 | 2.2 | 2.2 | 2.2 | 0.007 |
| Guerra-Assunção 33 | Malawi | 1847 | 147* | 1700* | 54 | 2.9 | 8.8 | 2.4 | 0.089 |
| Holt35 | Vietnam | 1635 | 436* | 1199* | 43 | 2.6 | 5 | 1.7 | 0.00152 |
Resistant and sensitive are designated using mutations within katG or the inhA promoter as a proxy for resistance
Functional characterization of clinical prpR mutations
PrpR has no previously known role in resistance to any antibiotic, although in an observational study examining the treatment of a single MDR patient over time, a prpR mutant was driven to near fixation while the patient was treated with a second-line drug regimen36. Based on parsimony analysis, the phylogenetic distribution of prpR mutants display convergent evolution of particular SNPs indicative of positive selection (Figure 2A, Supplementary Table 7). Although prpR mutations are significantly enriched in drug resistant isolates, mutations including those identified as convergent also occur in 5% (10/200) of pan-susceptible isolates (Figure 2B), suggesting they do not directly cause drug resistance in standard culture conditions.
Figure 2.

Distribution and functional characterization of prpR mutants. (A) Vertical lines represent prpR mutations identified. Red sites are found exclusively in INH resistant isolates, blue sites are found exclusively in INH sensitive isolates, and purple are found in both. Positions showing convergent evolution are depicted with each instance of mutation to an alternate amino acid. (B) The distribution of prpR mutants in isoniazid sensitive and resistant isolates (C) Schematic depicting the metabolism of propionyl-CoA through the methylcitrate cycle and the B12-dependent methylmalonyl-CoA pathway. (D and E) Bacterial growth as measured by OD600 in 7H12 media supplemented with 0.02% acetate (D) or 0.02% propionate (E). (F) Relative fold-change in expression of prpD in indicated media at two days post-exposure. Data plotted is the mean and standard deviation of three biological replicates. ** indicates differences in expression among strains of p < 0.001 by Tukey’s multiple comparisons test after one-way ANOVA.
We therefore sought to define the basis of the association between prpR mutations and drug resistance. PrpR is a transcription factor that is divergently transcribed from the prpDC operon in M. tuberculosis. PrpD and prpC encode proteins that mediate the first two steps in the methylcitrate cycle (MCC), which converts propionyl-CoA into pyruvate (Figure 2C). Upon exposure to propionate, or propionyl-CoA generating carbon sources such as cholesterol, which is essential for M. tuberculosis growth in vivo37, prpDC is strongly upregulated in a prpR-dependent fashion38,39. Deletion mutants of either prpDC or prpR, which are deficient in MCC activity, are unable to grow in medium containing cholesterol or propionate either as a sole carbon source or as components of mixed carbon sources, perhaps due to accumulation of unmetabolized propionyl-CoA40.
To directly assess the functional consequence of the identified prpR mutations, we constructed an isogenic panel of prpR SNP mutants by complementing a prpR deletion in the laboratory strain H37Rv with a chromosomally integrated copy of prpR containing either the wildtype sequence, three common point mutations identified by our analysis, or an empty vector. In liquid media containing acetate and glycerol as carbon sources, all strains grew at similar rates (Figure 2D). However, in media containing propionate and glycerol, ΔprpR::vector was strongly attenuated for growth while ΔprpR::D160G and ΔprpR::G361C demonstrated an extended lag phase before resuming growth approximately 6 days after exposure. In contrast, the deletion mutant complemented with wildtype prpR or E135G grew at the same rate as H37Rv (Figure 2E). Consistent with these observations, prpD upregulation in response to propionate exposure was completely abrogated in the ΔprpR::vector strain and highly attenuated in strains expressing the D160G and G361C variants (Figure 2F). We considered the possibility that the late growth of the D160G and G361C variants reflected the outgrowth of suppressor mutants, however when bacteria from propionate containing media were recovered in standard 7H9 media and then re-exposed to propionate, they remained sensitive to propionate, exhibiting the same extended lag in growth (Supplementary Figure 3) Taken together, these data demonstrate that at least a subset of common prpR mutants are hypomorphic for MCC activity and have altered growth characteristics in propionate containing media.
PrpR mutants exhibit conditional drug tolerance in vitro
We then assessed the effect of prpR mutations on both resistance and tolerance to isoniazid, rifampin, and the second-line fluoroquinolone ofloxacin. Although propionate supplementation itself unexpectedly increased rifampin resistance in all strains, the antibiotic-dependent inhibition of growth in prpR mutants did not differ from wildtype M. tuberculosis for any drug regardless of the presence of propionate (Figure 3A-C). To determine the impact of prpR mutations on drug tolerance, we performed time-dependent killing assays on strains after two days of exposure to acetate or propionate, when differences in growth kinetics were apparent. We tagged each prpR variant strain with a unique molecular barcode, allowing us to combine all strains into a single pool. During antibiotic treatment we then followed the survival of each strain by measuring the total pool CFU and accounting for the relative abundance of each strain by deep sequencing of the surviving population recovered on drug-free media.
Figure 3.
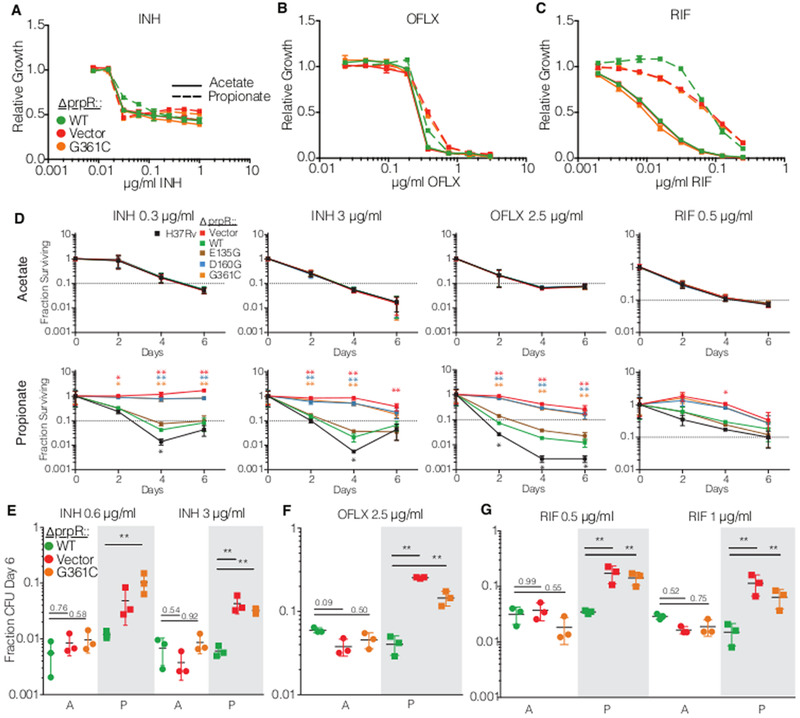
PrpR mutants display conditional multidrug tolerance. (a-c) Drug resistance measurement of growth in varying concentrations of antibiotic normalized to a no drug control for in (a) isoniazid (INH), (b) ofloxacin (OFLX) and (c) rifampin (RIF). The experiment was performed three times with similar results. (d) Survival of prpR mutants in a library of strains over time in the indicated antibiotic and media conditions. Fraction survival represents bulk library CFU divided into strain CFU by relative abundance measurement. Each point represents the mean and standard deviation of three independent measurements. (e-g) Bacterial survival after six days of treatment in single strain assays with (e) isoniazid (INH), (f) ofloxacin (OFLX) and (g) rifampin (RIF) in media with acetate (clear background marked with A) or propionate (shaded background marked with P). Each dot represents the fraction of bacteria surviving six days of antibiotic treatment in a biological replicate with the mean and standard deviation indicated with bars. N=3 for each strain in each condition. * p < 0.05 and ** p < 0.01 indicate differences in log-transformed survival determined by Tukey’s multiple comparison test after two-way ANOVA.
In medium supplemented with acetate, all strains were killed to a similar extent by all antibiotics tested. In contrast, in medium supplemented with propionate ΔprpR::vector, ΔprpR::D160G, and ΔprpR::G361C were significantly more drug tolerant than ΔprpR::WT, showing dramatically increased survival and delayed killing during isoniazid and ofloxacin treatment (Figure 3D). To distinguish between altered killing due to population drug tolerance versus increased persister formation, we estimated the time to for a given drug to kill 90% of bacteria. This metric, known as the minimum duration of killing (MDK90), has been proposed as a way of formally discriminating between population wide drug tolerance and increased persister formation10. The MDK90 for H37Rv and ΔprpR::WT in propionate is 2–3 days in isoniazid and 1–2 days in ofloxacin, while the MDK90 for ΔprpR::vector, ΔprpR::D160G, and ΔprpR::G361C are >6 days in each case. The prolonged MDK90 indicates population wide drug tolerance and is consistent with visual inspection of the curves, where prpR mutants display slower overall killing kinetics rather than a higher plateau of persister cells. Similarly, prpR mutants were also more tolerant of rifampin; however, the survival advantage was more modest, potentially reflecting the dampened killing of even the wild-type strains at this dose of rifampin in propionate. Under our assay conditions, the prpR mutants were eventually killed by high doses of isoniazid and ofloxacin at late time points that largely coincided with resumed growth in the no drug controls (Supplementary Figure 4).
To confirm the findings of these competition-based assays, we performed single-strain antibiotic killing assays measuring the survival of a subset of strains at 6 days post-treatment. As in the competition assays, ΔprpR::vector and ΔprpR::G361C had significantly increased survival in isoniazid and ofloxacin treatment in a propionate-dependent manner (Figure 3 E-G). Single-strain analysis also demonstrated increased survival of prpR mutants during rifampin treatment.
PrpR mutations increase drug tolerance during human macrophage infection
We next measured the effects of the prpR mutations on drug susceptibility during M. tuberculosis infection. Previously published data demonstrated that prpR and prpDC are essential for normal growth of M. tuberculosis in macrophages38, however the MCC is dispensable for bacterial growth in mice40, perhaps as a result of known differences between mouse and human tissues in the availability of vitamin B1241, which activates a MCC bypass pathway (Figure 2C). Recognizing the limitations of each model, we assessed the effects of the prpR mutations on drug efficacy in mice and in human-derived macrophages. Consistent with published data, the prpR mutants did not have a fitness defect in mice and did not alter drug efficacy (Supplementary Figure 5). In primary human macrophages in the absence of drug treatment, the prpR mutants had modest but significant decreases in fitness when compared with ΔprpR::WT (Figure 4A). Strikingly, however, when infected macrophages were treated with isoniazid, ofloxacin or rifampin, at concentrations far above the MIC, the survival of the prpR mutants was significantly greater than that of ΔprpR::WT (Figure 4B-D). Note that ΔprpR::WT was slightly more drug tolerant than H37Rv, likely reflecting incomplete complementation of the prpR deletion. Even the E135G prpR mutation, which had little discernable effect during in vitro functional testing, was modestly but consistently more drug tolerant than ΔprpR::WT in human macrophages treated with isoniazid and rifampin (Figure 4B,D). All of the prpR mutants were similarly more tolerant of all three antibiotics in the human-derived macrophage-like THP-1 cell line (Figure 4E).
Figure 4.
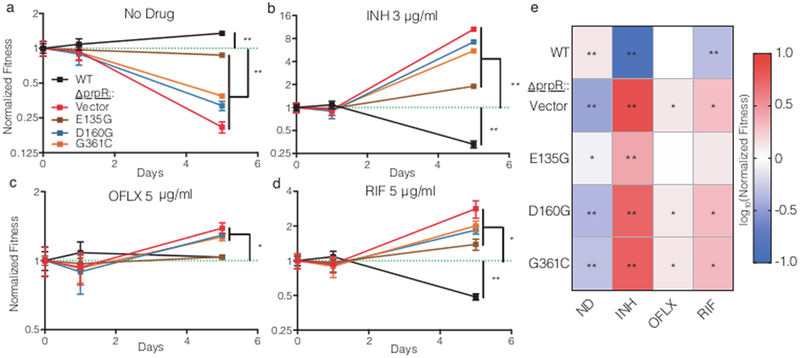
The normalized fitness of indicated strains compared with ΔprpR::WT during antibiotic treatment in human peripheral blood mononuclear cell derived macrophages treated with (a) no antibiotic (ND), (b) isoniazid (INH) at 3 μg/ml, (c)ofloxacin (OFLX) at 2.5 μg/ml, or (d) rifampin (RIF) at 5 μg/ml. The dotted green line indicates ΔprpR::WT which is set to 1 at each timepoint. The mean and standard deviation of three replicates are shown. e) The mean normalized end-point fitness of strains after three days of antibiotic treatment in THP-1 cells (n=3 per treatment). Differences in survival compared with ΔprpR::WT (fitness = 1) were evaluated by one-sample t test, with two-tailed p-values indicated by * p < 0.05 and ** p < 0.01 after FDR correction.
PrpR tolerance depends on propionyl-CoA intoxication
Although the best-defined role of prpR is regulation of prpC and prpD expression, prpR has been implicated in activation of icl-1, which mediates the conversion of methylisocitrate to succinate and pyruvate in the MCC, and ramB which is itself a repressor of icl-1 expression in some conditions42. PrpR has also been proposed to have additional regulatory roles including as a repressor of the lipid metabolism transcriptional regulator kstR, and the cell cycle regulator dnaA, which was independently associated with antibiotic resistance in our meta-analysis (Figure 1D). Like prpC and prpD, icl-1 expression in propionate-containing media was strongly attenuated in the prpR mutants, as was ramB to a lesser extent. By contrast, expression of both kstR and dnaA were unaffected by prpR mutation under these conditions (Supplementary Figure 6). Thus, the clearest consequence of the prpR mutations is altered expression of MCC components.
We therefore examined whether mutations in genes encoding other steps of the MCC are associated with drug resistance in our cohort. Mutations in prpC, which catalyzes the first step of the MCC, are enriched in drug resistant strains (8/9 prpC mutants are INH resistant, phyOverlap p = 0.03) but because they are less common than prpR mutations, prpC failed to reach significance in the genome-wide screen. Mutations in prpD or icl-1 were not associated with drug resistance, however loss of function mutations in icl-1 are lethal when M. tuberculosis is grown in the presence of propionate43, and thus may not represent a possible evolutionary path to drug tolerance.
Given that prpR mutants exhibit increased drug tolerance only in the presence of propionate or within macrophages, we next hypothesized that accumulation of propionyl-CoA through defective regulation of the MCC, rather than propionate exposure itself, could serve as an environmental response mechanism to slow the bacterial growth rate and thus increase tolerance to mechanistically unrelated drugs targeting growth processes. Previous studies have described growth inhibition due to propionyl-CoA accumulation in MCC mutants and have shown that growth inhibition can be rescued by supplementation with vitamin B12, which allows propionyl-CoA to be metabolized through the B12-dependent methylmalonyl-CoA pathway44 (Figure 2C). Consistent with this hypothesis, B12 supplementation during in vitro growth with propionate rescued the growth defects of the prpR deficient strains (Figure 5A,B) and significantly re-sensitized prpR mutants to isoniazid, rifampin, and ofloxacin (Figure 5C-F). Supplementation with vitamin B12 also rescued the fitness defects of prpR mutants in THP-1 cells, while simultaneously re-sensitizing these strains to isoniazid (Figure 5G,H), suggesting that propionate stress mediates antibiotic tolerance during macrophage infection as well. Overall, these data suggest that the hypomorphic prpR alleles act as a conditional brake on growth, creating drug tolerance, under conditions when the bacterium metabolizes propionate but cannot access the methylmalonyl-CoA pathway.
Figure 5.
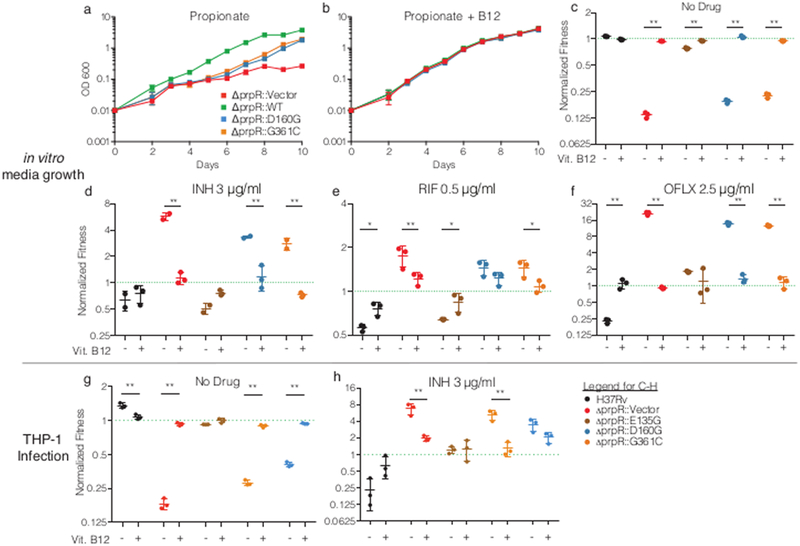
Metabolic rescue of propionate sensitivity suppresses drug tolerance in prpR mutants. (a-b) Growth of indicated prpR mutants in propionate-containing media with or without vitamin B12. Data represents the mean and standard deviation of three biological replicates. (c-f) Fitness of prpR mutants after antibiotic treatment with and without the supplementation of B12 normalized to input abundance and ΔprpR::WT. (g-h) The normalized fitness of strains in THP-1 cells with or without vitamin B12 supplementation in the absence (G) or presence (H) of isoniazid. The dotted green line indicates ΔprpR::WT which is set to 1 at each timepoint. Data represents the mean and standard deviation of 3 independent replicates. Significant differences in normalized fitness ± B12 supplementation were tested by Sidak’s multiple comparison test after two-way ANOVA. * p < 0.05, ** p < 0.01
Discussion
Bacterial genomic association studies promise to provide unique insights into the key processes driving the progression and treatment response of human tuberculosis. In contrast with in vitro bacterial genetic screens, these approaches do not require a priori knowledge of the relevant environmental conditions or altered bacterial phenotypes that contribute to the final phenotypes measured in clinical settings. This represents both a strength and a weakness, as associations capture a wide array of mechanistic drivers that must be carefully dissected.
Here we performed a genome-wide association study with isoniazid resistance, leveraging clinical isolates from the Chinese national survey of drug-resistant TB and cohorts of M. tuberculosis strains collected in China, Europe and Africa. In addition to identifying many known genetic determinants of drug resistance, we define two statistically significant associations with drug resistance, prpR and Rv2752c, putatively encoding RNase J, both of which had no known relationship with drug resistance. We validated our approach by defining the mechanistic basis for the association with prpR, a transcriptional regulator of propionate metabolism. Rather than causing drug resistance per se, we demonstrate that common prpR mutations confer multi-drug tolerance.
This is the first description of clinically prevalent M. tuberculosis mutations that alter susceptibility to multiple unrelated antibiotics. In the case of prpR, these tolerance mutations have remained unrecognized because the effects of prpR mutations on antibiotic efficacy are not captured in standard drug susceptibility studies, which measure drug resistance, not drug tolerance, and are only performed under one growth condition. Nevertheless, the population-based association of prpR mutations with drug resistance provides a real-world demonstration of the stepping-stone nature of drug tolerance that has been described in E. coli in vitro21.
It is difficult from these data, however, to determine which antibiotics might be most affected by prpR mutations in clinical practice. It is possible that in tuberculosis patients, prpR mutations broadly slow bacterial clearance by the first line regimen. Alternatively, these mutations may have greater effects on the efficacy of certain antibiotics, perhaps because of the in vivo pharmacology of the individual drugs. Additionally, there may be host or disease state factors that influence the impact of prpR mutations perhaps by altering the availability of propionate or vitamin B12. Our in vitro data further suggest that prpR point mutants may be most protective during acute exposure to metabolic stress and during chronic exposure may eventually resume growth and become re-sensitized to antibiotics although in mouse models, cholesterol metabolism appears most important during chronic infection37. The extent to which M. tuberculosis moves in and out of these metabolic stresses in humans is unknown and could determine the degree of protection. This effect may account for the notable lack of any INDEL or non-sense mutants in prpR across any dataset examined as part of our analyses, where mutations providing a balance between tolerance and growth are optimal for fitness during treatment. The extent to which these factors impact the frequency of prpR mutants in the population may also explain the uneven distribution and strength of association with prpR mutants across global datasets.
Regional differences in second line drug regimens may also contribute to the discordances between the published M. tuberculosis GWAS studies. This type of effect can clearly be seen for eis promoter mutations, which are known to cause kanamycin resistance. Eis promoter mutations evolved only twice in our Chinese cohort and thus are not significantly associated with any drug resistances. By contrast, these mutations evolved 31 times in the European/African cohort where they were significantly associated with isoniazid resistance without being a causal determinant (Figure 1D). Thus, regional differences in second line drug usage may contribute to different associations, as could geographic differences public health infrastructure which could impact drug access and quality. In either case, measuring the association with the true phenotype, rather than a correlate, would presumably decrease variability among study groups. Additionally, it is possible certain mutations may be more common in some mycobacterial lineages or strains due to genetic epistasis34, although we observe prpR mutations in both Lineage 2 and Lineage 4 backgrounds in our dataset.
Finally, we hypothesize based on the blunted efficacy of several antibiotics in our study, that prpR mutations may also contribute directly to treatment failure even in the absence of acquired drug resistance. As noted above, prpR mutations are found in 5% of drug susceptible strains in China and 1–2% in other regions of the world. Other genes identified in this study also contain convergent mutations in drug susceptible strains; for example, Rv2752c mutations are present in 4% of drug susceptible strains. Testing the hypothesis that these mutations may also contribute directly to treatment failure will require improved clinical endpoints for genetic association, ideally including metrics such as relapse and failure to convert to diagnostic culture negativity during treatment. While assaying drug tolerance under a range of growth conditions is not feasible in clinical practice, further characterization of these genetic associations will permit the identification of tolerant strains through molecular diagnostics and allow for targeted therapies and monitoring to help prevent the emergence of de novo drug resistances and improve treatment outcomes.
Online Methods
Strain selection and culture
A national survey of drug-resistant tuberculosis was conducted in China in 2007, which collected a total of 3,929 clinical M. tuberculosis isolates from 70 sites of 31 provinces in mainland China 18. The study was approved by the Tuberculosis Research Ethics Review Committee of the China CDC. Written informed consent was obtained from each participant. Three subsets of the collection were included in the current study based on the following criteria: i) all MDR strains (defined as isolates that was resistant to at least isoniazid and rifampin); ii) all isoniazid mono-resistant strains (defined as isolates that were resistant to isoniazid but sensitive to all of the other five drugs including rifampicin, streptomycin, ethambutol, ofloxacin and kanamycin); iii) randomly selected 3–5 drug sensitive strains (defined as isolates that was sensitive to all of the six drugs aforementioned) from each of the 70 collection sites. All isolates were cultured on Lowenstein-Jensen slants at 37 C for 4–6 weeks. Strains that failed in bacterial revival or produced abnormal/mixed colonies were excluded from further analysis. In all, 288 MDR strains, 61 isoniazid mono-resistant strains and 200 drug sensitive strains were available for follow up whole genome sequencing.
Sequencing, alignment and SNP calling
Genomic DNA was extracted from each isolate using standard methods45, and was then sequenced on the Illumina GAIIx or HiSeq 2500 platforms, generating single end reads of 72 bp or 101 bp in length. For each sample duplicate reads were removed by custom Perl scripts. Further quality control was conducted using the NGSQCToolkit46 with a cutoff of Q20. Valid reads were then aligned to the reference genome sequence of H37Rv (GenBank accession NC_000962) using the Burrows-Wheeler algorithm as implemented in BWA47. SNPs were identified with a minimum depth of 10× and a consensus quality score of 50 using SAMtools48. For the publicly available complete/draft genomes involved in our phylogenetic analysis (Supplemenary Table 2), the wgsim program from the SAMtools package was used to generate three millions of 72 bp single reads for each to generate an ~50× depth of simulated sequencing data for each genome and SNPs were identified as above. SNPs located within repetitive regions, including transposases, PE/PPE genes, prophages and exact sequence repeats of the H37Rv genome previously proposed49 or identified by RepeatMasker (http://www.repeatmasker.org/) or PhageFinder50, were excluded. Mixed base calls were considered valid only if the numbers of the most abundant (n1) and the second most abundant (n2) nucleotides at each SNP in each strain satisfied the criteria n1/n2≧5. The detailed workflow of the SNP-calling procedure of datasets for follow-up analysis is given in Supplementary Figure 7.
Phylogenetic analysis
A concatenated superset of SNPs relative to H37Rv was generated across all 549 sequenced strains and 130 published M. tuberculosis genomes (Supplementary Table 2). SNP sites with missing data in over 5% of the strains within the dataset were removed. To avoid the potential effects of homoplasy of drug resistance-associated mutations in phylogeny, SNPs located in known drug-resistance related genes available from TBDReaMDB51 were further excluded from the dataset for phylogenetic tree construction (Supplementary Figure 7). A strain of M. canetti was included as an outgroup (GenBank accession NC_015848). The refined SNP set was used to construct the maximum-likelihood phylogeny using RAxML52 under the GTRgamma substitution model. The reliability of each node was tested via a bootstrap analysis on 100 resampled datasets. The iTOL server53 and MEGA554 software were employed for the manipulation and presentation of the phylogenetic trees. To define clusters, we first employed a threshold of 100 SNPs among isolates based on molecular clock estimates of ~0.5 SNPs accumulating per strain per year where larger distances would place the most-recent common ancestor of a set of isolates prior to the widespread use of isoniazid. We also assessed the isoniazid resistance determining SNP present within each cluster to discriminate true isoniazid resistant clusters from closely related isolates with distinct resistance causing mutations.
Drug resistance associations
Genomic associations were performed using a method similar to that of Farhat et al27 which we refer to as phyOverlap. We performed maximum parsimony ancestral sequence reconstruction to determine the state of each SNP residue at the common ancestor of our strain collection using the Mesquite software package (http://mesquiteproject.org/). In cases where the ancestral sequence could not be unambiguously determined, we excluded the site from further analysis. Each isolate was then scored as ancestral or derived for a given SNP locus. Isolates with ambiguous base calls were considered ancestral for this calculation to minimize the potential of error driving associations with drug resistance. The overlap with drug resistance was scored by dividing the number of isolates containing a derived allele which also were resistant to isoniazid by the total number of isolates with a derived allele at a given SNP locus. To generate a gene-wide score, we excluded synonymous SNPs and averaged the individual SNP scores, weighting the scores by the number of times derived alleles evolved across the phylogenetic tree. The number of times a site mutated across the tree was calculated as the parsimony score at each SNP position using the Fitch algorithm as implemented in the R package phangorn55. This was performed with mixed bases treated as missing data so that low quality base-calls would not appear highly convergent.
Significance testing was performed by redistributing the mutation events in each SNP in each gene randomly across the phylogenetic tree, with the probability of a mutation occurring on any branch proportional to the branch length and all offspring of a branch being assigned the derived allele for calculation of the permuted overlap score. The gene-wide score was then recalculated and compared with the actual value. This process was repeated 50,000 times to derive an empirical p-value. For all statistical calculations, associations which achieved a p-value of 0 were considered <2×10⁻⁵. False discovery rate q-values were then calculated to account for multiple hypothesis testing using the Benjamini-Hochberg procedure56.
Analysis of data from Zhang et al.29 and Walker et al.30 was performed using the same SNP calling and association pipeline described above (Supplementary Figure 7). We utilized a subset of 784 isolates from Walker et al.30 including 369 drug sensitive isolates, 34 INH mono-resistant isolates, and 381 MDR isolates which had additional drug resistance in some cases (Supplementary Table 5). Meta-analysis p-values were calculated using Fisher’s method.
Analysis of the data from Casali et al.34, Guerra-Assunção et al.33 and Holt et al.35 was performed with a slightly modified workflow to accommodate the larger datasets. Isolates not achieving 90% coverage of the H37Rv genome at 10× depth were excluded from analysis. SNP calling was performed the HaplotypeCaller tool Genome Analysis Toolkit version 3.658. Sites with less than 10× coverage or <90% majority base call were treated as missing data. As above, repetitive regions, known DR associated regions, and sites with <95% confident calls among strains were excluded from further analysis. Phylogeny reconstruction was performed using FastTree 49 using the GTR model and rooted at the midpoint. Strains were considered isoniazid resistant if they had any mutation within katG excluding the known lineage-associated R463L variant or contained a mutation in the fabG1-inhA promoter region.
Growth conditions and strain construction
M. tuberculosis strains were maintained in 7H9 media comprised of Middlebrook 7H9 salts supplemented with 0.2% glycerol, 10% OADC, and 0.05% Tween 80. The acetate and propionate exposures were performed in 7H12 media comprised of Middlebrook 7H9 salts, 0.1% casamino acids, 0.2% glycerol, 0.05% tyloxapol, and then supplemented with 0.02% of either sodium acetate or sodium propionate. Vitamin B12 was supplemented as cobalamin at a concentration of 10ug/ml where indicated. Outgrowth of bacteria on solid media was performed on 7H10 agar supplemented with 0.5% glycerol, 10% OADC, and 0.05% Tween 80.
The ΔprpR strain was constructed as described in Griffin et al 28. PrpR complemented strains were constructed by integration of a kanamycin resistant, prpR-bearing plasmid at the L5 phage integration site. PrpR expression was driven by the native promoter sequence spanning 95 bases upstream of the annotated prpR sequence. Both the wildtype strain and ΔprpR::vector had similar plasmids lacking prpR introduced into the genome. Each prpR variant and empty vector was tagged with a unique DNA barcode, isolated from the prpR promoter sequence by two copies of the rrnB transcriptional terminator, to reduce the likelihood of any tag effect on prpR expression.
Growth curves and prpR/prpD expression analysis
For measurement of growth, the indicated strains were grown into mid-log phase in 7H9 media, spun down, and resuspended to an OD600 of 0.01 in 7H12 media with the indicated short-chain fatty acid. OD600 was measured daily. Data is representative of three biological replicates. Regrowth of propionate-exposed strains displayed in Supplementary Figure 3 was performed after recovery in 7H9 media for 7 days. For expression analysis, the indicated strains were grown into mid-log phase in 7H9 media, spun down, and resuspended to an OD600 of 0.1 in 7H12 media with the indicated short-chain fatty acid. After two days of growth, cultures were spun down, resuspended in 1 ml Trizol reagent, and disrupted by bead beating. Chloroform was added to 25% of the total volume and then RNA was extracted using the Direct-zol miniprep kit (Zymo Research). 800ng of total RNA was used as a template for cDNA synthesis with random hexamers using SuperScript IV reverse transcriptase (ThermoFisher Scientific). Transcript abundance was measured by qPCR and normalized with sigA expression with the following primers: prpD TGACTTTCACGACACGTTTCTGGC and TGTGGATCTCATAGGCGGTTACCA; prpR ATGTCAACCAGTTGGAGAATGA and CGGAATCCGAGGAGAAATACTG; sigA CAAGTTCTCCACCTACGCTAC and GTTGATCACCTCGACCATGT; dnaA TACACGCGGCAGGCAACT and GGAGACATATTTGACCCGCATT.
Mean relative expression across three biological replicates was compared and p-values were determined using Tukey’s honestly significant difference post-hoc test after ANOVA.
Antibiotic susceptibility testing
Minimum inhibitory concentrations were measured using the Alamar Blue reduction assay. Strains were grown to mid-log phase, spun down and resuspended in 7H12 media with the indicated short-chain fatty acid. After two days of growth, each strain was diluted to OD600 0.0015 in 200 ul of the appropriate media with antibiotics at the indicated concentrations. 20 ul of Alamar Blue reagent was added at 4 days post drug exposure, and reduction was measured by OD570 at 8 days post drug exposure. Percent growth was normalized for each strain in each growth condition by the subtracting the OD570 of a no-cell well and scaling by the reduction measurement of a no-drug control. Minimum inhibitory concentration data is representative of two independent replicates.
A library containing H37Rv and all prpR mutants described above was constructed by mixing all strains at equal density. Several aliquots were then frozen to ensure the library would remain consistent between experiments. Antibiotic tolerance was measured using time-dependent killing assays. The library was grown to mid-log phase, spun down, resuspended in 7H12 media with the indicated short-chain fatty acid to OD600 0.05 in triplicate for each condition. After two days of growth, the colony forming units (CFU) per ml was measured by plating serial dilutions onto solid media and enumerating colonies after 21 days of growth. After initial CFU measurement, antibiotics were applied in the indicated concentrations. CFU determination was performed for each replicate every two days for the next six days. To measure the relative abundance of each strain during treatment, a bulk sample representing >1000 CFU was plated onto drug free media at each timepoint. After 21 days of growth on solid media, gDNA was extracted from the entire resulting biomass. Amplicon sequencing libraries spanning the variable region of each unique molecular barcode were generated using PCR primers binding to regions common among all vectors as previously described59. During this PCR, random nonamers were incorporated into the sequence to allow for the accurate determination of input templates. The abundance of each barcode was then measured by deep sequencing on the Illumina MiSeq platform. Each library represented at least 40,000 unique combinations of barcodes and template counters. The fraction of the CFU in each replicate/condition attributable to each strain was calculated by dividing the total CFU by the representation of each strain as determined by sequencing. To calculate fraction survival, the CFU at each point was divided by the measured starting CFU which was normalized to 1. To test for differences in the fraction of surviving bacteria, survival fractions were log transformed and the differences among mean survivals was compared with using Tukey’s honestly significant difference post-hoc test within timepoints after two-way ANOVA.
Single-strain survival was performed in a similar fashion. Two days of short-chain fatty acid exposure prior to antibiotic treatment. CFU was measured immediately prior to antibiotic addition, and after 6 days of antibiotic exposure, the ending CFU was quantified and the fraction of cells surviving was calculated. Data for each condition is representative of three independent biological replicates.
Mouse and macrophage infection and competition measurement
All mouse experiments were approved by the Harvard University Institutional Animal Care and Use Committee (IACUC) as complying with ethical regulations. The program and facility is accredited by AAALAC and the OLAW assurance number is A3431–01. 6–8 week old female C57BL/6J mice were obtained from Jackson Laboratories. Infection was initiated by tail-vein injection of the prpR library at 1×10⁵ CFU in a 100 μl injection. On day 1 post infection, 3 mice were sacrificed, spleens were collected and homogenized in phosphate buffered saline, and bacterial burden was determined by plating serial dilutions on 7H10 agar. Concurrently with CFU determination, additional homogenate was frozen in 10% glycerol at −80C. Colonies were counted after 21 days of incubation at 37C. At 14 days post-infection, an additional five mice were sacrificed and the remaining mice were administered antibiotics or served as no drug controls (n=5 per timepoint per treatment). Mice were treated by ad libitum administration of drugs through their drinking water containing either isoniazid 0.1g/liter, rifampin 0.1g/liter or moxifloxacin 0.4g/liter. Sample size was selected based on the initial validation of the strain tagging and pooling system described by Blumenthal et al 60 where groups of 4–5 mice were sufficient to identify roughly 10-fold changes in in vivo abundance of mutants. After CFU determination, bacterial colonies were scraped from the plates and gDNA was extracted. In cases where <500 colonies were sampled, additional frozen material was plated to increase the sample size of recovered bacteria. Sequencing library preparation was performed as described above. Relative abundance was determined by dividing the number of reads from each molecular barcode by the number of reads from the molecular barcode corresponding to ΔprpR::WT, and the starting relative abundance for each strain was set to 1 by dividing each value by the average abundance of a strain in the inoculum as measured from libraries plated on solid media on the same day as initiation of infection. There was no randomization in this study because there were no features for which randomization was deemed appropriate. Similarly, blinding was not performed in these experiments. The measurements of CFU and representation of strains in competition assays do not require researcher-based judgments and therefore we deemed blinding not necessary.
Human blood components (buffy coats) for macrophage experiments were procured through Blood Transfusion Services (BTS) at Massachusetts General Hospital (MGH) for in vitro research by Investigators at the Ragon Institute of MGH, MIT and Harvard. These specimens were collected from donations for clinical use and only excess blood or blood products that are not needed are then processed for research purposes. The specimens supplied for these purposes are not identifiable. Donors in the Blood Transfusion Services at MGH sign a Donor Consent within a Registration Form that includes the following sentence, “I give permission for my blood to be used for transfusion to patients or for research.” This protocol was approved by the MGH Human Research Committee.
Peripheral blood mononuclear cells were isolated by Ficoll gradient separation. CD-14 positive cells were then positively selected using the EasySep Human CD14 positive selection kit (Stemcell Technologies). Isolated CD-14 positive cells were matured for 6 days incubated on ultra-low attachment plates at 37C in 5% CO2 in RPMI supplemented with 2mM L-glutamine, 10mM Hepes, and 10% fetal bovine serum. After six days, cells were collected and transferred to 12-well tissue culture treated dishes at a density of 500,000 cells per well and allowed to rest overnight. The prpR mutant library described above was then used to initiate infections. The library was spun down, resuspended in cell culture media, passed through a 5 μm filter, and diluted to 2 million cells/ml. A portion of this library was plated in triplicate to allow for measurement of the relative abundance of each strain in the input library. 500 μl of prepared library was then applied to each well of macrophages and infection was allowed to proceed for 3 hours. The infected macrophages were then washed three times with RPMI and covered with culture media. Bacteria were collected from three wells one day post-infection to measure the abundance of each strain in the macrophages directly prior to antibiotic addition. Antibiotic treatment was then initiated by removing half of the media and replacing it with a 2× antibiotic solution to achieve a final concentration of either no drug, isoniazid 3μg/ml, ofloxacin 2.5μg/ml or rifampin at 5 μg/ml. At each timepoint, bacteria were recovered from the macrophages by removing culture media and adding 0.1% Triton 100 in water and then plating on solid media for 21 days. Each treatment was performed in triplicate wells. The fitness of each strain was compared with ΔprpR::WT by one-way T-test against the normalized ΔprpR::WT of 1.0 and multiple test correction was performed for each treatment using false discovery rate correction.
THP-1 cells were obtained from ATCC. Cells were not authenticated or tested for mycoplasma contamination. THP-1 infection was largely identical to infection of human PBMC derived macrophages except: THP-1 cells were matured by addition of PMA at 50 ng/ml final concentration for 24 hours, followed by removal of PMA for 16–24 hours prior to infection with the tagged strain library at MOI = 1.
Supplementary Material
Acknowledgments
Funding
Support was generously provided by the National Major Science and Technology Project of China (2012ZX10003002001–001) (2014ZX10003002) to YZ; the National Program on Key Basic Research Project of China (2014CB744403973) and the CAMS Innovation Fund for Medical Sciences (2016-I2M-1–013) to QJ; the National Institute of Health (5U19AI109755–04) to SMF; and NIH pre-doctoral training grant support (5T32AI007638–15 to Eric J. Rubin and 5T32-AI049928–14 to Dyann Wirth) to NDH.
Footnotes
Code availability
The code used to perform statistical testing of the phylogenetic overlap between mutations and antibiotic resistance (phyOverlap) is available for download at https://github.com/nathan-d-hicks/phyOverlap. This also contains all of the input files used to generate Figure 1C including the phylogenetic tree and SNP calls.
Data Availability
Sequencing reads have been submitted to the NCBI Sequence Read Archive (SRA) under accession PRJNA268900. A complete list of the TB strains analyzed in this study together with phenotypic and sequencing information is given in Supplementary Table 1. Strains added for phylogenetic reference in Figure 1B are listed in Supplementary Table 3. A complete list of SRA/ENA accession numbers for analysis of additional datasets is included in Supplementary Table 8.
Competing financial interests
None to report.
References
- 1.WHO. Global Tuberculosis Report. 2017 http://www.who.int/tb/publications/global_report/gtbr2017_main_text.pdf.
- 2.Gegia M, Winters N, Benedetti A, van Soolingen D & Menzies D Treatment of isoniazid-resistant tuberculosis with first-line drugs: a systematic review and meta-analysis. Lancet Infect Dis 17, 223–234 (2017). [DOI] [PubMed] [Google Scholar]
- 3.Weis SE et al. The effect of directly observed therapy on the rates of drug resistance and relapse in tuberculosis. N. Engl. J. Med 330, 1179–84 (1994). [DOI] [PubMed] [Google Scholar]
- 4.Pasipanodya JG & Gumbo T A meta-analysis of self-administered vs directly observed therapy effect on microbiologic failure, relapse, and acquired drug resistance in tuberculosis patients. Clin. Infect. Dis 57, 21–31 (2013). [DOI] [PMC free article] [PubMed] [Google Scholar]
- 5.Gillespie SH et al. Four-month moxifloxacin-based regimens for drug-sensitive tuberculosis. N. Engl. J. Med 371, 1577–87 (2014). [DOI] [PMC free article] [PubMed] [Google Scholar]
- 6.Jindani A et al. High-dose rifapentine with moxifloxacin for pulmonary tuberculosis. N. Engl. J. Med 371, 1599–608 (2014). [DOI] [PMC free article] [PubMed] [Google Scholar]
- 7.Merle CS et al. A four-month gatifloxacin-containing regimen for treating tuberculosis. N. Engl. J. Med 371, 1588–98 (2014). [DOI] [PubMed] [Google Scholar]
- 8.Fridman O, Goldberg A, Ronin I, Shoresh N & Balaban NQ Optimization of lag time underlies antibiotic tolerance in evolved bacterial populations. Nature 513, 418–21 (2014). [DOI] [PubMed] [Google Scholar]
- 9.Van den Bergh B et al. Frequency of antibiotic application drives rapid evolutionary adaptation of Escherichia coli persistence. Nat Microbiol 1, 16020 (2016). [DOI] [PubMed] [Google Scholar]
- 10.Brauner A, Fridman O, Gefen O & Balaban NQ Distinguishing between resistance, tolerance and persistence to antibiotic treatment. Nat. Rev. Microbiol 14, 320–30 (2016). [DOI] [PubMed] [Google Scholar]
- 11.Lewis K Persister cells. Annu. Rev. Microbiol 64, 357–72 (2010). [DOI] [PubMed] [Google Scholar]
- 12.Mulcahy L, Burns J, Lory S & Lewis K Emergence of Pseudomonas aeruginosa Strains Producing High Levels of Persister Cells in Patients with Cystic Fibrosis. J Bacteriol 192, 6191–6199 (2010). [DOI] [PMC free article] [PubMed] [Google Scholar]
- 13.Lafleur MD, Qi Q & Lewis K Patients with long-term oral carriage harbor high-persister mutants of Candida albicans. Antimicrob. Agents Chemother 54, 39–44 (2010). [DOI] [PMC free article] [PubMed] [Google Scholar]
- 14.Keren I, Minami S, Rubin E & Lewis K Characterization and transcriptome analysis of Mycobacterium tuberculosis persisters. MBio 2, e00100–11 (2011). [DOI] [PMC free article] [PubMed] [Google Scholar]
- 15.Gomez JE & McKinney JDM tuberculosis persistence, latency, and drug tolerance. Tuberculosis (Edinb) 84, 29–44 (2004). [DOI] [PubMed] [Google Scholar]
- 16.Wayne LG & Hayes LG An in vitro model for sequential study of shiftdown of Mycobacterium tuberculosis through two stages of nonreplicating persistence. Infect. Immun 64, 2062–9 (1996). [DOI] [PMC free article] [PubMed] [Google Scholar]
- 17.Xie Z, Siddiqi N & Rubin EJ Differential antibiotic susceptibilities of starved Mycobacterium tuberculosis isolates. Antimicrob. Agents Chemother 49, 4778–80 (2005). [DOI] [PMC free article] [PubMed] [Google Scholar]
- 18.Adams KN et al. Drug tolerance in replicating mycobacteria mediated by a macrophage-induced efflux mechanism. Cell 145, 39–53 (2011). [DOI] [PMC free article] [PubMed] [Google Scholar]
- 19.Dhar N & McKinney JD Mycobacterium tuberculosis persistence mutants identified by screening in isoniazid-treated mice. Proc. Natl. Acad. Sci. U.S.A 107, 12275–80 (2010). [DOI] [PMC free article] [PubMed] [Google Scholar]
- 20.Levin BR & Rozen DE Non-inherited antibiotic resistance. Nat. Rev. Microbiol 4, 556–62 (2006). [DOI] [PubMed] [Google Scholar]
- 21.Levin-Reisman I et al. Antibiotic tolerance facilitates the evolution of resistance. Science 355, 826–830 (2017). [DOI] [PubMed] [Google Scholar]
- 22.Zhao Y et al. National survey of drug-resistant tuberculosis in China. N. Engl. J. Med 366, 2161–70 (2012). [DOI] [PubMed] [Google Scholar]
- 23.Comas I et al. Out-of-Africa migration and Neolithic coexpansion of Mycobacterium tuberculosis with modern humans. Nat. Genet 45, 1176–82 (2013). [DOI] [PMC free article] [PubMed] [Google Scholar]
- 24.Luo T et al. Southern East Asian origin and coexpansion of Mycobacterium tuberculosis Beijing family with Han Chinese. Proc. Natl. Acad. Sci. U.S.A 112, 8136–41 (2015). [DOI] [PMC free article] [PubMed] [Google Scholar]
- 25.Casali N et al. Microevolution of extensively drug-resistant tuberculosis in Russia. Genome Res 22, 735–45 (2012). [DOI] [PMC free article] [PubMed] [Google Scholar]
- 26.Cohen KA et al. Evolution of Extensively Drug-Resistant Tuberculosis over Four Decades: Whole Genome Sequencing and Dating Analysis of Mycobacterium tuberculosis Isolates from KwaZulu-Natal. PLoS Med 12, e1001880 (2015). [DOI] [PMC free article] [PubMed] [Google Scholar]
- 27.Farhat MR et al. Genomic analysis identifies targets of convergent positive selection in drug-resistant Mycobacterium tuberculosis. Nat. Genet 45, 1183–9 (2013). [DOI] [PMC free article] [PubMed] [Google Scholar]
- 28.Manson AL et al. Genomic analysis of globally diverse Mycobacterium tuberculosis strains provides insights into the emergence and spread of multidrug resistance. Nat. Genet 49, 395–402 (2017). [DOI] [PMC free article] [PubMed] [Google Scholar]
- 29.Zhang H et al. Genome sequencing of 161 Mycobacterium tuberculosis isolates from China identifies genes and intergenic regions associated with drug resistance. Nature genetics 45, 1255–60 (2013). [DOI] [PubMed] [Google Scholar]
- 30.Walker TM et al. Whole-genome sequencing for prediction of Mycobacterium tuberculosis drug susceptibility and resistance: a retrospective cohort study. Lancet Infect Dis 15, 1193–202 (2015). [DOI] [PMC free article] [PubMed] [Google Scholar]
- 31.Sun L, Zhang L, Zhang H & He Z-G Characterization of a bifunctional β-lactamase/ribonuclease and its interaction with a chaperone-like protein in the pathogen Mycobacterium tuberculosis H37Rv. Biochem Mosc 76, 350–358 (2011). [DOI] [PubMed] [Google Scholar]
- 32.Taverniti V, Forti F, Ghisotti D & Putzer H Mycobacterium smegmatis RNase J is a 5’−3’ exo-/endoribonuclease and both RNase J and RNase E are involved in ribosomal RNA maturation. Mol. Microbiol 82, 1260–76 (2011). [DOI] [PubMed] [Google Scholar]
- 33.Guerra-Assunção JA et al. Large-scale whole genome sequencing of M. tuberculosis provides insights into transmission in a high prevalence area. Elife 4, (2015). [DOI] [PMC free article] [PubMed] [Google Scholar]
- 34.Casali N et al. Evolution and transmission of drug-resistant tuberculosis in a Russian population. Nat. Genet 46, 279–86 (2014). [DOI] [PMC free article] [PubMed] [Google Scholar]
- 35.Holt KE et al. Frequent transmission of the Mycobacterium tuberculosis Beijing lineage and positive selection for the EsxW Beijing variant in Vietnam. Nat. Genet 50, 849–856 (2018). [DOI] [PMC free article] [PubMed] [Google Scholar]
- 36.Liu Q et al. Within patient microevolution of Mycobacterium tuberculosis correlates with heterogeneous responses to treatment. Sci Rep 5, 17507 (2015). [DOI] [PMC free article] [PubMed] [Google Scholar]
- 37.Pandey AK & Sassetti CM Mycobacterial persistence requires the utilization of host cholesterol. Proc. Natl. Acad. Sci. U.S.A 105, 4376–80 (2008). [DOI] [PMC free article] [PubMed] [Google Scholar]
- 38.Griffin JE et al. Cholesterol catabolism by Mycobacterium tuberculosis requires transcriptional and metabolic adaptations. Chem. Biol 19, 218–27 (2012). [DOI] [PMC free article] [PubMed] [Google Scholar]
- 39.Masiewicz P, Brzostek A, Wolański M, Dziadek J & Zakrzewska-Czerwińska J A novel role of the PrpR as a transcription factor involved in the regulation of methylcitrate pathway in Mycobacterium tuberculosis. PLoS ONE 7, e43651 (2012). [DOI] [PMC free article] [PubMed] [Google Scholar]
- 40.Muñoz-Elías EJ, Upton AM, Cherian J & McKinney JD Role of the methylcitrate cycle in Mycobacterium tuberculosis metabolism, intracellular growth, and virulence. Mol. Microbiol 60, 1109–22 (2006). [DOI] [PubMed] [Google Scholar]
- 41.KATO N The free and bound forms of the serum vitamin B12 in various animal species. J Vitaminol (Kyoto) 6, 132–8 (1960). [DOI] [PubMed] [Google Scholar]
- 42.Micklinghoff JC et al. Role of the transcriptional regulator RamB (Rv0465c) in the control of the glyoxylate cycle in Mycobacterium tuberculosis. J. Bacteriol 191, 7260–9 (2009). [DOI] [PMC free article] [PubMed] [Google Scholar]
- 43.Eoh H & Rhee KY Methylcitrate cycle defines the bactericidal essentiality of isocitrate lyase for survival of Mycobacterium tuberculosis on fatty acids. Proc. Natl. Acad. Sci. U.S.A 111, 4976–81 (2014). [DOI] [PMC free article] [PubMed] [Google Scholar]
- 44.Savvi S et al. Functional characterization of a vitamin B12-dependent methylmalonyl pathway in Mycobacterium tuberculosis: implications for propionate metabolism during growth on fatty acids. J. Bacteriol 190, 3886–95 (2008). [DOI] [PMC free article] [PubMed] [Google Scholar]
- 45.Somerville W, Thibert L, Schwartzman K & Behr MA Extraction of Mycobacterium tuberculosis DNA: a question of containment. Journal of clinical microbiology 43, 2996–2997 (2005). [DOI] [PMC free article] [PubMed] [Google Scholar]
- 46.Patel R & Jain M NGS QC Toolkit: a toolkit for quality control of next generation sequencing data. PloS one (2012). doi: 10.1371/journal.pone.0030619 [DOI] [PMC free article] [PubMed] [Google Scholar]
- 47.Li H & Durbin R Fast and accurate long-read alignment with Burrows-Wheeler transform. Bioinformatics 26, 589–95 (2010). [DOI] [PMC free article] [PubMed] [Google Scholar]
- 48.Li H et al. The sequence alignment/map format and SAMtools. Bioinformatics 25, 2078–2079 (2009). [DOI] [PMC free article] [PubMed] [Google Scholar]
- 49.Comas I et al. Human T cell epitopes of Mycobacterium tuberculosis are evolutionarily hyperconserved. Nature Genetics 42, 498–503 (2010). [DOI] [PMC free article] [PubMed] [Google Scholar]
- 50.Fouts D Phage_Finder: automated identification and classification of prophage regions in complete bacterial genome sequences. Nucleic Acids Research 34, 5839–51 (2006). [DOI] [PMC free article] [PubMed] [Google Scholar]
- 51.Sandgren A et al. Tuberculosis drug resistance mutation database. PLoS Med 6, e2 (2009). [DOI] [PMC free article] [PubMed] [Google Scholar]
- 52.Stamatakis A RAxML version 8: a tool for phylogenetic analysis and post-analysis of large phylogenies. Bioinformatics 30, 1312–3 (2014). [DOI] [PMC free article] [PubMed] [Google Scholar]
- 53.Letunic I & Bork P Interactive tree of life (iTOL) v3: an online tool for the display and annotation of phylogenetic and other trees. Nucleic Acids Res 44, W242–5 (2016). [DOI] [PMC free article] [PubMed] [Google Scholar]
- 54.Tamura K et al. MEGA5: molecular evolutionary genetics analysis using maximum likelihood, evolutionary distance, and maximum parsimony methods. Mol. Biol. Evol 28, 2731–9 (2011). [DOI] [PMC free article] [PubMed] [Google Scholar]
- 55.Schliep KP phangorn: phylogenetic analysis in R. Bioinformatics 27, 592–3 (2011). [DOI] [PMC free article] [PubMed] [Google Scholar]
- 56.Benjamini Y & Hochberg Y Controlling the false discovery rate: a practical and powerful approach to multiple testing. Journal of the royal statistical society. Series B (Methodological) 289–300 (1995). doi: 10.2307/2346101 [DOI] [Google Scholar]
- 57.McKenna A et al. The Genome Analysis Toolkit: a MapReduce framework for analyzing next-generation DNA sequencing data. Genome Res 20, 1297–303 (2010). [DOI] [PMC free article] [PubMed] [Google Scholar]
- 58.Price MN, Dehal PS & Arkin AP FastTree: computing large minimum evolution trees with profiles instead of a distance matrix. Mol. Biol. Evol 26, 1641–50 (2009). [DOI] [PMC free article] [PubMed] [Google Scholar]
- 59.Martin CJ et al. Digitally Barcoding Mycobacterium tuberculosis Reveals In Vivo Infection Dynamics in the Macaque Model of Tuberculosis. mBio 8, e00312–17 (2017). [DOI] [PMC free article] [PubMed] [Google Scholar]
- 60.Blumenthal A, Trujillo C, Ehrt S & Schnappinger D Simultaneous analysis of multiple Mycobacterium tuberculosis knockdown mutants in vitro and in vivo. PLoS ONE 5, e15667 (2010). [DOI] [PMC free article] [PubMed] [Google Scholar]
Associated Data
This section collects any data citations, data availability statements, or supplementary materials included in this article.