. 2018 Oct 25;7:e37925. doi: 10.7554/eLife.37925

Figure 9. IRF9 and STAT2 expression significantly correlated with the expression of PBRM1, SETD2, or BAP1 in ccRCC tumors.

(A) 20x IHC images of representative ccRCC foci stained with indicated antibodies. (B) Spearman correlation coefficient, rho, and p-value of nuclear (nuc) IRF9 or cytoplasmic (cyto) IHC signals with those of PBRM1, SETD2 or BAP1. The analysis was performed with either all the foci or the foci within each tumor stage or tumor grade. (C) Kaplan-Meier curves of patient overall survival based on the positive or negative IHC signal of nuclear IRF9 and (D) cytoplasmic STAT2. Statistical significance calculated using the log-rank test. (E) A schematic diagram showing how HIF and secondary tumor suppressors converge on ISGF3 to regulate tumor growth in ccRCC. HIF activates ISGF3 that suppresses tumor growth. PBRM1, KDM5C, SETD2 and BAP1 all support the function of ISGF3. Mutations in any of them relieve the tumor suppressive function of HIF2α.

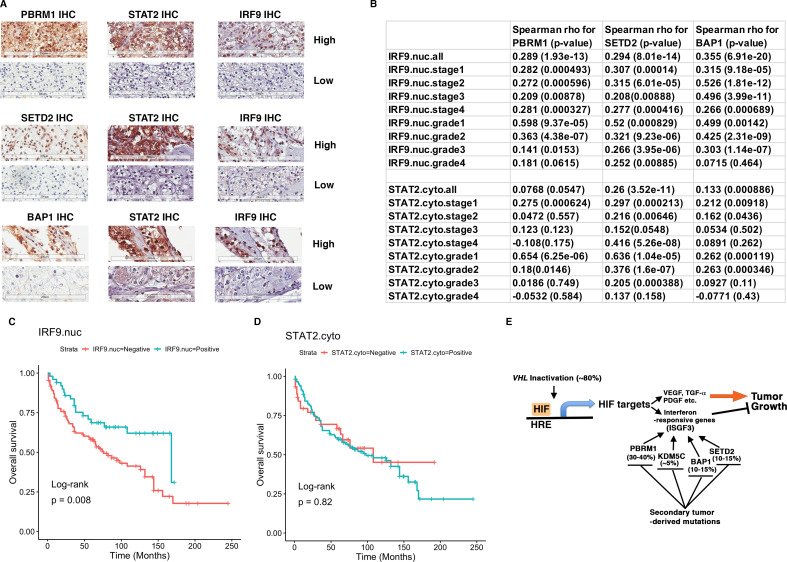
Figure 9.

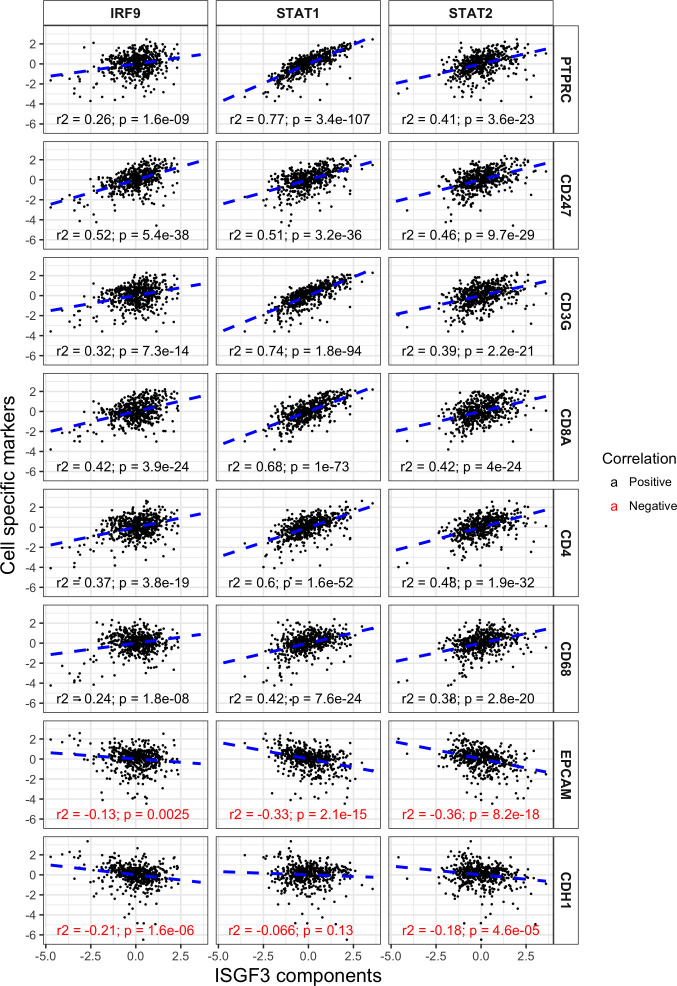
Figure 9—figure supplement 1. ISGF3 subunits correlate positively with immune cell markers and negatively with cancer cell markers in the TCGA dataset.

Figure 9—figure supplement 1.

Correlations between IRF9, STAT1 or STAT2 with immune and tumor cell markers within the TCGA dataset. N = 534; PTPRC, CD45; CD247, T-Cell Receptor T3 Zeta Chain; CD3G, T-Cell Receptor T3 Gamma Chain; CDH1, E-cadherin.
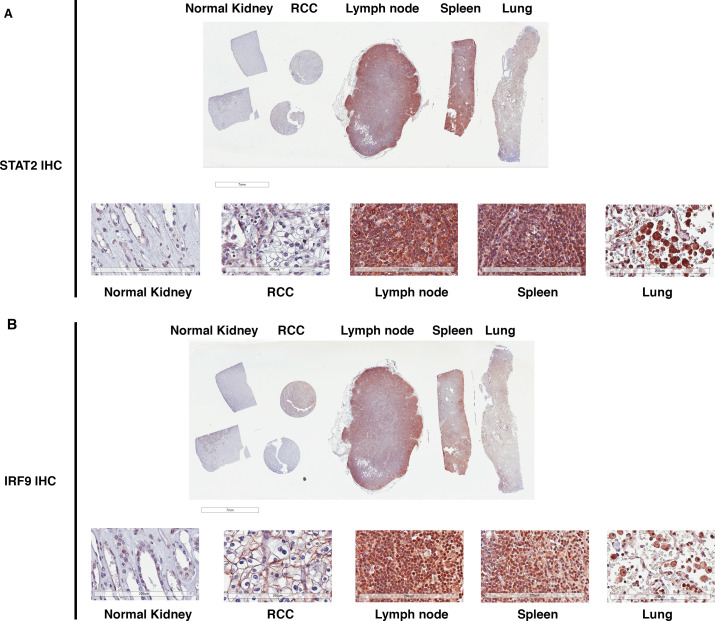
Figure 9—figure supplement 2. STAT2 and IRF9 protein levels are significantly higher in immune cells than that in kidney cells.

Figure 9—figure supplement 2.

IHC images of STAT2 (A) and IRF9 (B) stained human tissue samples from kidney, renal cell carcinoma, lymph node, spleen, and lung. For each antibody, the top is the macroscopic image of the slide, and the bottom shows the 20x image of each tissue.
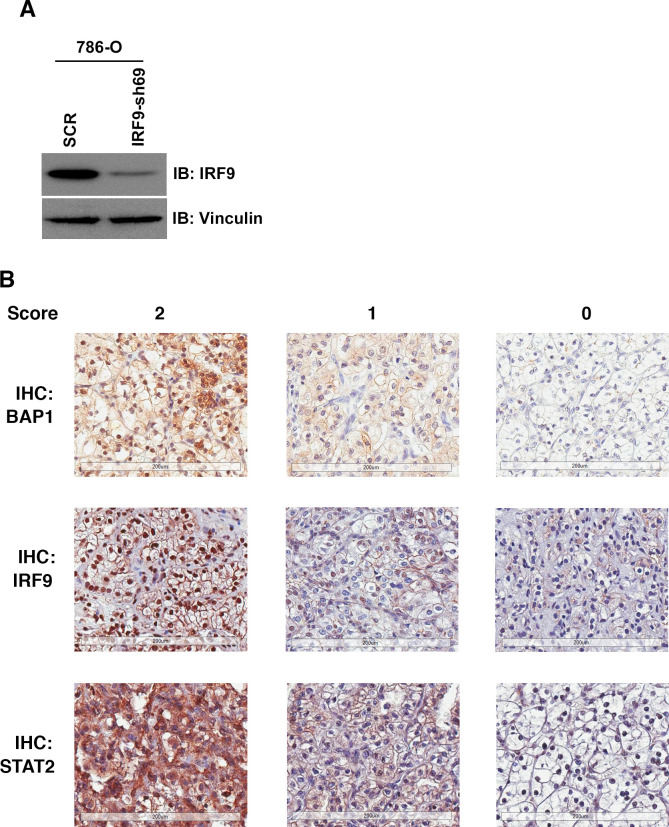
Figure 9—figure supplement 3. IHC staining of ccRCC tumors with BAP1, IRF9 or STAT2 antibodies.

Figure 9—figure supplement 3.

(A) 786-O cells were infected with the indicated shRNA constructs and the lysates were immunoblotted with indicated antibodies. (B) Representative images of foci from the TMA that were stained with indicated antibodies. Scoring: 2:>=50% of cancer cells stained positive; 1: 5–49% of cancer cells stained positive; 0:<5% of cancer cells stained positive.