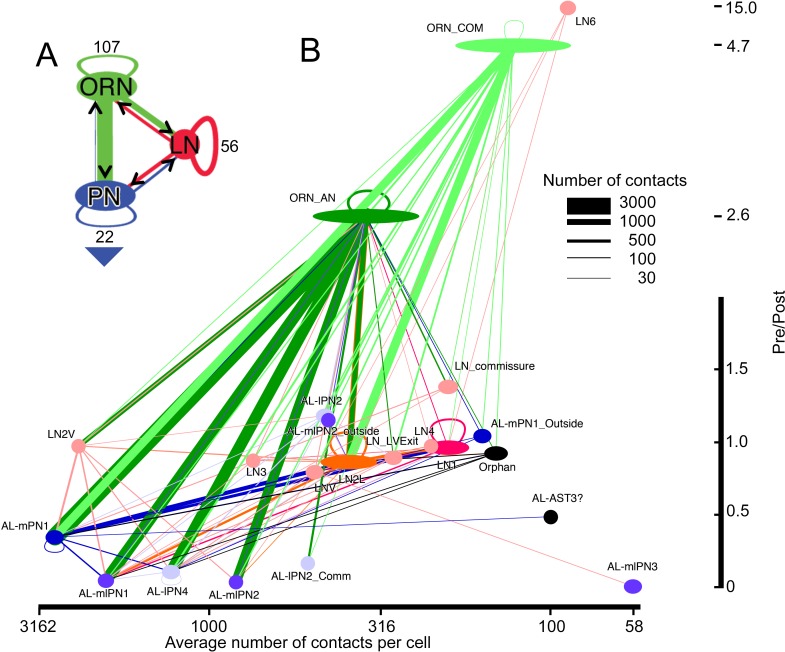
Figure 7. Network diagram for all cells and cell types within glomerulus VA1v having >50 pre/post contacts and reported in the overall matrix (Figure 5).
Edges show connections by classes of cells, not those of their individual constituent neurons. The width of each pathway arrow shows the number of anatomical synaptic contacts (key). (A) Aggregate network for three major classes of VA1v cells. The direction of pre- to postsynaptic contact is shown by the arrow and colour of the line connection between synaptic partner cells. ORN inputs to PNs are numerically predominant. Most LNs are predicted to be inhibitory, and provide pathways that integrate both ORN and PN activity; LNs also form their own network. Numbers indicate cells per class. Recurrent loops are feedback between different neurons of the same class. Large arrowhead indicates PN output to higher olfactory centres in the mushroom body and lateral horn. (B) Network diagram, as in A, plotted for subgroups of their type (see Figure 4 and Figure 4—Source data 4). Node width represents cell number per group, colour-coded as in Figure 6. Vertical: pre-/post- axis, note that this is interrupted at 2.0; horizontal: number of connections per cell plotted on a log scale.

