

Summary
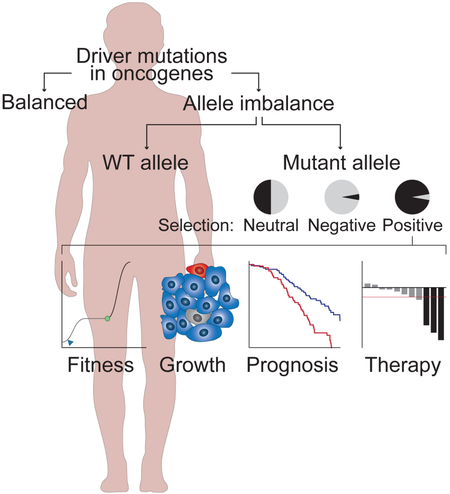
Driver mutations in oncogenes encode proteins with gain-of-function properties that enhance fitness. Heterozygous mutations are thus viewed as sufficient for tumorigenesis. We describe widespread oncogenic mutant allele imbalance in 13,448 prospectively characterized cancers. Imbalance was selected for through modest dosage increases of gain-of-fitness mutations. Negative selection targeted haplo-essential effectors of the spliceosome. Loss of the normal allele comprised a distinct class of imbalance driven by competitive fitness, which correlated with enhanced response to targeted therapies. In many cancers, an antecedent oncogenic mutation drove evolutionarily dependent allele-specific imbalance. In other instances, oncogenic mutations co-opted independent copy number changes via the evolutionary process of exaptation. Oncogenic allele imbalance is a pervasive evolutionary innovation that enhances fitness and modulates sensitivity to targeted therapy.
Keywords: Cancer, oncogenes, selection, exaptation, targeted therapy, competitive fitness
Graphical Abstract
Introduction
Alterations in oncogenes disrupt normal homeostatic mechanisms, ultimately promoting cancer initiation and progression. The two most common gain-of-function events targeting oncogenes in human cancers are somatic mutations (single-nucleotide changes, small inframe insertions and deletions) and focal DNA copy number amplifications. Individually, both events are common, well-studied (Garraway and Lander, 2013), and in a growing number of cases, therapeutically actionable (Hyman et al., 2017b). Nevertheless, with few exceptions, most recurrently mutated oncogenes are not focally amplified and most recurrent, focally amplified oncogenes are not frequently mutated. Indeed, a long-standing assumption that has prevailed since the initial discovery of gain-of-function mutations in cellular oncogenes is that these events are typically heterozygous because they are dominant acting and therefore sufficient to promote tumorigenesis (Varmus, 1984). However, oncogenic driver mutations co-exist in cancer genomes with extensive ~single copy genomic gains and losses. These chromosomal changes span mutant oncogenes and may lead to modest changes in mutant allele dosage (e.g. 2 of 3 copies) or stoichiometric changes in the balance of mutant and wild-type (WT) copies. This interplay has been explored in mutant tumor suppressor genes, which are recessive at the cellular level and therefore copy number changes that inactivate the WT allele increase fitness (Knudson, 1971). By contrast, similar serial genetic evolution at the loci of mutant oncogenes has not been investigated systematically.
In cultured cell lines and animal models, the functional implications of subtle changes in the allelic copy number of specific mutant oncogenes have been explored to some extent, particularly the biologic role of WT Ras alleles in heterozygous Ras-mutant tumors (Ambrogio et al., 2018; Bentley et al., 2013; Bremner and Balmain, 1990; Mueller et al., 2018; Soh et al., 2009; To et al., 2006; To et al., 2013; To et al., 2008; Westcott et al., 2015; Zhang et al., 2001). We recently described independent and cooperative effects of increased oncogenic KrasG12D copy number and subsequent loss of the WT Kras allele in mouse leukemias due to somatic copy-neutral loss-of-heterozygosity (CN-LOH) (Burgess et al., 2017). This loss of the WT Kras allele was associated with increased competitive fitness at the cost of increased MAP kinase pathway dependence. Human colorectal cancer cell lines exhibited a similar relationship between mutant KRAS allelic configuration and sensitivity to MEK inhibition (Burgess et al., 2017). Nevertheless, the overall frequency of such oncogenic mutant allele imbalance and its biological and therapeutic consequences are largely unexplored in primary human cancers.
Here, we sought to investigate the frequency, genetic mechanisms, and functional and therapeutic importance of allelic imbalance across a large number of mutant oncogenes.
Results
Quantifying the allelic configuration of oncogenic driver mutations
We examined the interplay between somatic mutations and DNA copy number alterations using a unique analytical framework that integrates somatic mutations from high depth-of-coverage sequencing with total, allele-specific, and integer DNA copy number (Shen and Seshan, 2016) in the same tumors to detect evidence of positive, neutral, and negative selection for mutant allele imbalance. A key aspect of this analysis was the ability to directly estimate the number of copies of the mutant and WT alleles of mutant oncogenes with high precision due to the high median tumor sequencing coverage (~650-fold) that permitted reduced measurement error of mutant allele frequencies (Figure S1A). This enabled us to attribute underlying allele-specific chromosomal changes to individual alleles harboring mutations (Figures 1A and S1B). We first classified clonal somatic mutations arising in oncogenes as either driver mutations that confer a selective advantage or as likely passenger mutations, or variants of uncertain significance (VUS), that are presumed to be selectively neutral (Table S1). For each tumor specimen, we then estimated the number of mutant and WT alleles based on genome-wide allele-specific copy number segmentation. The potential configurations of parental alleles spanning oncogenic mutations were then categorized into either balanced (the number of mutant and WT copies were equal) or one of multiple distinct classes of imbalance including genomic gains, losses, copy-neutral LOH, amplifications, or complex combinatorial events, each with respect to whether the underlying tumor genome was diploid or had undergone whole-genome duplication (WGD) (Figure 1B). We estimated the number of mutant alleles by comparing the observed allele fraction to the expected value derived from the tumor purity (Figure S1C) and the total gene copy number. The presence of more mutant copies than WT copies (i.e., mutant-to-WT ratio > 1) was referred to as mutant allele selection (Figure S1D). To determine the existence of positive, neutral, or negative selection for gain-of-fitness mutations, we compared driver and VUS/passenger mutations as well as germline single-nucleotide polymorphisms (SNPs) by oncogene and tissue of origin (Figure 1A).
Figure 1. Oncogenic mutant allele imbalance in advanced cancers.

(A) Somatic mutations were identified in a cohort of 13,448 prospectively sequenced advanced cancers and mutations in one of 69 frequently mutated oncogenes were classified as known drivers or likely passenger mutations [including variants of uncertain significance (VUS)]. The number of copies of the mutant and WT alleles were determined in each affected tumor based on allele-specific and integer copy number data in the same tumors after correcting for tumor cell purity and clonality. Positive, neutral, or negative selection was assessed as a function of the expected versus observed rate by which mutant and WT copies are targeted by the underlying allele-specific chromosomal changes. (B) Categories of oncogenic mutant allele imbalance characterized here are shown for tumors with an underlying diploid genome and for those that underwent genome doubling (WGD) with the red hash indicating an oncogenic mutation and the numbers at bottom reflecting the final WT and mutant allele configurations. Complex combinatorial events are not shown. The X for CN-LOH reflects linkage between two chromosomes, as in the case of uniparental disomy. (C) The percent of all tumors with mutations of the indicated types in allelic imbalance. (D) The different mechanisms of allelic imbalance of the indicated mutation classes. The mechanism of allelic imbalance is labeled and the number of allelically imbalanced mutations targeted by each category are provided in parentheses (for TSGs and oncogenes respectively). See also Figure S1 and Tables S1-S4.
To study the landscape of selection for oncogenic mutant allele imbalance, we applied these approaches to 1,229 unique driver mutations and 17,352 likely passenger mutations across 69 oncogenes in a prospectively sequenced cohort of 13,448 advanced solid cancers from 53 cancer types (Tables S1 and S2) (Zehir et al., 2017). We then validated key results using an independent cohort of 5,853 human tumors (Table S2). Overall, 55% of all oncogenic driver mutations in the 69 oncogenes examined were heterozygous, while 45% exhibited allelic imbalance. Among all tumors, 41% exhibited mutant allele imbalance of one or more driver mutations (Figure 1C; Tables S2 and S3). Exploring the genetic mechanisms underlying oncogenic mutant allele imbalance showed that focal amplifications accounted for only 12% of mutant allele imbalance (Figure 1D). This is consistent with the observation that focally amplified oncogenes are rarely mutated, while most somatic oncogene mutations are not focally amplified (Figure S1E). Loss of the corresponding WT allele through loss-of-heterozygosity (LOH) or copy-neutral LOH (CN-LOH) accounted for 33% of all mutant oncogene allelic imbalance (Figure 1D), a proportion similar to that explained by ~single copy genomic gains of the mutant allele in diploid tumors. This finding was true even after correcting for LOH driven by a loss-of-function mutation in a known tumor suppressor gene (TSG) that arose in cis with an oncogenic driver mutation on the same chromosome arm. In fact, only 4% of all oncogenic mutant allele imbalance observed in this cohort could be attributed to “hitchhiking” on copy number changes likely driven by the selective pressure for biallelic loss of a mutant TSG on the same chromosome arm (Table S4). In addition, the genetic mechanisms underlying mutant allele imbalance in oncogenes were fundamentally different from those at the loci of TSGs, where 84% of allelic imbalance could be attributed to loss of the WT allele (Figure 1D). Together, these data indicate that ~single copy dosage gains are associated with many oncogenic mutations, while focal amplifications are an uncommon source of mutant allelic imbalance.
Positive and negative selection
We next sought to determine if the extensive allelic imbalance of mutant oncogenes targeted WT and mutant alleles at random. Using a cohort-level approach (Figure 1A), we reasoned that if having multiple copies of the mutant allele provides a fitness advantage to the cell, then most affected cancers will possess multiple copies of the mutant allele (positive selection). In the absence of any selective pressure (neutral selection), multiple copies of the mutant and WT allele should arise with equal frequency cohort-wide, a pattern expected for both passenger mutations and SNPs. Finally, if multiple copies of the mutant allele of an oncogene were deleterious (negative selection), a greater than expected number of affected cancers would possess multiple copies of the WT allele. First, we tested for mutant allele selection in tumors that harbored a known oncogenic driver mutation and had also undergone WGD. Tumors with WGD have an increased tolerance for subsequent copy number alterations (Bielski et al., 2018; Dewhurst et al., 2014), especially widespread single-copy losses. The pressure that selects for sub-tetraploid genomes after WGD is likely to be independent of the mutation status of individual oncogene loci. We thus sought to test whether these secondary single copy losses affecting chromosomes harboring oncogene driver mutations targeted each of the four alleles after WGD with equal likelihood or whether there was positive selective pressure to retain the alleles with the oncogenic gain-of-function mutation (Figure 2A). We addressed this question in 36 patients with tumors harboring: (1) a hotspot somatic oncogenic mutation [18 EGFR, 10 BRAF, 7 KRAS/NRAS, and one MAP2K1] that preceded WGD; (2) a biologically neutral heterozygous germline polymorphism in the same gene; and (3) a single-copy loss after WGD spanning the mutant oncogene. In these tumors, the reference and non-reference alleles of germline polymorphisms were retained or lost with equal frequency, as would be expected under neutral selection (Figure 2B). By contrast, oncogene copy number losses that resulted in mutant allele imbalance almost invariably retained the gain-of-function allele (Figures 2C and 2D). These data establish that there is positive selective pressure for single copy allelic imbalance during cancer evolution that favors alleles harboring gain-of-function oncogenic mutations. Furthermore, the signal of positive selection for the mutant allele (2 of 3 copies) was independent of oncogene, driver mutation, or affected cancer type (Figure S2).
Figure 2. Positive selection for gain-of-function mutant allele imbalance.

(A) Approach for utilizing single-copy losses after WGD to ascertain selection for oncogenic mutant alleles. (B) In 36 tumors, the observed mutant allele frequency in the tumor for germline heterozygous SNPs in oncogenes in regions spanned by single-copy losses acquired after WGD (as in panel A) are shown as a function of tumor purity. The mutant allele frequency for the SNPs when the reference or non-reference allele were retained or lost (dark and light green, respectively). Points are tumors and vertical lines are the 95% confidence interval (CI) of the mutant allele frequency and the solid/dashed lines represent the 2- and 1-copy lines corresponding to the count of mutant alleles at a 3-copy locus due to loss after WGD. (C) For the same tumors shown in panel B, the pattern of mutant allele imbalance for the corresponding gain-of-function mutations in the same oncogenes is shown. Solid line corresponds to expected mutant allele frequencies for retention of the mutant allele (elevated ratio of mutant to WT alleles). Points and error bars as described for panel B. (D) The rate at which the mutant allele is retained by the single-copy loss after WGD for the germline SNPs and driver mutations indicated in panels b and c, respectively (asterisk, p value = 4×10⁻⁷; Chi-squared test). Error bars are 95% CI. See also Figure S2.
To determine if mutant allele-specific selection was a broader feature of tumors with gain-of-function oncogene mutations, we compared selection for putative passenger and driver mutations in all oncogenes in which hotspot gain-of-function mutations were present in 10 or more samples in the cohort. Across all mutations in imbalanced regions, two patterns were evident. Among the germline SNPs and presumed passenger mutations (including variants of uncertain significance) that were acquired stochastically during tumor evolution, the mutant and WT alleles were selected largely at random and with near equal frequency (Figure 3A). This finding is consistent with the idea that these variants have no effect on fitness. In contrast, there was strong preferential selection for the mutant allele of nearly all known driver mutations (p value = 8.5×10⁻⁵, Wilcoxon test), reaffirming that even ~single copy dosage changes at mutant oncogenic loci enhance fitness and contribute to clonal outgrowth (Figure 3A).
Figure 3. Patterns of selection for oncogenic mutant allele imbalance across oncogenes.

(A) The rate of selection for the mutant allele among germline SNPs (gray) and somatic mutations that are either putative passenger mutations or variants of uncertain significance (VUS, blue) or known and likely driver mutations (red) in 24 oncogenes (p value as indicated, Wilcoxon test). Boxplot reflects the first and third quartile of data (boxes), the horizontal line is the median, the whiskers extend to +/− 1.5 times the inter-quartile range with outliers indicated as points. (B) The rate of selection for the mutant allele for the same 24 oncogenes and three mutation classes (as labeled) across all solid cancers grouped by function and/or pathway (RTK = receptor tyrosine kinases; MAPK = Ras/Raf/MEK/ERK pathway; PI3K = PI3 kinase signaling). The black bars at the top show the percentage of tumor samples with allelic imbalance for the indicated driver mutant oncogene(s). Error bars are the 95% CI. Dotted line indicates 50% and asterisk indicates statistically significant selection for the driver over passenger mutations by gene. KRAS, NRAS, and HRAS are grouped as a single mutant RAS category. (C) The pattern of mutant allele imbalance for the allele harboring the indicated driver mutations in haplo-essential mutant spliceosomal factors SF3B1, U2AF1, and SRSF2. Points are tumors and all tumors with allelic imbalance of any type are shown. Color indicates the mutant spliceosomal factor of interest (see inset), vertical lines are the 95% CI of the mutant allele frequency, and diagonal/curved dashed lines indicate the expected value in tumors in which the allele imbalance targets the mutant or WT allele (as labeled). Negative selection would be reflected as selection against the mutant allele. (D) The rate of selection for mutant allele-specific imbalance among the driver and likely passenger mutations in spliceosomal factors. Error bars are the 95% CI. P values as indicated, two-sided Fisher’s exact test. See also Figures S3 and S4.
We next explored selection at the level of individual oncogenes across all mechanisms of allelic imbalance and observed strong positive selection for the mutant alleles of driver mutations in a wide range of oncogenes of diverse functional classes (Figure 3B). In some oncogenes, tumors with allelic imbalance nearly always selected the mutant allele (e.g. 97% and 93% of oncogenic MET and MTOR mutations, respectively). In others such as IDH1, allelic imbalance was less common (15%), but still showed a strong positive selective pressure for the driver mutant allele (74% mutant allele-specific selection). Overall, while the rate and mechanisms of allelic imbalance spanning mutant oncogenes varied by cancer type due to lineage-specific differences in overall copy number burden, selection for the driver mutant allele was nevertheless universally high (Figure S3). Notably, VUS in multiple oncogenes displayed a slightly elevated rate of selection for the mutant allele (Figure 3B).
To ensure our classification of driver and passenger (or VUS) mutations in oncogenes did not inadvertently misclassify true driver mutations as VUSs, as would be predicted by recent saturation analyses of driver mutations in cancer (Chang et al., 2018; Lawrence et al., 2014), we expressed nine MAP2K1 (MEK1) variants of unknown significance that exhibited mutant or WT allele selection (6 and 3 respectively). Only one of the MEK1 variants whose mutant allele was selected (N109_R113del) and previously classified as VUS induced levels of ERK pathway activation that were greater than WT protein and similar to levels achieved by a known driver mutation (MAP2K1 K57N) (Figure S4). This finding, while not excluding alternative biochemical readouts, affirms the robustness of our mutation classification while implying a still occult oncogenic driver may exist in cis on chromosome 15q with MAP2K1 that is driving the apparent selection for the mutant allele of MAP2K1 passenger mutations. These results also imply that mutant allele imbalance may serve as a means of prioritization for functionally validating mutations of uncertain significance.
There were notable exceptions to the broad pattern of increased oncogenic mutant allele dosage during tumor evolution. For example, the rate of mutant allele-specific selection for driver mutations in genes encoding protein components of the spliceosome was depleted compared to both germline SNPs and presumed passenger mutations in the same genes (Figures 3A-B). This finding raised the possibility of strong negative selective pressure to maintain these oncogenic mutations in a heterozygous state in cancer cells. To test this hypothesis, we assessed tumors harboring hotspot mutations in genes that encode obligatory members of the human spliceosome (Graubert et al., 2012; Papaemmanuil et al., 2011; Yoshida et al., 2011) including SF3B1 (K700, R625, E902, K666, V701), U2AF1 (S34 and 124), and SRSF2 (P95). Genetically engineered mouse models of these mutations have shown that neither hemizygous (mutant/null) nor homozygous (mutant/mutant) states are tolerated (Fei et al., 2016; Lee et al., 2018; Zhou et al., 2015). As predicted by these data, we identified evidence of selection against possessing multiple copies of the mutant allele in spliceosome-mutant tumors with allelic imbalance (p value = 0.02; Figures 3C-D). While negative selection has been elusive in evolutionary studies of point mutations in cancer genomes (Martincorena et al., 2017; Weghorn and Sunyaev, 2017), our analytical framework integrating driver mutations and DNA copy number changes in oncogenes readily identified multiple spliceosome components as haplo-essential cancer genes. Taken together, these data indicate that selection for mutant oncogene allele imbalance is common in primary cancers, targets gain-of-function alleles, and that even when absent, reflects a selective pressure to maintain a precise configuration of mutant and WT alleles.
Evolutionary origins, from dependent to co-opted
We next explored the evolutionary origins of oncogenic mutant allele-specific imbalance by asking if this phenomenon is driven by the presence of an antecedent oncogenic mutation. This hypothesis predicts that allelic imbalance within regions of the genome encoding oncogenes will arise preferentially in tumors with driver mutations of those oncogenes. We therefore assessed the statistical significance of association between allelic imbalance spanning oncogenes in tumors that either harbored or lacked driver mutations in those genes in individual cancer types. Two classes of mutant oncogenes emerged from this analysis. In the first class, allelic imbalance was strongly dependent on the presence of a driver mutation, providing evidence that the oncogenic allele drove subsequent genetic evolution (Figure 4A; red bar). This observation, which was consistent with our initial hypothesis, was true for commonly mutated oncogenes including KRAS, NRAS, BRAF, EGFR, and ERBB2 in some, but not all, affected tumor types (Figure 4A).
Figure 4. Oncogenic mutations drive or co-opt their allelic imbalance.

(A) The statistical significance of enrichment of allelic imbalance in tumors by cancer type (indicated by color, see legend) harboring a driver mutation in the indicated gene over those tumors lacking a mutation (dashed line, false discovery rate (FDR) = 10%). The size of the circle corresponds to the number of driver-mutant cases by cancer type and oncogene. The evolutionary origins of allelic imbalance inferred from this analysis are indicated by red and pink bars at the right. (B) The rate of mutant allele-specific selection is shown for both driver mutations and presumed passenger mutations in those mutant oncogenes that drive the acquisition of their allelic imbalance (red, evolutionary dependent; as in panel A) or for those in which these two events evolved independently (pink). Neutral selection would be reflected as selection rates of approximately 50%, whereas positive selection would be reflected in increasing rates of selection. Error bars are the 95% CI. (C) The rate of selection for the KRAS mutant allele in affected lineages based on the evolutionary relationship between KRAS mutations and the underlying chromosome 12p changes leading to selection for the mutant allele (red and pink respectively, as labeled in panel A). Error bars are the 95% CI. (D-E) Overall survival in the presence or absence of KRAS allelic imbalance in patients with KRAS-mutant pancreatic adenocarcinomas (D) and colorectal cancers (E). Statistics and sample numbers as indicated from Cox proportional hazards models.
We also identified a second class of tumors in which chromosomal changes spanning oncogenic loci arose independently of driver mutation status in the respective genes. For these oncogenes and cancer types, driver mutations and chromosomal changes appear to be evolutionarily independent events because the latter were present at similar frequencies in tumors with and without a driver mutation (Figure 4A, pink bar). Importantly, however, we observed very high rate of selection for gain-of-function mutations (indicative of positive selection) across all oncogenic loci irrespective of the evolutionary origin of allelic imbalance (Figure 3A).
To further explore this dichotomy in the evolutionary origins of oncogenic mutant allele imbalance in greater depth, we assessed the rate of selection for the allele carrying the oncogenic mutation in both classes. As expected, the rate of selection for passenger mutations in known oncogenes was largely random (targeting the mutant and WT alleles with approximately equal frequency, i.e. neutral selection) and this was independent of the evolutionary origin of their allelic imbalance (Figure 4B). Interestingly, we also observed evidence for positive selection for the mutant allele in cancer types where the allelic imbalance was evolutionary dependent on the antecedent driver mutation and in tumors in which the driver mutation and allelic imbalance at the oncogene locus arose independently of each other (Figure 4B). This finding implies that when a driver mutation and a chromosomal change affecting the same oncogene arise independently during tumor evolution, the driver mutation co-opts the underlying genomic copy number alteration to increase mutant allele dosage.
This co-opting of independently arising chromosomal changes varied by gene and lineage, such as with the selection for oncogenic KRAS mutations across different cancer types. KRAS-mutant pancreatic, endometrial, and small bowel cancers were enriched for KRAS allelic imbalance compared to tumors of the same histology lacking a KRAS mutation (q-values = 3.6×10⁻⁶, 2.3×10⁻⁶, and 1×10⁻³ respectively). This enrichment was not evident in lung adenocarcinoma, colorectal cancer, ovarian cancer, and other solid tumors harboring KRAS driver mutations. In these cancer types, KRAS copy number changes were common but occurred at similar frequencies in both KRAS-mutant and WT tumors (Figure 4A). Nevertheless, imbalance favored the allele carrying the KRAS driver mutation to an equal extent in both evolutionary classes (dependent and independent respectively, Figure 4C). Moreover, despite lineage-specific differences in the evolutionary origins of allele imbalance, it had a similar adverse impact on patient survival. In KRAS-mutant pancreatic adenocarcinoma, where allelic imbalance was dependent on the antecedent KRAS mutation, its presence was associated with worse prognosis when compared to tumors with heterozygous KRAS mutations (Figure 4D). Similarly, allelic imbalance affecting the KRAS locus on chromosome 12p, which was independent of the presence of a driver KRAS mutation in colorectal cancers and co-opted by the latter for mutant dosage gains, was also associated with significantly worse prognosis in KRAS-mutant colorectal tumors (Figure 4E). Collectively, these data indicate that even where allelic imbalance results from chromosomal changes arising independently of driver mutations in these oncogenes, they are subsequently co-opted to produce a mutant allele-specific dosage increase that likely provides a fitness advantage to the evolving malignant clone.
Functional and therapeutic impact of loss of the WT allele
Among all oncogenic mutant allele imbalance, 33% was attributable to loss of the corresponding WT allele in this cohort (Figures 1C and 5A). The highly prevalent loss of the normal allele across multiple oncogenes and cancer types provides strong, albeit indirect, evidence that mutant allele dosage gains do not fully explain the growth advantage imparted by allelic imbalance. We therefore sought to identify a biologic basis for this frequent loss of the WT allele, reasoning that if the mutant allele was in competition with the WT allele, differences in fitness across allelic configurations would be dependent not only on the dose of mutant allele, but also by the presence or absence of the WT allele. To test this hypothesis, we investigated ligand-binding domain (LBD) mutations in ESR1, which arise in breast cancers that become refractory to anti-hormonal therapy (Toy et al., 2013). In total, 113 breast cancers in the cohort harbored clonal ESR1 hotspot mutations, of which 60% exhibited allelic imbalance. Loss of WT ESR1 drove 78% of ESR1 mutant allele-specific imbalance in these tumors (enrichment of LOH in ESR1-mutant relative to WT breast cancers, q-value = 0.007) (Figure 5A). While the background rate of LOH spanning the ESR1 locus is ~30% in WT ESR1 hormone receptor (HR)+ HER2− breast cancers independent of prior endocrine therapy exposure, the emergence of an ESR1 hotspot mutation driving resistance to endocrine therapy is associated with a significant increase in LOH targeting the WT allele for loss (Figure 5B). Moreover, in select patients for whom we had matched pairs of tumor specimens acquired both prior to and after progression on endocrine therapy, both the ESR1 hotspot mutation indicative of treatment resistance as well as LOH targeting WT ESR1 for loss were present only after progression (Figure S5).
Figure 5. Functional and therapeutic significance of oncogenic mutant allele imbalance.

(A) As in the Figure 4A, but assessing the enrichment for loss of the WT allele as the mechanism of mutant allele imbalance. (B) In HR+ HER2− breast cancers, the rate of LOH spanning ESR1 in tumors with or without ESR1 gain-of-function mutations and those acquired before or after endocrine therapy (asterisk, p value = 0.00015, Chi-squared test; numbers in black bars represent the number of affected cases). (C) Luciferase reporter activity (RLU) in HR− SKBr3 cells ectopically expressing HA-ERα wild-type (WT) or the specified mutant in proportions equivalent to homozygous mutant (left) to heterozygosity (right) in hormone-depleted medium. Error bars are +/− SD from triplicate experiments. (D) Duration of time of patients with BRAF V600E-mutant metastatic melanomas on vemurafenib therapy as a function of allelic imbalance of V600E and the mechanisms thereof [median PFS is 31.7 months (95% CI, 6-not reached) for patients with loss of WT BRAF versus 6.5 months (4.8-12) in the rest; hazard ratio, 4.4; p value = 0.01]. Complete pathologic responses are indicated in dark blue (p value = 0.01 comparing patients whose tumors lost the WT allele to those whose tumors that do not, two-sided Fisher’s exact test). See also Figure S5.
To determine if loss of the WT allele of ESR1 provided a fitness advantage in tumors with ESR1 mutations, we expressed the two most common ESR1 LBD mutations (Y537S and D538G) in estrogen receptor (ER)-negative SKBr3 breast cancer cells and measured their ability to promote transcription in low/no estradiol (E2) media using an estrogen response element (ERE)-luciferase construct as a surrogate for their biological activity (Toy et al., 2013). Both mutants induced elevated ERE-luciferase activity compared to WT ER when expressed in a homozygous configuration (Figure 5C). However, co-expressing WT ER in different proportions (modeling ratios corresponding to amplification, gain, and balanced heterozygosity), revealed dose-dependent attenuation of mutant ER activity with increasing proportions of WT ER (Figure 5C). These results support a model whereby WT ER can out-compete mutant ER and provides a mechanistic basis for the evolutionary selection for the LOH-mediated allelic imbalance of gain-of-function ESR1 mutant alleles observed in breast cancer patients. Taken together with the higher than expected selection for loss of the WT allele of gain-of-function mutations in a variety of oncogenes, these data support a broader growth inhibitory (or tumor suppressive) effect of the WT allele on oncogenic mutations, which has been a controversial idea in the Ras field for over two decades.
As with ESR1-mutant breast cancers, lineage-specific loss of the WT allele was highly prevalent at other oncogenic loci for which targeted therapies exist that inhibit the aberrant biochemical output of the encoded mutant protein (Figure 5A). We reasoned that mutant allele imbalance, and the underlying mechanism by which tumors achieve it, might impact the sensitivity of patients to pharmacologic inhibitors. To investigate this possibility, we assessed the outcomes of 53 patients with metastatic BRAF V600-mutant melanomas that were treated with a RAF inhibitor (Catalanotti et al., 2017). Overall, 42% of BRAF V600 mutations in melanomas are in allelic imbalance (Figure 3B), including 13% with loss of the WT BRAF allele. Whereas BRAF V600E allelic imbalance overall was not associated with differential responsiveness to vemurafenib therapy (p value = 0.51), the subset of patients with loss of WT BRAF had markedly improved progression-free survival (PFS) compared to patients that were either heterozygous or possessed genomic gains of the V600E allele (hazard ratio = 4.4, p value = 0.01). Moreover, 3 of the 5 patients with loss of WT BRAF had a pathological complete response versus only 4 of 48 without this tumor genotype (Figure 5D). These data suggest that an elevated mutant allele burden (Helias-Rodzewicz et al., 2015) is insufficient to alter sensitivity to Raf inhibitor therapy. Instead, the precise mechanism of mutant allele imbalance, specifically loss of the WT BRAF allele, may predict differential and even exceptional responses to therapy. While the biochemical basis for such enhanced sensitivity to RAF inhibitor therapy upon WT BRAF loss in BRAF V600E-mutant melanomas is unknown, these data are consistent with our recent studies of murine Kras-mutant myeloid leukemia (Burgess et al., 2017) and AKT1-mutant solid cancers treated with AKT inhibitors (Hyman et al., 2017a) and indicate that the presence and type of allelic imbalance among therapeutically actionable oncogenes may provide a novel biomarkers of drug sensitivity.
Discussion
Approximately half of all oncogenic driver mutations in human cancers are targeted by serial genetic changes, indicating that cancer cells gain a selective growth advantage by increasing and tuning the dosage of these mutations (Figure 6A). Indeed, cancer cells achieve a careful balance between normal and mutant alleles at oncogenic loci that is both gene and lineage-specific, driven by competitive fitness, with prognostic and therapeutic implications (Figures 6B-C). While established in a cohort of advanced cancers, many of which were acquired after prior therapy, these results are independent of the treatment history of affected patients. We corroborated the most common and significant findings here in an independent validation cohort of whole-exome sequencing of ~6000 tumor and matched normal specimens from The Cancer Genome Atlas (TCGA), which is comprised of primary untreated disease. Moreover, in key cancer types like pancreas and breast, when limiting our analysis to only the subset of patients with surgically resected untreated tumors, rather than those acquired from metastatic biopsies, we identified similar results. Collectively, these results indicate that mutant allele imbalance is a characteristic feature of oncogene biology, rather than a consequence of therapy.
Figure 6. Fitness and selection of serially evolving mutant oncogenes.

(A) Schematic representation whereby the acquisition of a heterozygous driver mutation in an oncogene (red), along with subsequent genomic events (not shown), leads to clonal outgrowth, representing approximately half of all human tumors with driver mutations in oncogenes (top). The other approximately half of all oncogenic driver mutations in human cancers that are targeted by serial genetic changes that when targeting the allele carrying the gain-of-function mutation confer a selective growth advantage on affected cancers by increasing and tuning the dosage of these mutations (bottom). (B) The preferential selection of the mutant allele by chromosomal changes (green) that come after a heterozygous oncogenic mutation (blue arrow) indicates that ~single copy dosage changes at mutant oncogenic loci enhance fitness and contribute to clonal outgrowth in most oncogenes, while in some specific contexts fitness appears to be reduced by such allelic imbalance where selection against possessing multiple copies of the mutant allele exists (red). (C) For oncogenes where (CN)-LOH is a predominant mechanism underlying their mutant allele imbalance, while ~single copy gain of the mutant allele can increase fitness, the effect of the oncogenic mutation may be attenuated by the continued presence of and competition with the WT allele, which drives selection for LOH as the mechanism of oncogenic mutant allele imbalance.
It was particularly notable that many chromosomal changes leading to oncogenic allele imbalance arose independently of the driver mutation during tumor evolution. Although allelic imbalance is not driven by the presence of a mutant allele in these cancers, it is subsequently co-opted to produce a mutant allele dosage increase that likely provides a fitness advantage to the evolving malignant clone. This phenomenon is analogous to the concept of “exaptation”, which refers to an evolutionary innovation that is co-opted for a role different from the function for which it originally arose (Gould, 1991; Gould and Vrba, 1982). The classical example is filamentous feathers, which evolved in non-avian dinosaurs long before the emergence of modern flying birds. Although the exact reason for the evolution of feathers is unknown (hypotheses include temperature regulation), they were only later adopted for flight (Gould and Vrba, 1982). Similarly, exaptation in cancer genomes appears to represent an evolutionary link between independently arising adaptive molecular aberrations (chromosomal copy number changes and driver mutations) that synergistically drive clonal outgrowth.
The results of this study have wide-ranging biological and therapeutic implications. A fundamental goal of modern cancer biology is to functionally characterize the biochemical and phenotypic effects of oncogenic alleles. How then do we interpret decades of over-expression experiments when the data presented here indicate that even modest dosage changes resulting in allelic imbalance can drive clonal outgrowth and modulate drug responses? Even with the adoption of clustered regularly interspaced short palindromic repeats (CRISPR)-Cas9-based gene targeting strategies for engineering expression of oncogenic alleles under the control of endogenous promoters, the prevalence of selection for allelic imbalance shown here and its effects on function must be considered during study design and cell type selection. This is especially true as abnormal tumor ploidy characterizes most cellular models of cancer. And as this cohort grows in sample size over time, we anticipate being able to investigate mutant allele-specific differences, with different driver mutations in the same oncogene potentially revealing distinct patterns of mutant allele imbalance, which can inform these studies. Our finding that allelic imbalance via loss of the WT allele significantly enhances response to molecularly targeted therapies reveals a new class of potential biomarkers of drug response. Indeed, assessing the allelic configuration of mutant oncogenes in the tumors of patients treated with targeted therapies as standard of care of upon enrollment on molecular-driven trials will likely advance our emerging understanding of the genetics of drug response and resistance.
STAR METHODS
CONTACT FOR REAGENT AND RESOURCE SHARING
Further information and requests for resources and reagents should be directed to and will be fulfilled by the Lead Contact, Barry S. Taylor (taylorb@mskcc.org).
EXPERIMENTAL MODEL AND SUBJECT DETAILS
Prospective sequencing cohort
The discovery cohort is comprised of 13,448 samples from 13,028 advanced cancer patients whose tumor and matched normal specimens were profiled as part of their active care between January 2014 and June 2017 at Memorial Sloan Kettering Cancer Center (MSKCC). Patient consent, specimen acquisition, sequencing, analysis, and reporting are described elsewhere (Zehir et al., 2017). This study was approved by the Memorial Sloan Kettering Cancer Center Institutional Review Board (IRB) and all patients provided written informed clinical or research consent (#12-245) for genomic analysis of their tumors. Briefly, matched tumor and normal specimens were sequenced (to 500-1000-fold sequence coverage) with a validated capture-based next-generation sequencing assay called MSK-IMPACT that is New York state-approved for clinical use (Cheng et al., 2015). This assay captures the coding exons and select introns of oncogenes, tumor suppressor genes, all genes targeted by either approved therapies or those investigational drugs being studied in clinical trials at our Center, and significantly mutated genes reported by large-scale cancer sequencing efforts (three versions of the assay were utilized, either 341, 410, or 468 genes). These sequencing data were analyzed as previously described (Cheng et al., 2015; Zehir et al., 2017) to detect somatic mutations, small insertions and deletions (indels), DNA copy number alterations (CNAs) and select translocations using DNA from both frozen and formalin fixed-paraffin embedded tissue.
Cellular models
SKBr3 cells were obtained from the American Type Culture Collection and were grown in DME HG: F-12 + NEAA media supplemented with 10% FBS (Corning) and 1% Penicillin: Streptomycin (Gemini). HEK-293H cells were maintained in DHE-HG with 10% FBS, 2 mM L-glutamine, and 50units/ml each of penicillin and streptomycin.
METHODS DETAILS
Driver mutations, oncogenes, and tumor suppressor genes
The classification of genes into oncogenes and tumor suppressor genes was determined using OncoKB, a curated knowledgebase of the oncogenic effects and treatment implications of mutations and cancer genes (http://www.oncokb.org/)(Chakravarty et al., 2017). Additionally, we included likely cancer genes with presumed oncogenic mutations present in five or more samples in the discovery cohort (Table S2). Driver mutations (both missense and in-frame indels), analyzed herein for the presence and type of allelic imbalance consist of: 1) recurrent mutational hotspots identified using an established statistical methodology (Chang et al., 2016) on a cohort of 24,592 human cancers (Chang et al., 2018), 2) statistically significant mutations clustering in proximity, with or without individually recurrent mutations, in the folded protein structure (Gao et al., 2017), and 3) mutations annotated as oncogenic or likely oncogenic by OncoKB from detailed review of the literature (Chakravarty et al., 2017). Presumed passenger mutations were those missense and synonymous mutations in the same genes that did not did score as mutational hotspots (private/singleton) or qualify by any of the aforementioned criteria. While it is possible that this classification will inadvertently capture still occult rare or private driver mutations, these are a likely rare minority of observed non-hotspot mutations overall. Germline variants utilized here were SNPs with population allele frequencies greater than 1% which pass all quality and calling filters in the ExAC compendium (Lek et al., 2016). We excluded known tumor suppressor genes from allelic imbalance analyses, unless otherwise noted for comparative purposes. Spliceosomal gene ZRSR2 was excluded from mutant allele selection analyses due to its location on the X-chromosome.
Allele-specific DNA copy number inference
To determine allelic configurations cohort- and genome-wide, total and allele-specific copy number states were inferred for all tumor samples using FACETS (version 0.5.6) (Shen and Seshan, 2016). We utilized a two-pass implementation whereby a low-sensitivity run (cval = 100) first determines the purity and log-ratio corresponding to diploidy. The copy number state of individual genes is determined by a run with higher sensitivity for focal events (cval = 50). Tumors for which FACETS could not resolve a minor allele in one of the 69 oncogenes (as defined above and included in Table S2) were curated to ensure convergence on the most appropriate fit. Individual mutations assigned a total copy number (TCN) of 0 were excluded from imbalance analyses. For tumors in which the purity estimates from the low-and high-sensitivity runs were discordant (i.e. varied by greater than 10%), we resolved a final tumor purity via direct comparison to mutant allele fractions. For this subset of tumors, those with three or more mutations in balanced regions were assigned the FACETS purity estimate nearest to two times the median mutant allele fraction in those regions. Overall, purity estimates derived from mutant allele fractions and from copy number were highly concordant with FACETS estimates (ρ = 0.71, p value < 2.2e-16), even for low purity tumor samples (Figure S3).
ESR1 loss of WT validation
SKBr3 cells were seeded in phenol red-free DME HG: F-12 + NEAA media supplemented with 10% charcoal stripped-FBS (hormone-depleted medium) (Invitrogen) at a density of 20,000 cells/well in 24 well plate, one day before transfection. Cells were transfected with 156 ng (per well) of 3X-ERE-TATA-Luciferase reporter, 31.5 ng (per well) of pRL-TK Renilla Luciferase plasmid, and 120 ng (per well) of vector encoding either HA-tagged WT ERα (60 ng) in combination with pcDNA3.1 (EV) (60 ng) or HA-tagged mutant ERα (Y537S/D538G) (60 ng) in combination with EV (60 ng) or HA-tagged mutant ERα (Y537S/D538G) (60 ng) in combination with HA-tagged WT ERα and pcDNA3.1 in different ratios (60+60+0; 60+30+30; 60+15+45 ng, respectively) using X-tremeGENE HP (Roche). Luciferase activity was determined 48 hr post-transfection using the Dual-Luciferase Reporter Assay System (Promega) according to manufacturer’s protocol. Veritas Microplate Luminometer (Promega) was used to measure Luciferase bioluminescence. All experiments were done in triplicates and for each sample Firefly Luciferase activity was normalized by Renilla luciferase activity.
MEK1 VUS validation experiments
MEK1 mutant constructs were generated from the C-terminal GFP-tagged MEK1 plasmid (pEGPF-N1-MEK1, Addgene, #14746) using the QuikChange II XL Site-Directed Mutagenesis Kit (Stratagene) and verified by Sanger sequencing. HEK-293H cells were transiently transfected with the wild-type or mutant MEK1-GFP plasmid using Lipofectamine® 2000 Transfection Reagent (Invitrogen). At 24 hr post-transfection, media was aspirated and refreshed for 1 hr at which time cells were harvested, lysed in 1% NP-40 buffer with protease and phosphatase inhibitors, protein quantified, and processed for immunoblotting. Rabbit polyclonal antibodies recognizing phosphorylated MEK1/2 (Ser217/221), MEK1/2, phosphorylated ERK1/2 (Thr202/Tyr204), and ERK1/2 were obtained from Cell Signaling. Rabbit monoclonal antibodies recognizing GFP and GAPDH were obtained from Cell Signaling. After incubation with horseradish peroxidase-conjugated secondary antibody, proteins were detected by chemiluminescence (SuperSignal West Pico Plus Chemiluminescent Substrate, Thermo Scientific) and visualized using the Fuji LAS-4000 imager (GE Life Sciences).
QUANTIFICATION AND STATISTICAL ANALYSIS
Sources of allelic imbalance
Tumors with greater than 50% of the autosomal genome having a major copy number greater than or equal to two were determined to have undergone whole genome-duplication (WGD). Mutant allele imbalance was categorized into one of multiple distinct sources and determined with respect to tumor ploidy: a) heterozygous loss of the WT allele in a diploid genome; b) copy-neutral LOH (CN-LOH); c) single-copy loss of the WT copy after WGD; d) low-level copy number gains, e) focal amplifications of the mutant allele regardless of tumor ploidy, and finally f) complex and/or combinatorial events such as CN-LOH after WGD (Fig. 1b, complex events not shown). These categories assume that the probability of acquiring an independent mutation at the same locus is zero and that mutations arise first to drive the selective pressure for imbalance. Categories of allelic imbalance were assigned based on the most parsimonious explanation of an observed copy number state. For example, a region of total and minor copy number of two and zero respectively (0,2) in a WGD-positive tumor is categorized as a mutation with LOH prior to WGD (three events) as opposed to a mutation followed by CN-LOH after which there was WGD and subsequent loss of two WT copies (four events). Similarly, a total and minor copy number configuration of two and zero (0,2) in a diploid tumor is interpreted as a mutation followed by CN-LOH whereas the same configuration in a WGD-positive tumor is interpreted as a single-copy loss of the WT copy (LOH) before WGD.
Subclonality, allele-specific retention and selection
We inferred clonality and mutant allele-specific retention by integrating mutant allele fractions calculated from high depth-of-coverage sequencing (median of >700-fold coverage for oncogenic driver mutations) with local copy number and purity estimates obtained from FACETS. For each somatic mutation, we calculated the 95% confidence interval (CI) for the mutant allele fraction using the normal approximation to the binomial distribution. Cancer cell fractions (CCF) were calculated using a binomial distribution and maximum likelihood (ML) estimation, normalized to produce posterior probabilities (McGranahan et al., 2015). Mutations were considered to be subclonal and excluded from subsequent analysis if the upper bound of the 95% CI for the CCF was less than one with Pr(CCF < 0.5) greater than 0.95. For the remaining likely clonal mutations, we inferred allele retention based on mutant-to-WT allele ratios. This analysis assumes that the probability of acquiring a second independent mutation at the same locus is approximately zero. By definition, all balanced mutations were assigned a ratio of 1. For mutations in regions of allelic imbalance (as determined by FACETS), we calculated mutant-to-WT allele ratios by comparing the observed mutant allele fraction versus the expected mutant allele fractions based on FACETS analysis.
Assuming clonality (i.e., CCF≈1), the expected mutant allele fraction is a function of tumor purity (Φ), local copy number (or total copy number, TCN), and the total number of mutant copies, N:
Specifically, mutations for which the lower bound of the 95% CI of the observed mutant allele fraction was greater than the expected mutant allele fraction for TCN/2 mutant copies (i.e., allelic balance) were assigned a ratio of major copy number divided by minor copy number. Conversely, mutations for which the upper bound of the 95% CI for the mutant allele fraction was less than the expected mutant allele fraction for TCN/2 mutant copies were assigned a ratio of minor copy number divided by major copy number. Mutations for which the 95% CI for the mutant allele fraction intersected the curve corresponding to allelic balance were deemed indeterminate and assigned a ratio of 1 by default. Finally, we defined retention for the mutant allele as any mutation with mutant to WT allele ratio > 1. The rate of mutant allele-specific retention for germline SNPs was slightly less than 50% (Fig. 2A) likely due to the effect of reference bias (Degner et al., 2009). For presumed passengers, the rate of mutant allele retention, while overlapping 50%, was slightly was greater than for germline SNPs likely owing to misclassifying a small number of occult driver mutations among the presumed passenger mutations and variants of uncertain significance
Timing of mutations relative to WGD
The timing of mutations relative to WGD in affected tumors was also determined using the most parsimonious explanation of an observed copy number state. For example, a mutation in a region with four total copies (TCN=4) and two copies each of the minor and major alleles was regarded as a single mutation arising before WGD as opposed to multiple independent and identical mutations affecting different alleles at the same locus arising after WGD. Therefore, clonal mutations in which minor and major copy number were both two were classified as having arisen before WGD. In regions with TCN≥3, clonal mutations with implied copy number greater than one were classified as arising before WGD. Clonal mutations in regions with TCN=3 and an implied copy number less than or equal to one were classified as ambiguous as we could not differentiate between 1) a mutation arising before WGD followed by a single-copy loss of the mutant allele after WGD, and 2) a single-copy loss after WGD followed by a mutation. Finally, all other clonal mutations were classified as having arisen before WGD, and all subclonal mutations were classified as having arisen after WGD. Our analysis of single-copy losses relative to WGD compared regions with a TCN and MCN of 3 and 2 respectively (i.e., a loss after WGD) versus those regions with a TCN and MCN of 2 and 0 respectively (i.e., a loss before WGD). Regions affected by multiple copy number losses after WGD were not considered in this analysis. Overall, WGD occurred after the oncogenic mutation in the vast majority of cases (82%) for which the relative timing of mutations could be unambiguously determined.
Permutation testing and enrichment analysis
For each combination of oncogene and cancer type, we determined the number of tumors (n) exhibiting allelic imbalance spanning the gene of interest for those tumors harboring hotspots, excluding subclonal mutations. Those tumors lacking hotspot mutations in the gene of interest were randomly sampled with replacement N times and the number of tumors with allelic imbalance spanning the same locus was calculated. This was repeated for each gene and cancer type combination 100,000 times to produce empirical null distributions of imbalance at the locus. For all such combinations, a modified z-score (based on the median and median absolute deviation) was used to determine significant enrichment of allelic imbalance in those tumors harboring hotspots compared to the background distribution of wild-type tumors. The procedure was similarly repeated to determine enrichment for loss of WT. All p values were corrected for multiple testing using the Benjamini-Hochberg procedure (Benjamini and Hochberg, 1995). Findings were further corroborated in an independent validation cohort of whole-exome sequencing of tumor and matched normal specimens from 5,853 patients with primary untreated human cancer obtained from The Cancer Genome Atlas (TCGA). All specimens were analyzed with methods identical to those used for the discovery cohort (see above), with oncogene-cancer type pairs similarly tested for enrichment of allelic imbalance. In individual cancer types and for individual mutant oncogenes for which sufficient sample size existed in the validation cohort (Table S1), key significant enrichments identified in the discovery cohort were independently validated for a number of genes including KRAS in lung and colorectal cancers, EGFR in lung and brain tumors, and BRAF and NRAS in melanoma.
RAF inhibitor treatment response analysis and cohort
The RAF inhibitor response cohort is described in detail in a separate study (Catalanotti et al., 2017). Briefly, 53 patients with stage IV or unresected stage III BRAF V600E/K-mutant melanoma were treated as part of IRB-approved therapeutic studies or as stand-of-care practice. Treatment responses were assessed by Response Evaluation Criteria in Solid Tumors v1.1 (RECIST), and by Response Grade, a composite measure of the average of the percentage of lesion shrinkage and the duration of response. Progression-free survival (PFS by RECIST 1.1) was defined as the time from the start of RAF inhibitor therapy until the date of progression on the RAF inhibitor, date of death or the date of last follow up. Overall survival (OS) was measured as the time from the start of RAF inhibitor therapy until the date of death; patients alive at last follow-up were censored at the date of last documented contact. Pre-treatment tumor and matched normal DNA were sequenced with a 250-gene version of the MSK-IMPACT assay and analyzed as previously described (Catalanotti et al., 2017). FACETS analysis was utilized as described above to estimate tumor purity, ploidy, and allele-specific copy number. Patients in which FACETS could not resolve a minor allele in BRAF or in one of the 69 oncogenes (Table S1) were further manually reviewed to validate model accuracy and converge on the most appropriate fit. For the purposes of correlating with response and outcome, BRAF mutant allelic imbalance was categorized into two classes: loss of WT BRAF and gain of BRAF V600E, the latter of which including both low-level gains and high-level amplifications targeting the BRAF locus.
Statistical analysis and figures
Cox regression and Kaplan-Meier analyses were performed and generated using the R survival package. Additional figures were generated using R ggplot2 and similar.
DATA AND SOFTWARE AVAILABILITY
All genomic data utilized here is available in cBioPortal for Cancer Genomics (Cerami et al., 2012; Gao et al., 2013) and is also deposited in the European Variation Archive (accession number: PRJEB28874, https://www.ebi.ac.uk/eva/?eva-study=PRJEB28874). R code to perform the analyses described here is available with this manuscript (https://github.com/taylor-lab/AI)
Supplementary Material
related to Figure 1: Oncogenes and driver mutations analyzed.
related to Figure 1: Allelic state of somatic mutations in prospective cohort.
KEY RESOURCES TABLE
| REAGENT or RESOURCE | SOURCE | IDENTIFIER |
|---|---|---|
| Antibodies | ||
| Rabbit polyclonal, Phospho-MEK (Ser217/221) | Cell Signal | Cat#9121; RRID: AB_331649 |
| Rabbit polyclonal, Anti-MEK | Cell Signal | Cat#9122; RRID: AB_823567 |
| Rabbit polyclonal, Phospho ERK (Thr202/Tyr204) | Cell Signal | Cat#9109; RRID: AB_331646 |
| Rabbit polyclonal, Anti-ERK | Cell Signal | Cat#9102; RRID: AB_330744 |
| Rabbit monoclonal, Anti-GFP | Cell Signal | Cat#2956; RRID: AB_1196615 |
| Rabbit monoclonal, Anti-GAPDH | Cell Signal | Cat#2118; RRID: AB_561053 |
| Biological Samples | ||
| MSK-IMPACT | Zehir et al. 2017 | N/A |
| Chemicals, Peptides, and Recombinant Proteins | ||
| pEGPF-N1-MEK1 | Addgene | Cat#14746 |
| 3X-ERE-TATA-luciferase reporter | Addgene | Cat#11354 |
| pRL-TK Renilla luciferase plasmid | Promega | Cat#E2231 |
| HA-tagged WT ERα | This study | N/A |
| pcDNA3.1 (EV) | Thermo Fisher | Cat#V79020 |
| HA-tagged ERα Y537S | This study | N/A |
| HA-tagged ERα D538G | This study | N/A |
| Critical Commercial Assays | ||
| QuikChange II XL Site-Directed Mutagenesis Kit | Stratagene | Cat#200521 |
| SuperSignal West Pico Plus Chemiluminescent | Thermo Fisher | Cat#34577 |
| Lipofectamine 2000 Transfection Reagent | Invitrogen | Cat#11668027 |
| Dual-Luciferase Reporter Assay System | Promega | Cat#E1910 |
| Deposited Data | ||
| Prospective DNA sequencing | This study | Accession number for the prospective sequencing data reported in this study is EVA: PRJEB28874, https://www.ebi.ac.uk/eva/?eva-study=PRJEB28874 |
| Experimental Models: Cell Lines | ||
| SKBr3 | ATCC | HTB30 |
| HEK-293H | ATCC | CRL-1573 |
| Software and Algorithms | ||
| R for Statistical Computing | R Foundation | http://www.r-project.org |
| FACETS | Shen, et al. 2016 | http://github.com/mskcc/facets |
| FACETS-suite | This study | http://github.com/mskcc/facets-suite |
| Other | ||
| BAM files for TCGA exomes | TCGA | https://cancergenome.nih.gov |
Highlights.
Mutant allele imbalance affects ~half of all oncogenic driver mutations in cancer
Positive and negative selection shapes the allelic configuration of mutant oncogenes
Mutant dosage gains and stoichiometric changes drive fitness and growth advantages
Mutant oncogene zygosity dictates prognosis and enhanced therapeutic sensitivity
Bielski et al. describe widespread allele imbalance in cancer, which is selected for via modest dosage increases of gain-of-fitness mutations and can be driven by antecedent oncogenic mutations. Loss of the normal allele is driven by competitive fitness and correlates with enhanced response to targeted therapies.
Significance.
Our study establishes the zygosity of mutant oncogenes as a foundation of their biology. Cancer cells gain a selective growth advantage by tuning the dosage and stoichiometry of oncogenic driver mutations in a gene- and lineage-specific manner driven in part by competitive fitness, alluding to a broader growth suppressive effect of the WT allele on mutant oncogenes. This finding has clinical implications as allelic imbalance of mutant oncogenes represents a biomarker of sensitivity to molecularly targeted therapy. Our work also provides an evolutionary framework for understanding how independently evolving molecular changes in cancer can cooperate. Collectively, we argue that oncogenic driver mutations must be considered in the context of their zygosity with broad implications for tumor biology and precision oncology.
Acknowledgments
We thank O. Abdel-Wahab and members of the Taylor laboratory and Marie-Josée and Henry R. Kravis Center for Molecular Oncology for discussions. This work was supported by National Institutes of Health awards P30 CA008748, T32 CA009207 (A.M.S.), R37C CA72614 (K.S.), R01 CA180037 (K.S.), U54 OD020355 (D.B.S. and B.S.T.), R01 CA207244 (D.M.H. and B.S.T.), R01 CA204749 (B.S.T.), and awards from the American Cancer Society (RSG-15-067-01-TBG), Sontag Foundation, Robertson Foundation, and Prostate Cancer Foundation (B.S.T.). Somatic mutational data from the cohort described here is available in the cBioPortal for Cancer Genomics (http://cbioportal.org/).
Footnotes
Declaration of Interests
The authors declare no competing interests.
Publisher's Disclaimer: This is a PDF file of an unedited manuscript that has been accepted for publication. As a service to our customers we are providing this early version of the manuscript. The manuscript will undergo copyediting, typesetting, and review of the resulting proof before it is published in its final citable form. Please note that during the production process errors may be discovered which could affect the content, and all legal disclaimers that apply to the journal pertain.
References
- Ambrogio C, Kohler J, Zhou ZW, Wang H, Paranal R, Li J, Capelletti M, Caffarra C, Li S, Lv Q, et al. (2018). KRAS Dimerization Impacts MEK Inhibitor Sensitivity and Oncogenic Activity of Mutant KRAS. Cell 172, 857–868 e815. [DOI] [PubMed] [Google Scholar]
- Benjamini Y, and Hochberg Y (1995). Controlling the False Discovery Rate: A Practical and Powerful Approach to Multiple Testing. Journal of the Royal Statistical Society Series B (Methodological) 57, 289–300. [Google Scholar]
- Bentley C, Jurinka SS, Kljavin NM, Vartanian S, Ramani SR, Gonzalez LC, Yu K, Modrusan Z, Du P, Bourgon R, et al. (2013). A requirement for wild-type Ras isoforms in mutant KRas-driven signalling and transformation. Biochem J 452, 313–320. [DOI] [PubMed] [Google Scholar]
- Bielski CM, Zehir A, Penson AV, Donoghue MTA, Chatila W, Armenia J, Chang MT, Schram AM, Jonsson P, Bandlamudi C, et al. (2018). Genome doubling shapes the evolution and prognosis of advanced cancers. Nat Genet 50, 1189–1195. [DOI] [PMC free article] [PubMed] [Google Scholar]
- Bremner R, and Balmain A (1990). Genetic changes in skin tumor progression: correlation between presence of a mutant ras gene and loss of heterozygosity on mouse chromosome 7. Cell 61, 407–417. [DOI] [PubMed] [Google Scholar]
- Burgess MR, Hwang E, Mroue R, Bielski CM, Wandler AM, Huang BJ, Firestone AJ, Young A, Lacap JA, Crocker L, et al. (2017). KRAS Allelic Imbalance Enhances Fitness and Modulates MAP Kinase Dependence in Cancer. Cell 168, 817–829 e815. [DOI] [PMC free article] [PubMed] [Google Scholar]
- Catalanotti F, Cheng DT, Shoushtari AN, Johnson DB, Panageas KS, Momtaz P, Higham C, Won HH, Harding JJ, Merghoub T, et al. (2017). PTEN Loss-of- Function Alterations Are Associated With Intrinsic Resistance to BRAF Inhibitors in Metastatic Melanoma. JCO Precision Oncology, 1–15. [DOI] [PMC free article] [PubMed] [Google Scholar]
- Cerami E, Gao J, Dogrusoz U, Gross BE, Sumer SO, Aksoy BA, Jacobsen A, Byrne CJ, Heuer ML, Larsson E, et al. (2012). The cBio cancer genomics portal: an open platform for exploring multidimensional cancer genomics data. Cancer Discov 2, 401–404. [DOI] [PMC free article] [PubMed] [Google Scholar]
- Chakravarty D, Gao J, Phillips SM, Kundra R, Zhang H, Wang J, Rudolph JE, Yaeger R, Soumerai T, Nissan MH, et al. (2017). OncoKB: A Precision Oncology Knowledge Base. JCO Precis Oncol 2017. [DOI] [PMC free article] [PubMed] [Google Scholar]
- Chang MT, Asthana S, Gao SP, Lee BH, Chapman JS, Kandoth C, Gao J, Socci ND, Solit DB, Olshen AB, et al. (2016). Identifying recurrent mutations in cancer reveals widespread lineage diversity and mutational specificity. Nat Biotechnol 34, 155–163. [DOI] [PMC free article] [PubMed] [Google Scholar]
- Chang MT, Bhattarai TS, Schram AM, Bielski CM, Donoghue MTA, Jonsson P, Chakravarty D, Phillips S, Kandoth C, Penson A, et al. (2018). Accelerating Discovery of Functional Mutant Alleles in Cancer. Cancer Discov 8, 174–183. [DOI] [PMC free article] [PubMed] [Google Scholar]
- Cheng DT, Mitchell TN, Zehir A, Shah RH, Benayed R, Syed A, Chandramohan R, Liu ZY, Won HH, Scott SN, et al. (2015). Memorial Sloan Kettering-Integrated Mutation Profiling of Actionable Cancer Targets (MSK-IMPACT): A Hybridization Capture- Based Next-Generation Sequencing Clinical Assay for Solid Tumor Molecular Oncology. The Journal of molecular diagnostics : JMD 17, 251–264. [DOI] [PMC free article] [PubMed] [Google Scholar]
- Degner JF, Marioni JC, Pai AA, Pickrell JK, Nkadori E, Gilad Y, and Pritchard JK (2009). Effect of read-mapping biases on detecting allele-specific expression from RNA- sequencing data. Bioinformatics 25, 3207–3212. [DOI] [PMC free article] [PubMed] [Google Scholar]
- Dewhurst SM, McGranahan N, Burrell RA, Rowan AJ, Gronroos E, Endesfelder D, Joshi T, Mouradov D, Gibbs P, Ward RL, et al. (2014). Tolerance of whole-genome doubling propagates chromosomal instability and accelerates cancer genome evolution. Cancer Discov 4, 175–185. [DOI] [PMC free article] [PubMed] [Google Scholar]
- Fei DL, Motowski H, Chatrikhi R, Prasad S, Yu J, Gao S, Kielkopf CL, Bradley RK, and Varmus H (2016). Wild-Type U2AF1 Antagonizes the Splicing Program Characteristic of U2AF1-Mutant Tumors and Is Required for Cell Survival. PLoS Genet 12, e1006384. [DOI] [PMC free article] [PubMed] [Google Scholar]
- Gao J, Aksoy BA, Dogrusoz U, Dresdner G, Gross B, Sumer SO, Sun Y, Jacobsen A, Sinha R, Larsson E, et al. (2013). Integrative analysis of complex cancer genomics and clinical profiles using the cBioPortal. Sci Signal 6, pl1. [DOI] [PMC free article] [PubMed] [Google Scholar]
- Gao J, Chang MT, Johnsen HC, Gao SP, Sylvester BE, Sumer SO, Zhang H, Solit DB, Taylor BS, Schultz N, and Sander C (2017). 3D clusters of somatic mutations in cancer reveal numerous rare mutations as functional targets. Genome Med 9, 4. [DOI] [PMC free article] [PubMed] [Google Scholar]
- Garraway LA, and Lander ES (2013). Lessons from the cancer genome. Cell 153, 17–37. [DOI] [PubMed] [Google Scholar]
- Gould SJ (1991). Exaptation: a crucial tool for evolutionary psychology. J Social Issues 47, 43–65. [Google Scholar]
- Gould SJ, and Vrba ES (1982). Exaptation-a missing term in the science of form. Paleobiology 8, 4–15. [Google Scholar]
- Graubert TA, Shen D, Ding L, Okeyo-Owuor T, Lunn CL, Shao J, Krysiak K, Harris CC, Koboldt DC, Larson DE, et al. (2012). Recurrent mutations in the U2AF1 splicing factor in myelodysplastic syndromes. Nat Genet 44, 53–57. [DOI] [PMC free article] [PubMed] [Google Scholar]
- Helias-Rodzewicz Z, Funck-Brentano E, Baudoux L, Jung CK, Zimmermann U, Marin C, Clerici T, Le Gall C, Peschaud F, Taly V, et al. (2015). Variations of BRAF mutant allele percentage in melanomas. BMC Cancer 15, 497. [DOI] [PMC free article] [PubMed] [Google Scholar]
- Hyman DM, Smyth LM, Donoghue MTA, Westin SN, Bedard PL, Dean EJ, Bando H, El-Khoueiry AB, Perez-Fidalgo JA, Mita A, et al. (2017a). AKT Inhibition in Solid Tumors With AKT1 Mutations. J Clin Oncol 35, 2251–2259. [DOI] [PMC free article] [PubMed] [Google Scholar]
- Hyman DM, Taylor BS, and Baselga J (2017b). Implementing Genome-Driven Oncology. Cell 168, 584–599. [DOI] [PMC free article] [PubMed] [Google Scholar]
- Knudson AG Jr. (1971). Mutation and cancer: statistical study of retinoblastoma. Proc Natl Acad Sci U S A 68, 820–823. [DOI] [PMC free article] [PubMed] [Google Scholar]
- Lawrence MS, Stojanov P, Mermel CH, Robinson JT, Garraway LA, Golub TR, Meyerson M, Gabriel SB, Lander ES, and Getz G (2014). Discovery and saturation analysis of cancer genes across 21 tumour types. Nature 505, 495–501. [DOI] [PMC free article] [PubMed] [Google Scholar]
- Lee SC, North K, Kim E, Jang E, Obeng E, Lu SX, Liu B, Inoue D, Yoshimi A, Ki M, et al. (2018). Synthetic Lethal and Convergent Biological Effects of Cancer- Associated Spliceosomal Gene Mutations. Cancer Cell 34, 225–241 e228. [DOI] [PMC free article] [PubMed] [Google Scholar]
- Lek M, Karczewski KJ, Minikel EV, Samocha KE, Banks E, Fennell T, O’Donnell-Luria AH, Ware JS, Hill AJ, Cummings BB, et al. (2016). Analysis of protein-coding genetic variation in 60,706 humans. Nature 536, 285–291. [DOI] [PMC free article] [PubMed] [Google Scholar]
- Martincorena I, Raine KM, Gerstung M, Dawson KJ, Haase K, Van Loo P, Davies H, Stratton MR, and Campbell PJ (2017). Universal Patterns of Selection in Cancer and Somatic Tissues. Cell 171, 1029–1041 e1021. [DOI] [PMC free article] [PubMed] [Google Scholar]
- McGranahan N, Favero F, de Bruin EC, Birkbak NJ, Szallasi Z, and Swanton C (2015). Clonal status of actionable driver events and the timing of mutational processes in cancer evolution. Sci Transl Med 7, 283ra254. [DOI] [PMC free article] [PubMed] [Google Scholar]
- Mueller S, Engleitner T, Maresch R, Zukowska M, Lange S, Kaltenbacher T, Konukiewitz B, Ollinger R, Zwiebel M, Strong A, et al. (2018). Evolutionary routes and KRAS dosage define pancreatic cancer phenotypes. Nature 554, 62–68. [DOI] [PMC free article] [PubMed] [Google Scholar]
- Papaemmanuil E, Cazzola M, Boultwood J, Malcovati L, Vyas P, Bowen D, Pellagatti A, Wainscoat JS, Hellstrom-Lindberg E, Gambacorti-Passerini C, et al. (2011). Somatic SF3B1 mutation in myelodysplasia with ring sideroblasts. The New England journal of medicine 365, 1384–1395. [DOI] [PMC free article] [PubMed] [Google Scholar]
- Shen R, and Seshan VE (2016). FACETS: allele-specific copy number and clonal heterogeneity analysis tool for high-throughput DNA sequencing. Nucleic Acids Res 44, e131. [DOI] [PMC free article] [PubMed] [Google Scholar]
- Soh J, Okumura N, Lockwood WW, Yamamoto H, Shigematsu H, Zhang W, Chari R, Shames DS, Tang X, MacAulay C, et al. (2009). Oncogene mutations, copy number gains and mutant allele specific imbalance (MASI) frequently occur together in tumor cells. PLoS One 4, e7464. [DOI] [PMC free article] [PubMed] [Google Scholar]
- To MD, Perez-Losada J, Mao JH, Hsu J, Jacks T, and Balmain A (2006). A functional switch from lung cancer resistance to susceptibility at the Pas1 locus in Kras2LA2 mice. Nat Genet 38, 926–930. [DOI] [PMC free article] [PubMed] [Google Scholar]
- To MD, Rosario RD, Westcott PM, Banta KL, and Balmain A (2013). Interactions between wild-type and mutant Ras genes in lung and skin carcinogenesis. Oncogene 32, 4028–4033. [DOI] [PMC free article] [PubMed] [Google Scholar]
- To MD, Wong CE, Karnezis AN, Del Rosario R, Di Lauro R, and Balmain A (2008). Kras regulatory elements and exon 4A determine mutation specificity in lung cancer. Nat Genet 40, 1240–1244. [DOI] [PMC free article] [PubMed] [Google Scholar]
- Toy W, Shen Y, Won H, Green B, Sakr RA, Will M, Li Z, Gala K, Fanning S, King TA, et al. (2013). ESR1 ligand-binding domain mutations in hormone-resistant breast cancer. Nat Genet 45, 1439–1445. [DOI] [PMC free article] [PubMed] [Google Scholar]
- Varmus HE (1984). The molecular genetics of cellular oncogenes. Annu Rev Genet 18, 553–612. [DOI] [PubMed] [Google Scholar]
- Weghorn D, and Sunyaev S (2017). Bayesian inference of negative and positive selection in human cancers. Nat Genet 49, 1785–1788. [DOI] [PubMed] [Google Scholar]
- Westcott PM, Halliwill KD, To MD, Rashid M, Rust AG, Keane TM, Delrosario R, Jen KY, Gurley KE, Kemp CJ, et al. (2015). The mutational landscapes of genetic and chemical models of Kras-driven lung cancer. Nature 517, 489–492. [DOI] [PMC free article] [PubMed] [Google Scholar]
- Yoshida K, Sanada M, Shiraishi Y, Nowak D, Nagata Y, Yamamoto R, Sato Y, Sato-Otsubo A, Kon A, Nagasaki M, et al. (2011). Frequent pathway mutations of splicing machinery in myelodysplasia. Nature 478, 64–69. [DOI] [PubMed] [Google Scholar]
- Zehir A, Benayed R, Shah RH, Syed A, Middha S, Kim HR, Srinivasan P, Gao J, Chakravarty D, Devlin SM, et al. (2017). Mutational landscape of metastatic cancer revealed from prospective clinical sequencing of 10,000 patients. Nat Med 23, 703–713. [DOI] [PMC free article] [PubMed] [Google Scholar]
- Zhang Z, Wang Y, Vikis HG, Johnson L, Liu G, Li J, Anderson MW, Sills RC, Hong HL, Devereux TR, et al. (2001). Wildtype Kras2 can inhibit lung carcinogenesis in mice. Nat Genet 29, 25–33. [DOI] [PubMed] [Google Scholar]
- Zhou Q, Derti A, Ruddy D, Rakiec D, Kao I, Lira M, Gibaja V, Chan H, Yang Y, Min J, et al. (2015). A chemical genetics approach for the functional assessment of novel cancer genes. Cancer Res 75, 1949–1958. [DOI] [PubMed] [Google Scholar]
Associated Data
This section collects any data citations, data availability statements, or supplementary materials included in this article.
Supplementary Materials
related to Figure 1: Oncogenes and driver mutations analyzed.
related to Figure 1: Allelic state of somatic mutations in prospective cohort.