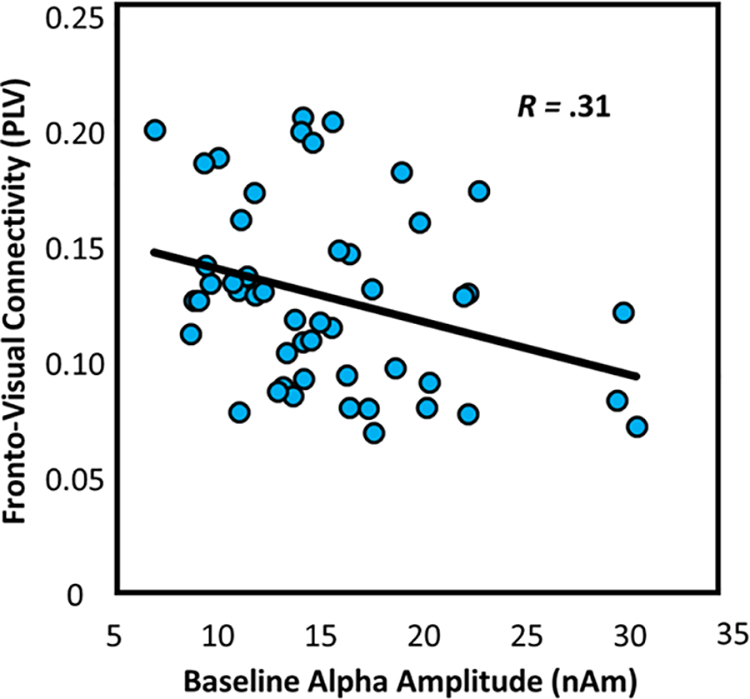
Figure 6.

Spontaneous (basal) alpha activity at baseline predicts theta functional connectivity. Scatterplots displaying the relationship between spontaneous alpha amplitude (in nAm) during the baseline on the x-axis and fronto-visual connectivity (in PLV) on the y-axis. The respective line of best fit and R value for the simple regression is overlaid on the plot.
