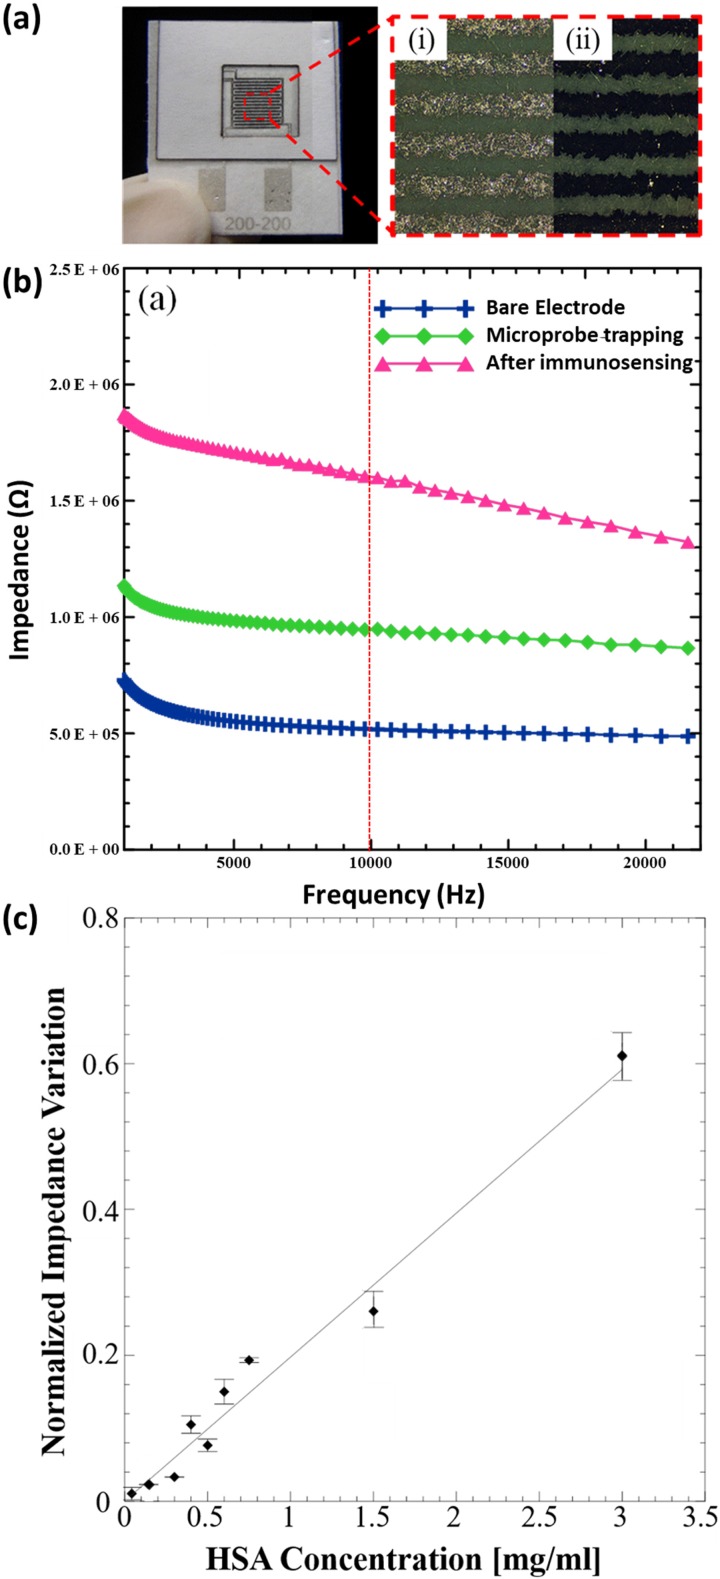
FIG. 5.
(a) Image of the paper based immunosensor with the magnified area showing the silver microelectrode surface observed under an optical microscope (i) before and (ii) after trapping of MPs using p-DEP. (b) EIS spectra (bode plot) for each step during immunosensor fabrication and operation. (c) Normalized impedance variations for different concentrations of HSA.

